Hormone Concentrations, Amino Acid Utilization and. Responses to Thyrotropin-Releasing Hormone in. Fleeceweight-Selected and Control Romney Rams.
Aust. J. Agric. Res., 1992, 43, 1845-58
Seasonal Variation in Plasma Metabolite and Hormone Concentrations, Amino Acid Utilization and Responses to Thyrotropin-Releasing Hormone in Fleeceweight-Selected and Control Romney Rams Y. X. Sun,A T. C. MattheqAqC H. T. and S. N. ~ ~ C u t c h e A$D on A
lair,^
P. M. H ~ r r i s , ~
Department of Animal Science, Massey University, Palmerston North, New Zealand. DSIR Grasslands, Palmerston North, New Zealand. Present Address: New Zealand Wool Board, Private Bag, Wellington, New Zealand. Reprint requests.
Abstract Two studies were conducted to examine the effects of season on differences between the Massey University fleeceweight-selected and control lines of Romney sheep in hormone and metabolite concentrations, phenylalanine irreversible loss rate, urea and creatinine clearance and space, and response to an intravenous thyrotropin releasing hormone (TRH) challenge. Rams from the two lines were studied in autumn, winter and spring (5, 9 and 13 months of age) in Experiment 1 or winter and spring (9 and 14 months of age) in Experiment 2. Basal concentrations of urea and creatinine were lower in fleeceweight-selected (FW) than in control (C) rams in both experiments. A significant linexseason interaction, reflecting a greater difference between the lines in winter than in autumn or spring, was observed only in Experiment 1. This interaction could not be accounted for by a corresponding effect on distribution space or clearance of these metabolites. Phenylalanine irreversible loss rate (per unit metabolic body weight) was significantly lower in FW than in C rams, but the magnitude of this difference was not influenced by season (winter v. spring). No differences were observed between the lines in basal concentrations of thyroxine or triiodothyronine, or in the responses of these hormones to TRH. Prolactin response to TRH was lower in FW than in C rams during spring, but this reflected the higher pre-challenge concentrations of this hormone in FW rams. It is concluded that, compared with C rams, FW rams have lower basal concentrations of urea and lower irreversible loss rates (per unit metabolic body weight) of phenylalanine. However, these observations do not explain the less seasonal patterns of wool production in fleeceweight-selected compared with control sheep. Keywords: fleeceweight, selection, urea, irreversible loss, thyroid, season.
Introduction The identification of indirect predictors of genetic merit for fleeceweight (i.e. characteristics of the animal, other than its own fleeceweight, which can be used to predict genetic merit for wool production) has the potential to increase rates of genetic gain for fleece production by allowing more accurate selection of superior animals at an early age (Antram et al. 1991). A useful first approach to the identification of such indirect predictors is the examination of physiological and other differences between lines of animals divergently selected on the basis of fleeceweight (Blair et al. 1990). We have previously reported that sheep from
Y. X. Sun et al.
the Massey University fleeceweight-selected line of Romney sheep exhibit lower plasma concentrations of urea, creatinine and thyroxine than sheep of the control line (McCutcheon e t al. 1987; Clark e t al. 1989; Thomson et al. 1989; Sun e t al. 1991). However, differences between the lines have not been consistent in the various studies, particularly with respect to between-line differences in plasma concentrations of creatinine and thyroxine. Hough e t al. (1988) also reported lower circulating thyroxine levels in Merino sheep of superior genetic merit for wool production, but this difference was not confirmed in a subsequent study of sheep from the same lines (Williams e t al. 1990). In addition, the apparent relationship between circulating urea concentration and genetic merit for fleeceweight observed in our lines has not been observed in Australian Merino lines (Hough e t al. 1988; Williams et al. 1991). McClelland e t al. (1987) reported that yearling sheep from the Massey University fleeceweight-selected line exhibit less marked seasonality of wool production than those from the control line. Thus if the observed differences between the lines in basal concentrations of hormones and metabolites are related in a causal manner to the corresponding differences in fleece production, the possibility exists that between-line differences in metabolite and hormone concentrations may also be influenced by season. The objective of the two experiments reported here was therefore to examine interactions between the effects of selection line and season on basal concentrations of urea, creatinine and the thyroid hormones, together with whol5body utilization of an essential amino acid (phenylalanine). In addition, intravenous challenges of urea, creatinine and thyrotropin-releasing hormone (TRH) were used to measure the effects of selection line and season on clearance of urea and creatinine from plasma, and on circulating concentrations of thyroxine, triiodothyronine and prolactin, respectively. Circulating concentrations of prolactin, and their response to intravenous thyrotropin-releasing hormone, were of interest because seasonal changes in circulating prolactin levels, which are high in summer and low in winter (Ortavant et al. 1985), have an associative relationship with seasonal changes in wool growth. Materials and Methods Experiment 1 Thirty-two Romney rams (born 1987), 16 selected at random from each of the Massey University fleeceweight-selected (FW) and control (C) lines, were used in the study. Details of the development of these lines have been provided by Antram et al. (1991). The rams were studied in three seasons-autumn (February), winter (June) and spring (September/October) of 1988-corresponding to three ages (5, 9 and 13 months). At each time the rams were housed in metabolism crates under natural lighting (provided by large windows at either end of the barn) which was used to maintain normal photoperiod. Rams were allowed a 10-day adjustment period before measurements commenced. Chaffed lucerne hay was fed at rates equivalent to 1 - 3 times maintenance. Maintenance requirement was calculated as 0 - 7 MJ ME and the feed was assumed to contain 9.5 MJ ME kg-' DM (Rattray 1986). On alternate days, 2 g of a mineral supplement (94% sodium chloride, 6% sodium molybdate) was fed with the chaffed lucerne hay to counteract possible copper toxicity. Fresh water was available ad libitum. Animals were fed, and refusals weighed once daily at 1600 hours. Rams were weighed at the end of the adjustment period, so that their feed allowances could be adjusted according to the new liveweights. Unilateral jugular cannulae were inserted on day 11 of the trial according to the procedure described by Bremmers et al. (1988). Patency of cannulae was maintained with sterile
Hormones and Metabolism of Selected Romney Rams
physiological saline containing 100 IU mL-' sodium heparin (New Zealand Pharmaceuticals Ltd, Palmerston North) and 0.4 ml L-' oxytetracycline (Pfizer Laboratories Ltd, Wiri, Manukau City). On day 13, rams were offered their daily ration in 12 equal parts at 2-h intervals commencing at 0600 hours. Blood samples (10 mL) were withdrawn via the cannulae every 2-h (immediately prior to feeding) commencing at 1200 hours and concluding at 2400 hours, in order to obtain basal plasma hormone and metabolite concentrations. On day 14, rams were given an intravenous injection of urea (120 mg kg-' liveweight) and creatinine (3 mg kg-' liveweight) over a period of 2 min, through the jugular cannulae in approximately 4 mL of saline. This was followed by 10 mL of saline to flush the cannula. Blood sampling commenced at 0900 hours with three samples being taken before the challenge (at -60, -40 and -20 min) and the challenge being administered at 1000 hours. Blood samples were then collected at 15, 30, 45, 60, 75, 90, 105, 120, 180, 240, 300, 360 and 420 rnin after the challenge. The irreversible loss of phenylalanine was measured in a subset of 14 rams, 7 each from the FW and C lines in winter and in spring. These rams had a second temporary catheter inserted, as described previously, into the contralateral jugular vein on day 15 of the trial. On day 18, starting at 0900 hours, each animal was infused for 6 h via one catheter with a solution of 3 . 7 ~ 1 0Bq ~ m ~ - ' of [2,6-3H]-phenylalanine,10 pmol L-' phenylalanine carrier and 100 IU m ~ - ' heparin in sterile physiological saline at a rate of 0.35 g min-'. After 5 and 6 h of infusion, blood samples (10 mL) were withdrawn via the contralateral catheter into heparinized syringes. Experiment 2 This experiment utilized 16 rams selected at random from the FW line and 16 from the C line, the group being born one year later than those used in Experiment 1 (i.e. in 1988). Rams were studied in the winter (June/July) and spring (October/November) of 1989 (corresponding to 9 and 14 months of age). Housing and feeding of the rams was similar to that in Experiment 1, except that the rams were fed lucerne chaff (at a rate equivalent to le2xmaintenance) daily at 1500 hours throughout the study and a 14 day, rather than a 10 day, adjustment period was used. Jugular cannulae were inserted as described previously on day 14. Blood sampling for determination of basal hormone and metabolite concentrations commenced at 0800 hours on day 15 and continued at hourly intervals for 24 h. On the following day, an intravenous challenge of thyrotropin releasing hormone (TRH, Hoffman-La Roche, Basel, Switzerland) was injected via the cannulae at a rate of 0.33 pg kg-' liveweight followed by 10 mL of physiological saline to flush the cannulae. The challenge was prepared just before its administration by diluting the TRH solution (provided as 0.1 mg m ~ - l )in sterile physiological saline. Blood samples were withdrawn at -30, -15, -5, 4, 8, 12, 16, 20, 30, 45, 60, 90, 120, 180, 240, 360 and 420 rnin relative to the time of challenge. In both experiments rams were grazed on mixed ryegrass/white clover pastures between experimental periods. The experiments were conducted at latitude 40.1's. Collection and Processing of Blood Blood samples (10 mL) were withdrawn via the cannulae and placed in centrifuge tubes containing 0.1 mL of 50% (w/v) sodium citrate as the anticoagulant. Plasma was separated by centrifugation (25009, 4OC, 20 min) and pipetted off into duplicate vials which were stored at -20°C for later analysis. Samples for the determination of concentration and specific radioactivity (SRA) of phenylalanine were withdrawn via a heparinized syringe and placed in weighed centrifuge tubes on ice. They were immediately precipitated with an equal weight of 10% 5-sulfosalicylic acid (SSA) containing 200 p~ nor-leucine. The supernatant was separated by centrifugation (25009, 4OC, 20 rnin), drawn off, filtered through a 0.45 p,m filter and stored at -20°C for later analysis. Chemical Analyses Plasma concentrations of urea and creatinine were measured using the autoanalyser methods of Marsh et al. (1965) and Chasson et al. (1961), respectively. Intra- and inter-assay
Y. X. Sun et al.
coefficients of variation (c.v.) were 2.1% and 3.4% for urea and 1.0% and 1.4% for creatinine. Triiodothyronine (T3) and thyroxine (T4) concentrations were measured using 'Coat-a-Count' solid-phase radioimmunoassay kits (Diagnostic Products Corporation, Los Angeles, CA) previously validated for ovine samples (Clark et al. 1989). Intra- and inter- assay C.V. were 5.4% and 7.9% for T3 and 3.6% and 6.2% for T4. Plasma prolactin (Prl) concentrations (Experiment 2 only) were determined using a standard double-antibody competitive binding radioimmunoassay. The assay was based on an NIH kit using rabbit anti-oPrl antiserum (NIADDK-anti-oPrl-1) at a final tube dilution of 1:500 000. Ovine prolactin was used for iodination (NIADDK-oPRL-1-2, AFP-7150B, 35 IU mg-l, NIADDK, NIH, Bethesda, MD, U.S.A.) and reference standards (NIADDK-oPRL, AFP-8277E, 30 IU mg-I). The assay has a minimum detectable prolactin concentration of 0.2 ng m ~ - land a half-displacement concentration of 14 ng m ~ - ' . Intra- and inter-assay C.V. were 9.7% and 16.6%, respectively. Basal samples for T3, T4 and prolactin analyses were pooled on an equal volume basis over the 12 or 24 h period prior to analysis. Based on prior knowledge of expected response patterns to TRH, no samples beyond 180 min post-challenge were analysed for prolactin, while the samples taken at 8, 12, 16, 30 and 60 min were not analysed for the thyroid hormones. SSA supernatants for phenylalanine and radioactivity measurements were passed through Dowex 50 WX8 ion-exchange resin (H+ form; 5 mL bed volume) and the amino acid fraction eluted with 4x5 mL of 4 M NH40H. The eluent was rotary evaporated, washed, taken to dryness, and dissolved in 0.2 M, pH 2.2 lithium citrate buffer. An aliquot was taken for analysis of physiological amino acids by automated ion exchange analysis (LKB 4150 Amino Acid Analyser) with nor-leucine as an internal standard for recovery calculations. The remainder of the eluent was used for the determination of radioactivity as 3~ after the addition of scintillant. It was assumed that all the 3~ activity was associated with phenylalanine, after preliminary recovery checks on eluent using preparative scale HPLC showed there was no detectable activity associated with other amino acids. Irreversible loss rate of phenylalanine was calculated assuming steady state conditions from the equation (Waterlow and Stephen 1968):
where Q = irreversible loss of phenylalanine from blood per unit time (nmol min-I); q = quantity of labelled phenylalanine infused per unit time (DPM min-I);
SP = plateau specific radioactivity of free phenylalanine in blood (DPM -01-I).
Statistical Analyses Because the experiments involved repeated sampling of animals in two dimensions (within and between seasons), basal urea and creatinine concentrations were analysed in two steps. In the first, multivariate analysis of variance was applied to data within a particular season to test the effects of selection line, sampling time (hourly or two-hourly) and their interaction. Since all linexsampling time interactions were non-significant (i.e. the magnitude of between-line differences was constant across sampling times), data were pooled to generate a mean concentration over the 12 h (Experiment 1) or 24 h (Experiment 2) period. The daily mean concentrations so generated were then subjected to multivariate analysis of variance (MANOVA) to test the effects of selection line, season and the selection linexseason interaction which was of fundamental interest in this study. Basal concentrations of T3, T4 and prolactin were analysed in the same manner used for daily mean urea and creatinine concentrations, since these samples had been pooled across sampling times prior to assay. Parameters relating to irreversible loss rates of phenylalanine were also subjected to MANOVA to test the effects of selection line, season and their interaction. Data arising from the urea and creatinine challenges in Experiment 1 were analysed as follows. First, the mean of the three pre-challenge (baseline) concentrations was subtracted from the concentration at each post-challenge sampling time. The baseline-corrected post-challenge
Hormones and Metabolism of Selected Romney Rams
data were then fitted to a single-pool exponential decay model (Bartle et al. 1988) of the form:
where Yt = concentration (urea or creatinine) at time t ,
Yo = concentration at t= 0 (by back - extrapolation),
k = fractional decay constant, e = base of natural logarithms. This model was fitted over the interval 15-240 min post-challenge for urea and 15-120 min for creatinine to eliminate post-challenge samples whose concentrations were below the pre-challenge mean baseline levels. Urea and creatinine spaces (as a percentage of liveweight) were calculated as the ratio of metabolite dose administered to the zero-time rise in concentration above baseline. Estimates of space and fractional decay constant were then subjected to multivariate analysis of variance to test the effects of line, season and their interaction. Responses to the TRH challenge (Experiment 2) were expressed in terms of the area under the response curve above the baseline concentration (calculated as the mean of the three pre-challenge sample concentrations). Areas under the curve (calculated by triangulation) were then subjected to multivariate analysis of variance to test the effects of selection line, season and their interaction. Analyses were performed using the statistical packages REG (Gilmour 1985) and SAS (SAS 1985).
Results
Basal Metabolite and Hormone Concentrations The effects of season on basal metabolite and hormone concentrations during the two experiments are shown in Table 1. In Experiment 1, C rams maintained higher concentrations of urea than FW rams, but the between-line difference was greater in winter than during autumn or spring. As a result, both the line effect (P < 0.01) and the linexseason interaction (P < 0.05) were significant. However, in Experiment 2, while the C rams still maintained higher circulating urea concentrations than FW rams (P < 0.05) the linexseason effect was nonsignificant. A similar situation was apparent with respect to plasma creatinine levels. In Experiment 1, differences between the lines were most apparent during the winter and the linexseason interaction was significant (P < 0.05), whereas in Experiment 2 the between-line difference in basal creatinine levels was similar in the winter and spring with the result that the linexseason interaction was non-significant. Effects of season on basal urea and creatinine levels were significant in both experiments, and primarily reflected the fact that circulating concentrations of these metabolites were lower in the winter than in the autumn or spring. Circulating levels of triiodothyronine and thyroxine were not influenced by selection line and the linexseason interaction was non-significant (Table 1). The effect of season on thyroid hormone levels was significant in Experiment 1, reflecting higher levels during winter and spring than during autumn, but was not significant in Experiment 2.
Table 1. Effects of season on basal plasma concentrations of metabolites and hormones in control (C) and fleeceweight-selected (FW) rams, Experiments 1 and 2 Values are means fs.e. based on 16 rams per group Metabolite or hormone
Expt
Line
Autumn
1
C FW C FW
0.061f 0.0016 0.061f 0.0013
Season Winter
Spring
L
~ffects~ S LxS
Urea ( m ~ )
Creatinine ( m ~ )
2 Triiodothyronine (pg dl--')
1 2
Thyroxine (pg d ~ - ' )
1
2 ~ r o l a c t i n(ng ~ mL-') A
2
-
-
C FW C FW
82-8f4.1 77.3f 4-4
C FW C FW
3.8%0.2 3.6rt0.2
C FW
-
-
-
-
0.061f 0.0008 0.056f 0.0014 0.061f 0.0004 0.057f 0.0004
0~061f0~0011 0.059f 0.0013 O.O64f 0.0005 0.059f 0.0006
n.s.
-k
*
**
*
n.s.
87.0f 4.8 89.5rt5.9 86.7f 5.6 87.8f12.8
91.lf4.7 85.3f4.7 73.5f 3.8 70.6f3-6
n.s.
**
ns.
n.s.
+
n.s.
4.4f 0.3 4.6%0.2 4.0f0.3 3.7f0.2
5.0410.3 4-5f0.2 3.7f0.2 3.6f0.2
n.s.
***
n.s.
n.s.
n.s.
ns.
13.1f3.7 24.6418.0
50.8f 10.6 48.2f 13.3
n.s.
***
n.s.
Significance of effects. L, Line. S, Season. LxS, LinexSeason interaction. n.s. P > 0.10, Not measured in experiment 1.
+ P < 0-10, * P < 0.05, ** P < 0 - 01, *** P < 0.001.
Hormones and Metabolism of Selected Romney Rams
Basal prolactin concentrations were higher in FW than in C rams during winter ( P < 0.10 by univaxiate analysis of winter data), but were not different between the lines in spring. Over both seasons, neither the line effect nor the linexseason interaction was significant, but circulating prolactin levels were considerably higher in spring than in winter ( P < 0.001).
Urea/Creatinine Space and Clearance Table 2 shows the effects of line and season on urea and creatinine spaces (as a percentage of liveweight) and fractional decay constants in Experiment 1. Neither the estimated spaces nor the fractional decay constants for urea and creatinine were significantly influenced by selection line, and the linexseason interaction was non-significant in all cases. However, the effect of selection line on urea decay constant was significant ( P < 0.05) in the winter when tested by univariate analysis of variance. Urea space, but not creatinine space, was influenced by season (P < 0.001), being higher in spring than in autumn or winter.
!Table 2. Effects of season on urea and creatinine spaces and fractional decay constants in control (C) and fleeceweight-selected (FW) rams, Experiment 1 Values are expressed as means f s.e. based on 16 rams per group Parameter Urea space (% liveweight)
Line C FW
Autumn
Season Winter
53.7f1.7 57. lf 1 . 7
50.5% 1 - 4 54.7rtl.4
Spring
L
63.3f2.8 64.562.8
n.s.
Effect S LxS
***
n.s.
Urea decay constant C 0 - OO43f 0.0005 O.OO35fO -0002 0 .OO42fO. 0007 n.s. n.s. n.s. FW 0.0044+0. 0005 0.0042f 0 0002 0 .0056f 0.0007 (rnin- )
'
Creatinine space (% liveweight)
C FW
Creatinine decay constant (min-I)
C 0.0137f0.0005 0.0140f 0.0007 0.0144&0.0006 n.s. n.s. n.s. FW 0.0132&0.0005 0.0142&0.0007 0.0144f0.0005
A
32.4fO. 8 33.2rt0.8
32.7f1.2 30.4rtl-3
32.3k0.9 32.6f0.9
n.s. n.s. n.s.
Significance of effects. L, Line. S, Season. LxS, LinexSeason interaction. n s . P
*** P < 0.001.
> 0.10,
Whole Body Irreversible Loss of Phenylalanine Table 3 shows the effect of season (winter versus spring only) on the irreversible loss rate (ILR) of [3H]-phenylalanine in a subgroup of rams from Experiment 1. There was no significant line effect on ILR of [3H]-phenylalanine, but the seasonal effect was significant ( P < 0.01). However, this seasonal effect was the result of a significant gain in body weight (P < 0.001) from the winter to the spring sampling period. When the ILR were corrected for metabolic body weight the seasonal effect was removed, and there was a significantly greater ILR (g day-l) in C rams than in the FW rams ( P < 0.05). There was no significant line x season interaction.
Y. X. Sun et al.
Table 3. Effects of season on whole body irreversibleloss rate (ILR)of L- [2,6-'HI phenylalanine in a subgroup of control (C) and fleeceweight-selected (FW) rams, Experiment 1 Values are means 2Z s.e. based on 7 rams per group Parameter
Line
Season Winter
Spring
L
~ffect* S LxS
Body weight (kg)
C FW
33.4f 2 . 2 37.52Z1.3
41.12~2-9 46.0f 0.9
*
***
n.s.
Phenylalanine ILR (d day-')
C FW
7.77zt0.65 7.082Z0.49
9.78zt0.76 8.70f0.65
n.s.
**
n.s.
Phenylalanine ILR (g dayLy-')
C FW
0.57f0.05 0-47f0.04
0.60f0.03 O.492Z0.04
*
n.s.
ns.
A
Significance of effects. L, Line. S, Season. LxS, LinexSeason interaction. n.s. P
* P < 0-05, ** P < 0.01, *** P < 0.001.
-60
0
60
> 0.10,
1 2 0 180 2 4 0 3 0 0 3 6 0 4 2 0
Time relative to challenge (rnin)
--
-60
0
60
120 180 240 3 0 0 360 4 2 0
Time relative to challenge (rnin)
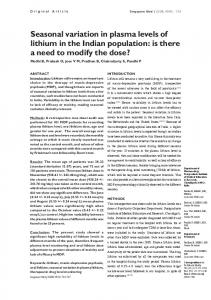
Fig. 1. Plasma concentrations of triiodothyronine (T3) in response to an intravenous TRH and FW (0)rams challenge (0.33 pg kgd1 liveweight administered at time zero) in C (0) during winter ( a ) and spring ( b ) . Vertical bars represent pooled standard errors at each time.
Hormones and Metabolism of Selected Romney Rams
Trtble 4. Effects of season on triiodothyronine, thyroxine and prolactin responses (area above baseline) to an intravenous challenge of thyrotropin releasing hormone (0.33 pg kg-') in control (C) and fleeceweight-selected (FW) rams, Experiment 2 Values are expressed as means f s.e. based on 16 rams per group Response area
Line
Season Winter
Spring
L
~ffect* S LxS
Triiodothyronine (pg min d ~ - ' )
C FW
14 725f 1388 l498lkl37l
15 519f 2 491 15 83851 203
ns.
n.s.
n.s.
Thyroxine (pg min d ~ - ' )
C FW
446.8%39.2 471.3k38.8
425.5k51.9 505 Ok28.3
n.s.
n.s.
n.s.
Prolactin (ng min m ~ - ' )
C FW
15 995k2 452 15 864&2120
18917f 4 101 5 571f2 038
*
n.s.
*
A
Significance of effects. L, Line. S, Season. LxS, LinexSeason interaction. n.s. P
* P < 0.5.
> 0 - 10,
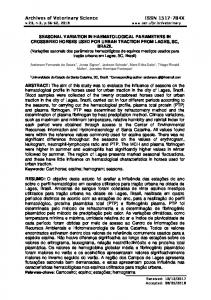
Response to T R H Challenge Plasma concentrations of triiodothyronine following the intravenous administration of 0 . 3 3 pg kgM1 TRH in Experiment 2 are shown in Fig. 1. Administration of TRH was followed by a marked increase in plasma T3 levels which peaked at approximately 2 h after challenge and then returned towards baseline levels. C rams exhibited marginally higher T3 levels than FW rams throughout the challenge, but this difference reflected the small difference in basal levels which existed prior to the administration of TRH. As a result, the T3 response to TRH, as measured by the area under the response curve above basal levels, was not influenced by line or season (Table 4). Plasma thyroxine levels also increased substantially in response to the TRH challenge but, in contrast to the T3 levels, showed little evidence of a return to baseline within the 420 min post-challenge sampling interval (Fig. 2). There was no difference between the lines in circulating T4 levels following the challenge and the response areas for T4 were not influenced by selection line or season (Table 4). Prolactin responses to the TRH challenge are shown in Fig. 3. During the winter period, C and FW rams maintained very similar circulating levels of prolactin both before and after the TRH challenge, although administration of exogenous TRH increased circulating prolactin levels by up to five times. During the spring, the pre-challenge prolactin levels were substantially lower in C than in FW rams, but the post-challenge levels of prolactin in plasma were similar in the two lines. As a result the response area to TRH above pre-challenge levels was much lower in FW than in C rams. As is shown in Table 3, both the line effect and the hexseason interaction were significant (P < 0.05) for the prolactin response to exogenous TRH. Discussion The principal objective of this study was to determine whether the magnitude of differences between the C and FW lines in circulating concentrations of urea, creatinine and the thyroid hormones is influenced by season. In this study, as in most others of its type, the effect of season was confounded with age of the
Y.X. Sun et al.
-60
0
60 1 2 0 !80 240 300 360 420
'Time relative to challenge (rnin)
Time relative to challenge (rnin)
Fig. 2. Plasma concentrations of thyroxine (T4) in response to an intravenous TRH challenge and FW ( 0 ) rams during (0.33 pg kg-' liveweight administered at time zero) in C (0) winter (a) and spring (b). Vertical bars represent pooled standard errors at each time.
animal. However, the use of young growing animals in these studies is justified by our interest in developing genetic markers for wool production (see Introduction) which are of greatest use in young animals. In Experiment 1, the ram hoggets were studied in autumn (February), winter (June) and spring (September/October), times of the year which correspond to differences in clean wool growth rates between the C and FW lines of 18%, 45%, and 36%, respectively (McClelland et al. 1987). Experiment 2 extended these observations by examining a group of animals from the same lines (born a year apart) in winter and spring, and by measuring the effects of an intravenous thyrotropin-releasing hormone challenge on circulating concentrations of prolactin and the thyroid hormones. With respect to the thyroid hormones, no differences were observed between the C and FW rams in circulating concentrations of triiodothyronine or thyroxine in either experiment. Basal concentrations of T3 and T4 tended to be lower in FW than in C rams during autumn and spring, while the reverse was true during the winter. However, these differences were consistently small and non-significant. Intravenous administration of TRH substantially elevated circulating concentrations of T3 and T4, but differences between the lines, where
Hormones and Metabolism of Selected Romney Rams
Time relarive to challenge (min)
Time relative to challenge (min) Fig. 3.
Plasma concentrations of prolactin in response to an intravenous TRH challenge (0.33 pg kg-' liveweight administered at time zero) in C (0) and FW (0) rams during winter ( a ) and spring (b). Vertical bars represent pooled standard errors at each time.
they occurred, were small and reflected differences which had existed prior to administration of the TRH. Thus while low plasma concentrations of thyroxine have been reported previously in sheep of high genetic merit for fleeceweight (Hough et al. 1988; Clark et al. 1989), such differences were not apparent in this study. Our results, both in terms of basal thyroid hormone levels and in thyroid hormone responses to TRH, are therefore consistent with the results of Williams et al. (1990), who found no effect of genetic merit for fleeceweight on basal thyroid hormone concentrations or responses to exogenous thyroid stimulating hormone. The situation is less clear with respect to plasma concentrations of urea and creatinine. In both experiments, FW rams maintained lower circulating concentrations of these metabolites than C rams, and this effect was consistent throughout the day, as indicated by the non-significant h e x sampling time interactions (within season). In Experiment 1, there was a marked effect of season on line differences in daily mean concentrations of urea and creatinine, differences between the C and FW rams being greater during winter than during autumn or spring. However, in Experiment 2, there was no significant linexseason interaction with respect to daily mean concentrations of either urea or creatinine.
Y . X. Sun et al.
This cannot be attributed to the fact that rams were studied in only two seasons in Experiment 2, as opposed to the three seasons examined in Experiment 1. In Experiment 1, differences between the lines in urea and creatinine concentrations were greater in winter than in spring, whereas the reverse was true in Experiment 2. Thus while the present study confirms earlier observations that FW rams have lower circulating concentrations of urea and creatinine than C rams (McCutcheon et al. 1987; Clark et al. 1989; Thomson et al. 1990; Sun et al. 1991), the magnitude of this between-line difference does not appear to be consistently influenced by season. Measurement of plateau specific radioactivity of 3H-phenylalanine was based on the assumption that all radioactive label in the amino acid fraction was associated with phenylalanine. Label associated with tyrosine, in 2-3 HPLC fractions, was below the limits of detection of the counting system used, but could have accounted for 5-7% of the total counts. Thus measurements of irreversible loss rate (ILR) could have been overestimated to this extent. The ILR of an amino acid is the sum of the whole body utilization of the amino acid for protein synthesis in combination with amino acid oxidation to urea and intermediates of the citric acid cycle. The present study measured ILR without separate measurement of oxidation, and so the differences in ILR found between the lines cannot be attributed to one or other component. Because