Ann. Limnol. - Int. J. Lim. 2008, 44 (3), 189 - 196
Seasonal variation of phytoplankton and cyanobacteria composition and associated microcystins in six Portuguese freshwater reservoirs E. Valério1,2*, N. Faria2, S. Paulino2, P. Pereira2 Centro de Química e Bioquímica, Faculdade de Ciências, Universidade de Lisboa, Campo Grande, 1749-016 Lisboa, Portugal. Laboratório de Microbiologia e Ecotoxicologia, Instituto Nacional de Saúde Dr. Ricardo Jorge, Av. Padre Cruz, 1649-016 Lisboa, Portugal 1 2
Toxic cyanobacteria are common in Portuguese freshwaters and are a cause of concern, given that exposure to subacute levels of cyanobacterial toxins through drinking and recreational water might have deleterious effects on human health. Since 1996 several laboratories have been involved in the screening of cyanotoxins in different freshwater bodies, some on a regularly basis but most on a sporadically basis. Here we present data on the phytoplankton communities and on microcystins production occurring in six freshwater reservoirs located in a dry region of south Portugal, from May to December 2005 and April to July 2006. Most of the reservoirs experienced cyanobacterial blooms of various intensities, following noticeable shifts in phytoplankton composition towards cyanobacterial dominance. The seasonal dominance of cyanobacteria during warmer periods was not a fixed pattern since considerable amounts of cyanobacteria were also recorded during winter months in some reservoirs. Microcystins were detected in 23% of the 53 samples tested and some of them had concentrations higher than the WHO guideline of 1µg L-1 of microcystins, but their amounts not always reflected the encountered cyanobacteria biomass. Although Microcystis aeruginosa seems to be the major species responsible for microcystins production, other potentially toxigenic bloom-forming species were also found. These results reflect the irregular and unpredictable nature of cyanobacterial blooms in what respects to their occurrence, their composition, their intensity and persistency, as well as to their overall toxicity, strengthening the need of a systematic survey of freshwater resources for the correct risk assessment of cyanobacteria and associated toxins in natural environments. Keywords: Cyanobacteria, ELISA, microcystins, monitoring, phytoplankton
Introduction Interactions among phytoplankton organisms in freshwater ecosystems have been detected through changes in the relative abundance of microalgae populations within the phytoplankton communities. In temperate regions, seasonal successions of organisms belonging to different phytoplankton taxa are often observed. Whereas at the beginning of the summer a great variety of microalgae and cyanobacteria usually co-exist in the same water body, towards the end of summer this diversity may drop drastically as the result of the mass development of the cyanobacterial communities. Cyanobacterial blooms might be harmful to humans due to the ability of several bloom-forming species to * Corresponding author: E-mail:
[email protected]
synthesize highly toxic secondary metabolites, called cyanotoxins (Dittmann & Wiegand 2006). The occurrence of toxic mass populations appears to have a global distribution (Codd et al. 2005, Sivonen & Jones 1999). The hepatotoxic microcystins (MCYST) are known to be most commonly found and widespread cyanotoxins, being associated to several bloom-forming cyanobacteria including Microcystis, Anabaena, Anabaenopsis, Planktothrix, Nostoc, Hapalosiphon, Snowella, Woronichinia, and Oscillatoria (Codd et al. 2005, Falconer 2005). Given their high toxicity, the World Health Organization has placed MCYST on the list of potential health hazards, and has defined a drinking water guideline value of 1µg L-1 (WHO 1998). Most of the MCYST-producing bloom forming cyanobacteria preferentially occurs in steady and well stratified water bodies that provide optimal conditions for their vertical migration. Species like Microcystis aeruginosa and Anabaena spp. contain intracellular
Article available at http://www.limnology-journal.org or http://dx.doi.org/10.1051/limn:2008003
190
(2)
E. VALÉRIO, N. FARIA, S. PAULINO, P. PEREIRA
gas vesicles and become buoyant, accumulating on the water surface where they can be blown by the wind, forming highly dense stable scums, easily detected by a simple observation of the water reservoir from above (Dittmann & Wiegand 2006). In contrast other species like Planktothrix spp. and Oscillatoria spp. are more sensitive to high light conditions and usually tend to accumulate at deeper water layers or disperse homogeneously in the water column (Dittmann & Wiegand 2006). Sub-superficial blooms are often imperceptible by simple visual site inspections and may require deep water sampling for detection. Situation assessment after water sampling usually relies on the identification and quantification of cyanobacteria by microscopic observation, followed by MCYST quantification of cyanobacteria containing samples.
affected by cyanobacterial blooms. Depth-integrated raw water samples made up of 3 individual sub-samples taken from the surface to 1 and 3 times the Secchidisk depth, were collected either near the water intake tower or in the most affected areas of the water body. The samples were transported to the laboratory on ice chest and immediately processed for phytoplankton determinations and microcystin analyses.
Roxo
Enxo é
So far, the occurrence of MCYST in Portuguese freshwater resources has been mostly associated to blooms of M. aeruginosa (Vasconcelos 1993, Vasconcelos et al. 1993, 1994, Moreno et al. 2003), although other potentially toxigenic species also occur (Vasconcelos 1993, 1994, Vasconcelos et al. 1996, Moreno et al. 2003). In this study, we followed the phytoplankton community and the associated MCYST production in six Portuguese freshwater reservoirs over two consecutive time periods. By this we intended to assess the phytoplankton dynamics in each reservoir and to evaluate the changes in MCYST concentrations and persistence related to the variations in cyanobacterial assemblages and biomasses found through the sampling period.
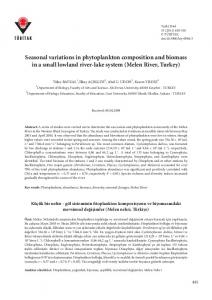
Methods Study sites and water sampling Water samples (1 L) were collected from six freshwater reservoirs located at a dry, flat and arid region of south Portugal at Alentejo region (Figure 1): Alqueva, Alvito, Enxoé, Odivelas and Roxo from May to December 2005 and April to July 2006 and in Monte Novo reservoir it was only possible to perform samplings in 2005, as resumed in Table 1. All of these waterbodies are used for water consumption or for agriculture (INAG, http://cnpgb.inag.pt). Site inspections, including the observation of water coloration and water currents and the assessment of weather conditions such as nebulosity and wind direction and velocity, were taken before collecting the samples, in order to assess the areas most likely to be
Monte Novo
Fig. 1. Location of the six sampling sites in the Portugal map.
(3)
PHYTOPLANKTON AND CYANOBACTERIA IN FRESHWATER RESERVOIRS
191
Table 1. List of raw water samples collected, including the sampling date and dominant cyanobacteria detected. Sample
Sampling date Dominant Cyanobacteria
Sample
Sampling date Dominant Cyanobacteria
Alqueva c1
18-05-2005
ND*
Enxoé s10
24-07-2006
Aphanizomenon gracile
Alqueva c2
21-07-2005
Anabaena circinalis
Monte Novo c1 18-05-2005
Microcystis aeruginosa
Alqueva c3
10-08-2005
Anabaena circinalis
Monte Novo c2 21-07-2005
Anabaena circinalis
Alqueva c4
29-09-2005
Microcystis incerta
Monte Novo c3 10-08-2005
Aphanizomenon flos-aquae
Alqueva c
26-10-2005
Microcystis incerta
Monte Novo c4 29-09-2005
Microcystis incerta
Alqueva c6
18-12-2005
Gomphosphaeria sp.
Monte Novo c5 26-10-2005
Aphanizomenon flos-aquae
Alqueva c7
03-04-2006
Microcystis aeruginosa
Monte Novo c6 18-12-2005
Aphanizomenon gracile
Alqueva c8
08-05-2006
Microcystis aeruginosa
Odivelas c1
10-08-2005
Aphanizomenon flos-aquae/
Alqueva c9
05-06-2006
Merismopedia sp.
Alqueva c10
24-07-2006
Gomphosphaeria sp.
Odivelas c2
29-09-2005
Microcystis aeruginosa
Alvito s1
21-07-2005
Anabaena circinalis
Odivelas c3
26-10-2005
Aphanizomenon gracile
Alvito s2
10-08-2005
Anabaena circinalis
Odivelas c4
18-12-2005
Aphanizomenon flos-aquae
Alvito s3
29-09-2005
Aphanizomenon flos-aquae
Odivelas c5
03-04-2006
Microcystis aeruginosa
Alvito s4
26-10-2005
Aphanizomenon flos-aquae
Odivelas c6
08-05-2006
Microcystis wesenbergii
Alvito s5
18-12-2005
Gomphosphaeria sp.
Odivelas c7
05-06-2006
Anabaena circinalis
Alvito s6
03-04-2006
Microcystis aeruginosa
Odivelas c8
24-07-2006
Alvito s7
08-05-2006
Microcystis aeruginosa
Aphanizomenon flos-aquae/ Microcystis aeruginosa
Alvito s8
05-06-2006
Microcystis aeruginosa
Roxo c1
18-05-2005
NOSTOCALES n.i.
Alvito s9
24-07-2006
Aphanizomenon flos-aquae
Roxo c2
21-07-2005
Anabaenopsis sp.
Enxoé s1
18-05-2005
Planktothrix sp.
Roxo c3
10-08-2005
Microcystis incerta
Enxoé s2
21-07-2005
Aphanizomenon flos-aquae
Roxo c4
29-09-2005
Planktothrix sp.
Enxoé s3
10-08-2005
Planktothrix sp.
Roxo c5
26-10-2005
Phormidium sp.
Enxoé s4
29-09-2005
Planktothrix sp.
Roxo c6
18-12-2005
Planktothrix sp.
Enxoé s5
26-10-2005
Planktothrix sp. / Cylindrospermopsis raciborskii
Roxo c7
03-04-2006
Planktothrix sp.
Roxo c8
08-05-2006
Enxoé s6
18-12-2005
Planktothrix sp.
Planktothrix sp./ Gomphosphaeria sp.
Enxoé s7
03-04-2006
Planktothrix sp.
Roxo c9
05-06-2006
Aphanizomenon flos-aquae
Enxoé s8
08-05-2006
Planktothrix sp.
Roxo c10
24-07-2006
Planktothrix sp.
Enxoé s9
05-06-2006
Planktothrix sp.
‡
Phytoplankton determinations Sample aliquots (100 mL) were preserved in Lugol’s iodine solution and observed under an inverted microscope (Olympus CK40) using 5 to 25 mL Utermöhl
Aphanizomenon issatchenkoi
‡ c: composite sample; † s: surface sample; * ND: not detected.
chambers for phytoplankton identification and cell counting (Hasle 1978). The taxonomic identification was based on microscopic observation of distinctive morphological features. Characteristics like the type and form of the colonies, the form and dimensions of
192
E. VALÉRIO, N. FARIA, S. PAULINO, P. PEREIRA
the vegetative cells, the morphology of heterocysts and akinets when present, as well as their relative position within the filament were used for cyanobacterial identification (Baker 1991, Baker 1992, Bourrelly 1970, Komárek & Anagnostidis 1986). Sample pre-processing for ELISA detection and quantification of microcystins Water samples aliquots for ELISA detection and quantification of microcystins were preserved at -20 ± 2 ºC. Previous to ELISA processing, the samples were defrost at room temperature and sonicated for 2 min (10 s sonication / 2 s rest cycle), using a Sonics Vibracell V505 probe. The samples were them filtered through 0.45 µm non-sterile Millipore Millex-HV (PVDF) syringe driven filter units. Competitive ELISA was performed for microcystins analysis using a commercially available plate kit for detection of microcystins in water (EnviroGard® Microcystins Plate Test Kit, Strategic Diagnostics Inc., Newark, USA). This toxicity test enables determination of microcystins over the range 0.1-1.6 µg L-1 of microcystin-LR and its equivalents.
Results Phytoplankton composition The data concerning the phytoplankton communities and MCYST concentrations found in each reservoir during the monitoring period are shown in Figure 2. Cyanobacteria were identified throughout the sampling period and detected in 52 of the 53 samples analyzed. During most all season’s cyanobacteria were the most abundant among phytoplankton, namely in September 2005 in four of the six reservoirs and May 2006 in four of the five reservoirs sampled, when their cell counts grew markedly (Figure 2). In Alqueva, a noticeable shift in phytoplankton composition towards cyanobacterial dominance was observed from July until October 2005. After being replaced by Chlorophytes and Criptophytes during the Spring of 2006, Cyanobacteria reappeared as a dominant component of the phytoplankton community by July 2006. The cyanobacteria biomass ranged between zero (May 2005) and a maximum value of 140,232 cells mL-1, in September 2005. M. aeruginosa and Anabaena circinalis were the predominant bloom-forming species, accounting for 11-100% and 3-58% of the total cyanobacteria biomass, respectively. But despite the high cell densities reached by these two potentially toxigenic
(4)
species, no MCYST were detected throughout the sampling period. A different situation was observed in the Alvito reservoir, where MCYST were detected in three of the nine samples analyzed, two of them above 1 µg L-1, with a maximum of 2.58 µg L-1 presenting high amounts of cyanobacteria. The cyanobacteria biomass ranged between 2,120 cells mL-1 (April 2006) and a maximum value of 13,677,222 cells mL-1, in September 2005. Although different bloom-forming species were found, MCYST concentrations reflected only the amounts of M. aeruginosa and not the encountered total cyanobacteria biomass. In fact, A. circinalis dominated the cyanobacterial community from July to August 2005, being replaced as a dominant species by Aphanizomenon flos-aquae which formed an extremely dense bloom in September. During this period, the relative contribution of M. aeruginosa to the overall cyanobacterial community never exceeded 4% of the total cell counts and MCYST concentrations where always bellow 1.10 µg L-1. In October, however, a rise in MCYST concentration was associated to a shift in the bloom composition towards M. aeruginosa predominance. Although cyanobacteria appeared in much lower cell densities, MCYST concentration reached a maximum of 2.58 µg L-1 during that period. In 2006, despite the presence of potentially toxic Microcystis spp. species, no MCYST were detected throughout the sampling period. In Enxoé two peaks of phytoplankton proliferation were detected throughout the sampling period. The first one occurred in September 2005, following a steady increase in cyanobacterial biomass throughout the summer period. The second peak occurred in May 2006 when a sudden and extremely dense proliferation of cyanobacteria was detected after a short period of lower cell density observed during the winter. Both blooms were dominated by Planktothrix spp. species. However MCYST production was only detected during the second bloom. The cyanobacteria biomass ranged between 9,653 cells mL-1 (June 2006) and a maximum value of 1,570,991 cells mL-1, in May 2006. In two of the eight samples analyzed, MCYST were detected, but always below the 1 µg L-1 limit, being the maximum of 0.63 µg L-1. Interestingly, no cyanobacteria were found in June 2006, just one month after the major peak of toxic cyanobacteria was detected, and the subsequent reappearance of Planktothrix spp. in July 2006 was no longer associated with MCYST production, like the bloom detected one year before. In fact, the amounts of MCYST were not related with Planktothrix spp. cell densities, even during the toxic bloom detected in 2006, when no other potentially toxic species were found. In all the samples collected in Monte Novo reservoir no
(5)
PHYTOPLANKTON AND CYANOBACTERIA IN FRESHWATER RESERVOIRS
Fig. 2. Phytoplankton cell counts and microcystins content in the six reservoirs sampled.
193
194
E. VALÉRIO, N. FARIA, S. PAULINO, P. PEREIRA
MCYST have been detected. The cyanobacteria biomass ranged between 107 cells mL-1 (December 2005) and a maximum value of 2,415,730 cells mL-1, in May 2005. This reservoir had no particular species domination and a very dynamic species succession was observed. However Microcystis spp. contributed to 99% (in May) and 53% (in September) of total cyanobacteria biomass. Other species, important to the total biomass amount was Anabaena circinalis, contributing 72% (in July) and 12% (in August) of total cyanobacteria biomass. Also in this case, despite of the presence of potentially toxic Microcystis spp. or A. circinalis in high counts in some months, no MCYST were detected. The situation in Odivelas reservoir was somewhat similar to the one found at Enxoé in that two peaks of cyanobacterial proliferation were also detected. However, the cyanobacterial community in Odivelas was composed by different species occurring either simultaneously or in successive dominance throughout the sampling period. The cyanobacteria biomass ranged between 889 cells mL-1 (July 2006) and a maximum value of 261,134 cells mL-1, in September 2005. In the first sample collected in August 2005, three different species of Aphanizomenon spp. were the most abundant, contributing for approximately 40% of the total cyanobacteria community. Other species, such as Anabaena spp. and M. aeruginosa were also detected, but in much lower amounts (12% and 14% of the total cyanobacteria cell density, respectively). One month latter, however, a significant shift in the bloom composition towards M. aeruginosa dominance was observed as a consequence of a sudden increase in M. aeruginosa cell density. Thus, the 6,500 cell mL-1 of M. aeruginosa detected in August rapidly grew to more than 131,000 cell mL-1 in September, which corresponded to approximately 50%, of the total cyanobacterial cells. The levels of MCYST found in the Odivelas reservoir reflected those of M. aeruginosa in the water, reaching a maximum of 0.5 µg L-1 in September 2005. However, the period of M. aeruginosa dominance was brief and in October the Aphanizomenon spp. species reappeared as the major cyanobacterial component following a sudden decrease in M. aeruginosa amounts to less than 1,300 cells mL-1. During the winter period cyanobacteria and associated MCYST were no longer detected in the water. In the following spring, cyanobacteria re-emerged as a predominant component of the phytoplankton community, but none of the species found in the previous year were detected in significant amounts in 2006. In fact, the bloom detected from April until May 2006 was mainly composed by Microcystis wesenbergii and no MCYST were found associated to this species during that period. In the Roxo reservoir,
(6)
high densities of cyanobacteria were detected from July until December 2005. The cyanobacteria biomass ranged between 807 cells mL-1 (June 2006) and a maximum value of 177,017 cells mL-1, in August 2005. Two cyanobacterial species dominated the phytoplankton community in successive dominance: Microcystis incerta was the predominant species from July until August, (accounting for 60% of the total cyanobacterial cells, approximately) being replaced by Planktothrix sp. which dominated the bloom community from September until December, reaching 100% of the total cyanobacterial biomass, during this period. In two of the nine samples analyzed, MCYST were detected, one of them above the 1 µg L-1 limit, reaching a maximum of 7.2 µg L-1. MCYST were only detected in high amounts during the onset of the Planktothrix sp. bloom (September 2005). In the following months, no MCYST were found regardless the high levels of Planktothrix sp. detected until December. No blooms were detected during the spring of 2006 but cyanobacteria re-emerged again as a dominant component of the phytoplankton community in July 2006, when Planktothrix sp. was detected in 15,500 cells mL-1 amounts.
Discussion The first thing that came to our attention when we started this study was the simultaneous onset of different cyanobacterial blooms in all the reservoirs included in this study during the months of August and September of 2005. These reservoirs are supplied with water coming from different river basins having no communications with each other at any point of their river courses. This prevents the flowing of water and contaminating cyanobacteria from one water body to another. Thus, the coincident development of cyanobacteria blooms in all the reservoirs during the mid-toend-summer of 2005 cannot be based on a spreading of cyanobacteria from a common origin. It is important to note that all the six reservoirs included in this study are located in the same dry, flat and arid region of the Iberian peninsula, sharing the same climate and geology, and being subjected to similar anthropogenic pressures resulting from similar land uses by the surrounding human populations (mainly farming). In 2004/2005, this entire region suffered a long period of severe drought and the effective water storage in each of the different water bodies was less than 40% of their full capacity (http://www.inag.pt). These common environmental pressures, namely, temperature and nutrients availability, may alone not be sufficient to explain
(7)
PHYTOPLANKTON AND CYANOBACTERIA IN FRESHWATER RESERVOIRS
the observed “synchronicity” in bloom development among the different water reservoirs. However, in the summer of 2005, a heat wave of dry and extremely hot weather reached this region and this phenomenon might have favored the simultaneous phytoplanktonic proliferations and cyanobacterial blooms in all the six freshwater reservoirs sampled in this study. In 2006, no such heat wave was recorded and the development of cyanobacteria occurred at different times in the different reservoirs. Throughout the monitoring period, some of the blooms detected were rather monospecific while others were composed by a variety of species co-occurring in the same reservoir either simultaneously or successively in time. The duration and intensity of those blooms also varied both between and within reservoirs and though cyanobacteria occurrence seems to follow a seasonal pattern in most of the reservoirs, the onset of the cyanobacterial blooms in each reservoir and their dynamics through time varied significantly from one year to the other. In general, cyanobacterial blooms were composed of several colonial and filamentous genera (Microcystis, Gomphosphaeria, Merismopedia, Anabaena, Anabaenopsis, Aphanizomenon, Planktothrix and Cylindrospermopsis) occurring in different proportions. Microcystis spp. prevailed in 30.1% of the samples analyzed (in 16 out of 53), however it did not always contributed to the total cyanobacterial counts. The most widespread species was M. aeruginosa, whereas M. incerta and M. wesenbergii were subdominant or dominated only in a few of the sampled reservoirs. Another colonial species, Gomphosphaeria sp. was common as well, however, its abundance was generally low. Filamentous cyanobacteria prevailed more frequently than Microcystis. Among those species, A. circinalis prevailed in 11.3% of the samples analyzed (6 out of 53), Aphanizomenon spp. in 22.6% (12 out of 53) and Planktothrix prevailed in 24.5% of the samples (13 out of 53). Three species of Aphanizomenon were identified: Aph. flos-aquae, Aph. gracile and Aph. issatschenkoi. Cylindrospermpsis raciborskii only occurred sparsely. The occurrence of cyanobacteria seems to follow a seasonal pattern in most of the reservoirs, with major peaks of bloom forming species being detected during summer periods and lower cell densities being observed during colder periods. Although this might be the general trend, the different reservoirs included in this study also showed different situations in terms of bloom-forming populations, dynamics and intensities. Thus, whereas in Enxoé, the cyanobacteria Planktothrix
195
sp. was detected in extremely high cell densities and remained as the dominant component of the phytoplankton community throughout most of the sampling period, in Odivelas, the cyanobacterial community was composed by different species occurring either simultaneously or in successive dominance throughout that time period. In Alqueva, the major cyanobacterial proliferation detected in September lasted only for a short period, reaching much lower cell densities. In Roxo, though, the rise in cyanobacterial cell density detected in August 2005 lasted until December showing that the development of cyanobacteria blooms is not restricted to the warmer seasons and might extend for long periods in the water. In Alvito, Enxoé and Monte Novo the maximum of the total cyanobacterial density detected in the water samples was extremely high when compared to the ones obtained for the three other reservoirs and even with previous monitoring studies (Vasconcelos 2001). These results point out to the unpredictable nature of cyanobacterial blooms. Although the underlying factors that trigger these phenomena are still poorly understood, this erratic behavior of blooms, in respect to their occurrence, composition, intensity and persistency, demands careful attention in assessing risks for human health. In fact all the reservoirs included in this study showed very rapid changes in cyanobacteria densities through time, and marked differences in toxicity were observed among and within the different blooms detected. Of the 53 environmental samples tested 12 tested positive for microcystins (22.6%) and four also exceeded the drinking water guideline value of 1 µg L-1, being the maximum value detected of 7.2 µg L-1. A wide range of MCYST concentrations also have been previously encountered in many Portuguese rivers, natural lakes and reservoirs detected using ELISA kits (Ueno et al. 1996, Vasconcelos 2001). The total microcystins concentration in the raw water samples here analyzed are similar to the ones detected in 1998 (Vasconcelos 2001). The levels of MCYST found in Alvito and Odivelas reflected those of M. aeruginosa, suggesting that this species was the major responsible for toxin production in these reservoirs. In Alqueva, however, no MCYST were detected despite the presence of this bloom-forming species. In Roxo MCYST were only detected in high amounts during the onset of the Planktothrix sp. bloom detected in September 2005. However, in the following months no MCYST were found, despite the prevalence of high levels of Planktothrix sp. detected
196
E. VALÉRIO, N. FARIA, S. PAULINO, P. PEREIRA
until December. In Enxoé, MCYST production was only detected in one of the two Planktothrix blooms detected during the sampling period and even during that toxic bloom, MCYST contents did not correlated with Planktothrix amounts. These results show that the incidence of MCYST in the water can not always be related to cyanobacteria biomass or even to the predominance of a specific species within the cyanobacteria bloom community. In the present study we showed evidences on the complexity of natural bloom communities, which can develop in a rather sudden and unpredictable way and may be formed by a consortium of cyanobacteria producing different amounts of toxins at different rates. These features highlight the importance of implementing regular monitoring programs for cyanobacteria and cyanotoxins in freshwater environments, in order to minimize potential health risks to animal and human population resulting from exposure through drinking and recreational activities, namely in this deficient of available water region. Acknowledgements Elisabete Valério thanks the financial support (Grant SFRH/BD/ 8272/2002) by Fundação para a Ciência e a Tecnologia. References Baker P. 1991. – Identification of Common Noxious Cyanobacteria. Part I – Nostocales. Urban Water Research Association of Autralia. Research Report nº 29. Baker P. 1992. – Identification of Common Noxious Cyanobacteria. Part II – Chroococales. Oscillatoriales. Urban Water Research Association of Australia. Research Report nº 46. Bourrelly P. 1970. – Les Algues d’Eau Douce. Initiation à la Systématique. Tome III: Eugléniens, Péridiniens, Algues Rouges et Algues Bleus. N. Boubée & Cie, Paris.
(8)
Codd G.A., Morrison L.F. & Metcalf J.S. 2005. – Cyanobacterial toxins: risk management for health protection. Toxicol. Appl. Pharmacol., 203, 264-272. Dittmann E. & Wiegand C. 2006. – Cyanobacterial toxins – occurrence, biosynthesis and impact on human affairs. Mol. Nutr Food Res., 50, 7-17. Falconer I.R. 2005. Cyanobacterial toxins of drinking Water supplies - Cylindrospermopsins and Microcystins. CRC Press. Hasle G. 1978. – Using the inverted microscope. Pagea 191-196 in Phytoplankton Manual nº 6. Sournia, A. (ed). UNESCO Monograms on Oceanographic Methodology, Paris. Komárek J. & Anagnostidis K. 1986. – Modern approach to the classification system of Cyanophytes. 2- Chroococcales. Algol. Stud., 43, 157-226. Moreno I., Cameán A., Tavares M.J., Pereira P. & Franca S. 2003. – Toxicity of cyanobacteria isolated from the Guadiana River. Aquat. Ecosyst. Health Manage., 6, 409-413. Sivonen, K. & Jones G. 1999. – Cyanobacterial toxins. Pages 41-111 in : Toxic cyanobacteria in water: a guide to their public health consequences, monitoring and management. Chorus, I. & Bartram J. (eds), E. & F.N. Spon, London. Ueno Y., Nagata S., Tsutsumi T., Hasegawa A., Yoshida F., Suttajit , Mebs D., Pütsch M. & Vasconcelos V. 1996. – Survey of microcystins in environmental water by a highly sensitive immunoassay based on monoclonal antibody. Nat. Toxins, 4, 271276. Vasconcelos V.M. 1993. – Toxicity of cyanobacteria in lakes of North and Central Portugal. Ecological implications. Verb. Internat. Verein. Limnol., 25, 694-697. Vasc oncelos VM. 1994. – Toxic cyanobacteria (blue-green algae) in Portuguese fresh waters. Arch. Hydrobiol., 130, 439-451. Vasconcelos VM. 2001. – Freshwater cyanobacteria and their toxins in Portugal. Pages 62-67 in : Cyanotoxins: occurrence, causes, consequences. I. Chorus (ed), Springer-Verlag, New York. Vasconcelos V.M., Sivonen K., Evans W.R., Carmichael W.W. & Namikoshi M. 1996. – Hepatotoxic microcystin diversity in cyanobacterial blooms collected in Portuguese freshwaters. Water Res., 30, 2377-2384. Vasconcelos VM, Evans WR, Carmichael WW & Namikoshi M. 1993. – Isolation of Microcystin-LR from a Microcystis (Cyanobacteria) waterbloom collected in the drinking water reservoir for Porto, Portugal. J. Environ. Sci. Health, A28, 20812094. WHO 1998. – Cyanobacterial Toxins: Microcystin-LR. Guideline for M. Drinking-Water Quality. World Health Organization, Geneva : 95110. Addendum to Volume 2. Vasc Vasc