AQUATIC MICROBIAL ECOLOGY Aquat Microb Ecol
Vol. 51: 263–274, 2008 doi: 10.3354/ame01196
Published June 16
Seasonal variations in trophic dynamics of nanoflagellates and picoplankton in coastal waters of the western subtropical Pacific Ocean An-Yi Tsai1, Kuo-Ping Chiang1, 3, 4,*, Jeng Chang2, 3, Gwo-Ching Gong3 1
Institute of Environmental Biology and Fishery Science, 2Institute of Marine Biology, 3Institute of Marine Environmental Chemistry and Ecology, and 4Center for Marine Bioscience and Biotechnology, National Taiwan Ocean University, Keelung 202-24, Taiwan, ROC
ABSTRACT: This investigation was undertaken between August 2002 and July 2003 at a coastal station on the southern edge of the East China Sea. We found a 2-phase (warm season, > 25°C [June to October] and cold season, < 25°C [November to May]) seasonal cycle with a 10-fold variation in the growth of bacteria (heterotrophic bacteria only) and picophytoplankton, primarily coccoid cyanobacteria (Synechococcus spp.), and nanoflagellate grazing rates upon them. Growth rate in bacteria and Synechococcus spp. appeared to be affected by changes in temperature, and the nanoflagellate grazing rate was controlled by concentrations of bacteria and Synechococcus spp. The seasonal cycles of abundance in bacteria and Synechococcus spp. were a reflection of their changing net growth rates (i.e. picoplankton growth rates – nanoflagellate grazing rates), which were highest at the beginning of the warm season. During the warm season, nanoflagellates consumed an equal amount of bacteria and Synechococcus spp.; therefore, growth in both groups was affected equally by grazing in the warm season. However, during the cold season, bacteria contributed more to nanoflagellate carbon consumed than did Synechococcus spp. because the growth rate of Synechococcus spp. was low. We conclude that during the warm season a significant part of bacteria and Synechococcus spp. carbon is channeled through the microbial loop, possibly making it an important link between primary production and higher trophic levels. KEY WORDS: Synechococcus spp. · Picoplankton · Nanoflagellate · Microbial loop Resale or republication not permitted without written consent of the publisher
Since the early 1970s, bacteria have been recognized as an important energy and carbon source in marine pelagic ecosystems (Pomeroy 1974). This knowledge has greatly expanded our view of plankton community structure and ecology, and Azam et al. (1983) formalized the concept of a microbial loop that recovers energy and carbon shunted from a phytoplanktonbased food web through the bacterioplankton. Bacteria are generally the most abundant component of the picoplankton (0.2 to 2 µm) size fraction, though they do not change much in density (Tsai et al. 2005), and their numbers vary by less than 1 order of magnitude over
the course of a year (Cole & Caraco 1993). Although bacteria, generally considered to be a significant component of planktonic food webs, mediate key processes in biogeochemical cycles (Cole 1999), the temporal and spatial change of mechanisms that regulate their biomass are still poorly understood. Experimental field studies of the relatively low seasonal variation in bacterial abundance in aquatic ecosystems have demonstrated that their abundance is tightly regulated by factors such as substrate supply (Murrell 2003), nutrients (Billen et al. 1990), predation (Tsai et al. 2005), temperature (Shiah & Ducklow 1994) and viral infections (Weinbauer & Peduzzi 1995). Furthermore, due to the generally negative covariation between
*Corresponding author. Email:
[email protected]
© Inter-Research 2008 · www.int-res.com
INTRODUCTION
264
Aquat Microb Ecol 51: 263–274, 2008
picoplankton is controlled by 2 different processes: nutrient concentration and seawater temperature (Tsai top-down grazing and bottom-up growth. et al. 2005), these observations suggest that bacterial Bacteria and Synechococcus spp. make up the major production rates are weakly related to temperature proportion of the picoplankton community (Tsai et al. over the summer, but strongly affected by temperature 2005). The study on the microbial loop in the subtropical during cold months. Similarly, Ochs et al. (1995) found western Pacific coastal waters was limited to the that bacterial growth rates were unrelated to temperaabundances of the bacteria Synechococcus spp. and tures above 14°C, which was further confirmed by nanoflagellates during a series of samplings over 4 yr Shiah & Ducklow (1994). Their findings suggest that (Tsai et al. 2005). Those authors, however, lacked suffitemperature might control bacterial growth activity cient information to discuss the seasonality of growth of during the colder months. Growth in the warmer seabacteria and Synechococcus spp. or nanoflagellate sons seems to be controlled by factors such as substrate grazing rates upon them. The present study seeks to supply or availability of nutrients (Keil & Kirchman measure and explore mechanisms controlling the annual 1991). Tsai et al. (2005) found a significant diel variadynamic growth of bacteria and Synechococcus spp. and tion in bacterial growth, but there is a lack of data on grazing rates upon both groups by nanoflagellates. the seasonal variation in bacterial growth and of nanoflagellate grazing rates, and on factors controlling the effect of nanoflagellate grazing on bacteria MATERIALS AND METHODS throughout the year. One study (Choi 1994), however, suggested that water temperature and prey density are Sampling. Samples were collected at a coastal staamong the most important factors regulating the seation (25° 09.4’ N, 121° 46.3’ E) on a rocky shore of northsonal grazing rate on bacteria by protists. east coast of Taiwan (Fig. 1). In our previous study Picophytoplankton, predominantly coccoid cyano(Tsai et al. 2005), we collected a series of morning bacteria (Synechococcus spp.), on the other hand, can (09:00 to 10:00 h) and evening (21:00 to 22:00 h) sammake up a major proportion of the phytoplankton bioples on the same day on a weekly basis over a period of mass and production in oceanic waters (Olson et al. about 4 yr (data shown in Fig. 2). 1990), and contribute up to 90% of total phytoplankton Samples for this study of seasonal patterns of the biomass in oligotrophic waters (Probyn 1985). Chiang growth of bacteria and Synechococcus spp. and nanoet al. (2002) demonstrated that temperature controlled flagellate grazing rates were collected bimonthly from the seasonal variation of Synechococcus spp. in the August 2002 to July 2003. On each sampling day, seaEast China Sea. Chang et al. (1996) also suggested that water was collected twice, from 09:00 to 10:00 h in the the abundance of Synechococcus spp. in the subtropimorning and 21:00 to 22:00 h in the evening (local cal western Pacific Ocean coastal ecosystem was closely related to water temperature. Moreover, Tsai et al. (2005) confirmed the results of Chang et al. (1996) and demonstrated a diel fluctuation in Synechococcus spp. abundance at water temperatures above 25°C in a subtropical oligotrophic coastal ecosystem. Our results support these conclusions, and we found bacteria and Synechococcus spp. growth to be controlled by temperature and nutrients. Wikner et al. (1990) reported grazing to be an important removal process for the picoplankton community in aquatic ecosystems; the consumption of picoplankton by phagotrophic protists has been recognized as a major pathway of carbon flow (Nagata 1988, Dolan & 2imek 1999, Sanders et al. 2000, Tsai et al. 2005). Thus, top-down controls such as grazing are thought to set limits on picoplankton biomass and abundance. In summary, the seasonal or Fig. 1. Sampling site at the northern end of Taiwan and surrounding area in the East China Sea diel oscillation in the abundance of
Tsai et al.: Seasonal variations in plankton trophic dynamics
7
Log bacteria (cells ml–1)
A
6
5
Log Synechococcus (cells ml–1)
Oct Feb Jun
6
B
5
4
3 Oct Feb Jun
Log nanoflagellates (cells ml–1)
Oct Feb Jun Sep Jan May Sep Feb Jun
5
Oct Feb Jun Sep Jan May Sep Feb Jun
C
4
3
2 Oct Feb Jun
1999 2000
Oct Feb Jun Sep Jan May Sep Feb Jun 2001 2002 2003
Month/year
Fig. 2. Comparison between day (s) and night (d) abundance of pico- and nanoplankton during the 4 yr investigation period. (A) Bacteria, (B) Synechococcus spp., (C) total nanoflagellates. The data from October 1999 to August 2001 are published in Tsai et al. (2005)
time). Water temperature was measured immediately after the sampling bucket was cast. All samples were brought to the laboratory within 30 min. Plankton abundance and nitrate. Samples for the measurement of pico- and nanoplankton quantities were fixed immediately by adding glutaraldehyde to give a final concentration of 1% (v/v). Using a 0.45 µm pore size Millipore filter as a pad to obtain a uniform distribution of cells and low pressure ( 25 5.3–> 30 8.6~14 11.1–20.8 13–20 16–30 18–29 Bacteria Subarctic Subarctic Subarctic Subarctic Temperate Temperate Temperate Temperate Temperate Temperate Temperate Temperate Temperate Temperate Subtropical
Abundance (106 cells ml–1)
Growth rate (h–1)
Production (104 cells ml–1 h–1)
Grazing rate (h–1)
Grazing loss (104 cells ml–1 h–1)
Source and method
Aquat Microb Ecol 51: 263–274, 2008
Temperature (°C)
Table 2. Seasonal variations of abundance, growth of bacteria or Synechococcus spp. and nanoplankton grazing features with different environmental conditions determined by the culture methods in the literature
270
Growth of bacteria and Synechococcus spp. and nanoflagellate grazing rates The seasonal variations in the growth of bacteria and Synechococcus spp. and nanoflagellate grazing rates upon these picoplankton are generally correlated with environmental factors that limit the rates. Experimental field studies have identified resources (organic carbon and inorganic nutrients) and temperature to be the main factors limiting the growth of bacteria and Synechococcus spp. (Carlsson & Caron 2001). The day and night growth rates of Synechococcus spp. were strongly related to temperature in our study (Fig. 4B), which suggests that the seasonal variation of Synechococcus spp. growth is controlled by seasonal fluctuation in temperature, a conclusion that has
271
Tsai et al.: Seasonal variations in plankton trophic dynamics
been demonstrated by previous studies (Agawin et al. 1998, Murrell 2003). Moreover, other factors, such as light, can modulate the growth of Synechococcus spp. In our study area, the daytime mean light intensity was 729 µmol quanta m–2 s–1 during the warm season, and 98 µmol quanta m–2 s–1 during the cold season (K.-P. Chiang unpubl. data). According to Allewalt et al. (2006) the saturation level of light intensity of Synechococcus spp. is 70 to 220 µmol quanta m–2 s–1. Based on this value, our incubation at 150 µmol quanta m–2 s–1 should not generate growth rates that deviate far from field values for Synechococcus spp. Moreover, in our study, the in situ bacterial growth occurred over a wide range of temperatures between 16 and 29°C and was poorly correlated with temperature beyond 25°C (Fig. 4A). This temperatureindependent range of bacterial growth was higher than the ranges reported by Shiah & Ducklow (1994) and Carlsson & Caron (2001). Shiah & Ducklow (1994) found that temperature was not an important determinant of bacterial production rate when above 12°C, and Carlsson & Caron (2001) suggested that when less than ca. 20°C, temperature played a more important role than did substrate supply in limiting bacterial growth. The higher temperature-independent range at our study site is probably due to higher annual range of water temperature. Because most studies have not focused on the seasonal variation of nanoflagellate grazing rates on bacteria or Synechococcus spp., the mechanisms that regulate the seasonal variation of grazing rates are still poorly understood. An examination of our field data indicates a positive relationship between nanoflagellate ingestion rate and the abundances of bacteria and Synechococcus spp. (Fig. 6). Some studies consider water temperature and prey density to be among the most important factors regulating the seasonal ingestion rate of nanoflagellates (Choi 1994). However, in our study, these correlations were weak between observed grazing rates on bacteria or Synechococcus spp. and water temperatures (data not shown). From our results, we conclude that the ingestion rate of nanoflagellates is most probably affected by the concentration of bacteria and Synechococcus spp. (Fig. 6). A similar conclusion was reported by Landry etal. (1984) and Nagata (1988). From the present study, we know that the seasonal cycle of picoplankton growth and nanoflagellate predation are controlled by different mechanisms (Fig. 10). The growth of picoplankton (bacteria and Synechococcus spp.) is controlled by temperature in the cold season, but in the warm season, the control factor of Synechococcus spp. growth is temperature, and that of bacteria is substrate supply. The variations in nanoflagellate ingestion of bacteria and
Synechococcus spp. follow the changes in prey concentration.
Seasonal changes in the abundance and net growth rates of bacteria and Synechococcus spp. If bacterial production is not balanced by grazing, other sources of bacterial losses, such as cell death, viruses and sedimentation (Pace 1988), may account for the imbalance. In our study, an apparent balance between bacterial growth and grazing suggests that nanoflagellates are major consumers (Fig. 8A). 2imek et al. (1990) observed that ciliates contributed an aver-
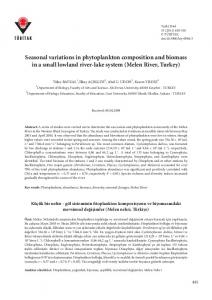
Nanoflagellate
A
9 µg C l–1
0.55–0.73
0.58–0.68 Synechococcus
Bacteria –1
18–21 µg C l–1
12–16 µg C l
0.61–0.81
Substrate supply
Temperature
0.60–0.71
Nanoflagellate
B
2 µg C l–1
0.09–0.12
0.02–0.023 Synechococcus
Bacteria –1
4.5–6 µg C l
0.9–1.1 µg C l–1
0.12–0.16 Temperature
0.03–0.04 Temperature
Fig. 10. Schematic carbon flow diagrams depicting warm seasonal variations in energy transfer of picoplankton production to nanoflagellates in a subtropical western Pacific coastal ecosystem from (A) June to October and (B) November to May. The numbers within individual phytoplankton, picoplankton and nanoflagellate boxes refer to their biomass. The numbers next to looped arrows represent picoplankton production rates (µg C l–1 h–1). Straight arrows pointing to nanoflagellates show their grazing rates (µg C l–1 h–1). The controlling factors of growth are indicated within the ellipses. Arrow thickness represents the level of production or grazing rates
272
Aquat Microb Ecol 51: 263–274, 2008
age of 71% to the total protozoan bacterivory and balanced bacterial production in the summer period. However, the importance of ciliates in our study is not certain because their numbers are so low (Chen 2003). Chen (2003) also reported that ciliates account for the removal of only about 3% of Synechococcus spp. production. Thus, the potential effect of nanoflagellate predation on the removal of picoplankton in our study appears to be substantial. The dynamics of the bacteria and Synechococcus spp. community were affected by both growth and grazing rates. In this study of subtropical coastal waters, the abundances of bacteria, Synechococcus spp. and nanoflagellates clearly varied with time, with higher abundances occurring during the warm season (> 25°C). However, the seasonal variations in picoplankton growth rate and nanoflagellate grazing rate showed a phase shift of 1 mo (Table 1). In fact, seasonal cycles of bacteria and Synechococcus spp. abundances are a reflection of the changing net growth rates (growth rate – grazing rate). The highest net growth rate for both bacteria and Synechococcus spp. occurred from March to May (Table 1, Fig. 9), when abundance was at its lowest and the temperature began to rise. During this period, the abundance of the bacteria and Synechococcus spp. community sharply increased. Abundance peaked in June and then net growth gradually decreased and finally approached zero in October. During this period, the abundance of picoplankton remained at a high and stable level. Later, because the temperature dropped after October, the net growth rate was negative, while the bacteria and Synechococcus spp. abundance also declined (Table 1, Fig. 9). Based on these findings, the observed seasonal variations in abundance can be explained by the following scenario in which both water temperature and nanoflagellate grazing influence the dynamics of the bacteria and Synechococcus spp. community. In addition, the grazing effect is controlled by prey concentrations. During the change from cold to warm seasons (March to April), the growth rates of bacteria and Synechococcus spp. increased with increasing temperature, while the nanoflagellate grazing rate was low due to low concentration of prey, resulting in a gradual increase in the net picoplankton growth rate (April to June). The increase of net growth rate caused increases in their abundances. When abundances reached the peak in June, the growth rate and grazing rate were in balance, and the net growth rate approached zero. When prey concentration and temperature gradually decreased in the later part of the warm season, the rate of grazing upon them increased and exceeded their growth rate, and their net rate of growth became negative. Hence, the abundance of bacteria and Synechococcus spp. gradually decreased.
Seasonal pattern of carbon flow in the microbial loop In this study of a subtropical coastal area, we found a significant difference in bacteria and Synechococcus spp. community dynamics between the warm (> 25°C, June to October) and cold seasons (< 25°C, November to May). During the warm season, there was diel variation in the growth of bacteria and Synechococcus spp. and nanoflagellate grazing rates (Figs. 3 & 5). This phenomenon was caused by nanoflagellates that largely depend on bacteria as an energy source during the daytime, but depend on Synechococcus spp. at night during the warm season. In contrast, diel variation was not found during the cold season. We believe that the different ecological characteristics occurring in these 2 seasons are driven by 2 types of carbon flux patterns. Nanoflagellates are now known to have the potential to regulate the production and abundance of picoplankton and are, therefore, thought to play a key role in the transfer of picoplanktonic carbon to higher trophic levels (Hahn & Hofle 2001). In our approach to evaluate how the dynamics of bacteria, Synechococcus spp. and nanoflagellates affect the energy flow in the microbial loop, growth and grazing rates were converted to carbon fluxes. Carbon contents for bacteria were taken from Caron et al. (1995) (15 fg C cell–1) and Ducklow & Carlson (1992) (20 fg C cell–1), and those for Synechococcus spp. were from Cuhel & Waterbury (1984) (294 fg C cell–1) and Børsheim & Bratbak (1987) (250 fg C cell–1). For bacteria, the production and grazing carbon fluxes ranged from 0.55 to 0.73 and 0.61 to 0.81 µg C l–1 h–1, respectively (Fig. 10A). For Synechococcus spp., the ranges of production and grazing carbon fluxes were 0.58 to 0.68 and 0.60 to 0.71 µg C l–1 h–1, respectively (Fig. 10A). The bacteria and Synechococcus spp. fluxes of production and grazing were lower during the cold season and higher in the warm season (Fig. 10B). For bacteria, the production rate and grazing carbon fluxes dropped drastically and fluctuated between 0.02 and 0.26 µg C l–1 h–1 and between < 0.01 and 0.21 µg C l–1 h–1, respectively. For Synechococcus spp., the production and grazing carbon fluxes dropped to a low level in the cold season, with ranges of 0.02 to 0.023 and 0.03 to 0.04 µg C l–1 h–1, respectively (Fig. 10B). Based on these findings, we conclude that both bacteria and Synechococcus spp. production and loss from grazing show a balanced situation in which bacteria and Synechococcus spp. production can be completely consumed by nanoflagellates within the warm season. We also found that bacteria contributed more to nanoflagellate carbon consumed than did Synechococcus spp. during the cold season because the growth rate of Synechococcus
Tsai et al.: Seasonal variations in plankton trophic dynamics
273
spp. was low. From these results, we postulate that ➤ Chang J, Lin KH, Chen KM, Gong GC, Chiang KP (2003) Synechococcus growth and mortality rates in the East bacteria and Synechococcus spp. are equally imporChina Sea: range of variations and correlation with envitant energy sources for nanoflagellates (Boissonneaultronmental factors. Deep-Sea Res II 50:1265–1278 Cellineri et al. 2001, Callieri et al. 2002) during the Chase Z, Price NM (1997) Metabolic consequences of iron warm season. During the cold season, however, bactedeficiency in heterotrophic marine protozoa. Limnol Oceanogr 42:1673–1684 ria are the major food source. This trend was also Chen KM (2003) Ciliate grazing on Synechococcus in a demonstrated by Christaki et al. (2002) (Fig. 10A,B). coastal and shelf marine ecosystem: spatial-temporal variWe conclude that during the warm season a significant ations and importance to biological carbon cycling. PhD part of bacteria and Synechococcus spp. carbon is dissertation, National Taiwan Ocean University, Keelung channeled through the microbial loop, possibly mak- ➤ Chiang KP, Kuo MC, Chang J, Wang RH, Gong GC (2002) Spatial and temporal variation of the Synechococcus poping it an important link between primary production ulation in the East China Sea and its contribution to phytoand higher trophic levels. plankton biomass. Cont Shelf Res 22:3–13
➤ Choi DH, Park JS, Hwang CY, Huh SH, Cho BC (2002) Effects Acknowledgements. This study was supported by a grant (NSC 91-2313-B-019-031) from the National Science Council, Republic of China.
➤
LITERATURE CITED
➤ Agawin NSR, Duarte CM, Agustí S (1998) Growth and abun-
➤
➤ ➤ ➤
➤ ➤
➤ ➤
➤
➤
dance of Synechococcus sp. in a Mediterranean Bay: seasonality and relationship with temperature. Mar Ecol Prog Ser 170:45–53 Allewalt JP, Bateson MM, Revsbech NP, Slack K, Ward DM (2006) Effect of temperature and light on growth of and photosynthesis by Synechococcus isolates typical of those predominating in the octopus spring microbial mat community of Yellowstone National Park. Appl Environ Microbiol 72:544–550 Anderson MR, Rivken BR (2001) Seasonal patterns in grazing mortality of bacterioplankton in polar oceans: a bipolar comparison. Aquat Microb Ecol 25:195–206 Azam F, Fenchel T, Field JG, Gray JS, Meyer-Reil LA, Thingstad F (1983) The ecological role of water-column microbes in the sea. Mar Ecol Prog Ser 10:257–263 Billen G, Servais P, Becquevort S (1990) Dynamics of bacterioplankton in oligotrophic and eutrophic aquatic environments: bottom-up or top-down control? Hydrobiologia 207:37–42 Boenigk J, Arndt H (2002) Bacterivory by heterotrophic flagellates: community structure and feeding strategies. Antonie Leeuwenhoek 81:465–480 Boissonneault-Cellineri KR, Mehta M, Lonsdale DH, Caron DA (2001) Microbial food web interactions in two Long Island embayments. Aquat Microb Ecol 26:139–155 Børsheim KY, Bratbak G (1987) Cell volume to cell carbon conversion factors for a bacterivorous Monas sp. enriched from seawater. Mar Ecol Prog Ser 36:171–175 Callieri C, Karjalainen SM, Passoni S (2002) Grazing by ciliates and heterotrophic nanoflagellates on picocyanobacteria in Lago Maggiore, Italy. J Plankton Res 24:785–796 Carlsson P, Caron DA (2001) Seasonal variation of phosphorus limitation of bacterial growth in a small lake. Limnol Oceanogr 46:108–120 Caron DA, Kremer HGP, Lessard EJ, Madin LP and others (1995) The contribution of microorganisms to particulate carbon and nitrogen in surface waters of the Sargasso Sea near Bermuda. Deep-Sea Res II 42:943–972 Chang J, Chung CC, Gong GC (1996) Influences of cyclones on chlorophyll a concentration and Synechococcus abundance in a subtropical western Pacific coastal ecosystem. Mar Ecol Prog Ser 140:199–205
➤ ➤
➤
➤
➤
of thermal effluents from a power station on bacteria and heterotrophic nanoflagellates in coastal waters. Mar Ecol Prog Ser 229:1–10 Choi DH, Hwang CY, Cho BC (2003) Comparison of virusand bacterivory-induced bacterial mortality in the eutrophic Masan Bay, Korea. Aquat Microb Ecol 30: 117–125 Choi JW (1994) The dynamic nature of protistan ingestion response to prey abundance. J Eukaryot Microbiol 41: 137–146 Christaki U, Courties C, Karayanni H, Giannakourou A, Maravelias C, Kormas KA, Lebaron P (2002) Dynamic characteristics of Prochlorococcus and Synechococcus consumption by bacterivorous nanoflagellates. Microb Ecol 43: 341–352 Cole JJ (1999) Aquatic microbiology for ecosystem scientists: new and recycled paradigms in ecological microbiology. Ecosystems 2:215–225 Cole JJ, Caraco NF (1993) The pelagic food web of oligotrophic lakes. In: Ford TE (ed) Aquatic microbiology. Blackwell, New York, p 101–111 Cuhel R, Waterbury JB (1984) Biochemical composition and short term nutrient incorporation patterns in a unicellular marine cyanobacterium, Synechococcus (WH7803). Limnol Oceanogr 29:370–374 Dolan JR, 2imek K (1999) Diel periodicity in Synechococcus populations and grazing by heterotrophic nanoflagellates: analysis of food vacuole contents. Limnol Oceanogr 44:1565–1570 Ducklow HW, Carlson CA (1992) Oceanic bacterial production. In: Marshal KC (ed) Advances in microbial ecology, Vol 12. Plenum Press, New York, p 113–181 Gasol JM, Morán XAG (1999) Effects of filtration on bacterial activity and picoplankton community structure as assessed by flow cytometry. Aquat Microb Ecol 16:251–264 Gong GC, Liu KK, Pai SJ (1995) Prediction of nitrate concentration from two end member mixing in the Southern East China Sea. Deep-Sea Res I 15:827–842 Gurung TK, Nakanishi M, Urabe J (2000) Seasonal and vertical difference in negative and positive effects of grazers on heterotrophic bacteria in Lake Biwa. Limnol Oceanogr 45:1689–1696 Hahn MW, Hofle MG (2001) Grazing of protozoa and its effect on populations of aquatic bacteria. FEMS Microbiol Ecol 35:113–121 Hall JA, James MR, Bradford-Grieve JM (1999) Structure and dynamics of the pelagic microbial food web of the Subtropical Convergence region east of New Zealand. Aquat Microb Ecol 20:95–105 Heinänen A (1992) Bacterioplankton in a subarctic estuary: the Gulf of Bothnia (Baltic Sea). Mar Ecol Prog Ser 86:123–131
274
Aquat Microb Ecol 51: 263–274, 2008
➤ Johnson MD, Ward AK (1997) Influence of phagotrophic pro-
➤
➤ ➤ ➤ ➤
➤ ➤
➤ ➤
➤
➤ ➤ ➤
tistan bacterivory in determining the fate of dissolved organic matter (DOM) in a wetland microbial food web. Microb Ecol 33:149–162 Keil RG, Kirchman DL (1991) Contribution of dissolved free amino acids and ammonium to the nitrogen requirements of heterotrophic bacterioplankton. Mar Ecol Prog Ser 73:1–10 Kuosa H (1991) Picoplanktonic algae in the northern Baltic sea: seasonal dynamics and flagellate grazing. Mar Ecol Prog Ser 73:269–276 Landry MR, Hass LW, Fagerness VL (1984) Dynamics of microbial plankton communities: experiments in Kaheone Bay, Hawaii. Mar Ecol Prog Ser 16:127–133 Lee CW, Kudo I, Yanada M, Maita Y (2001) Bacterial abundance and production and their relation to primary production in Funka Bay. Plankton Biol Ecol 48(1):1–9 Metzler PM, Glibert PM, Gaeta SA, Ludlam JM (2000) Contrasting effects of substrate and grazer manipulations on picoplankton in oceanic and coastal waters off Brazil. J Plankton Res 22:77–90 Murrell MC (2003) Bacterioplankton dynamics in a subtropical estuary: evidence for substrate limitation. Aquat Microb Ecol 32:239–250 Murrell MC, Hollibaugh JT (1998) Microzooplankton grazing in northern San Francisco Bay measured by the dilution method. Aquat Microb Ecol 15:53–63 Nagata T (1988) The microflagellate–picoplankton food linkage in the water column of Lake Biwa. Limnol Oceanogr 33:504–517 Ochs CA, Cole JJ, Liken GE (1995) Population dynamics of bacterioplankton in an oligotrophic lake. J Plankton Res 17:365–391 Olson RJ, Chisholm SW, Zettle ER, Altabet MA, Dusenberry JA (1990) Spatial and temporal distributions of prochlorophyte picoplankton in the North Atlantic Ocean. DeepSea Res A 37:1033–1051 Pace ML (1988) The problem of bacterial death rates. Hydrobiologia 159:41–49 Pomeroy LR (1974) The ocean’s food web, a changing paradigm. BioScience 24:499–504 Porter KG, Feig YS (1980) The use of DAPI for identifying and counting aquatic microflora. Limnol Oceanogr 25:943–948 Probyn TA (1985) Nitrogen uptake by size-fractionated phytoplankton populations in the southern Benguela upwelling system. Mar Ecol Prog Ser 22:249–258 Putland JN (2000) Microzooplankton herbivory and bacterivory in Newfoundland coastal waters during spring, summer and winter. J Plankton Res 22:253–277 Sanders RW, Berninger UG, Lim EL, Kemp PF, Caron DA (2000) Heterotrophic and mixotrophic nanoplankton Editorial responsibility: Klaus Jürgens, Rostock, Germany
➤
➤
➤
➤
➤
➤
predation on picoplankton in the Sargasso Sea and on Georges Bank. Mar Ecol Prog Ser 192:103–118 Schultz GE Jr, White ED III, Ducklow HW (2003) Bacterioplankton dynamics in the York River estuary: primary influence of temperature and freshwater inputs. Aquat Microb Ecol 30:135–148 Sherr BF, Sherr EB, McDaniel J (1992) Effect of protistan grazing on the frequency of dividing cells in bacterioplankton assemblages. Appl Environ Microbiol 58: 2381–2385 Sherr EB, Sherr BF, McDaniel J (1991) Clearance rates of < 6 µm fluorescently labeled algae (FLA) by estuarine protozoa: potential grazing impact of flagellates and ciliates. Mar Ecol Prog Ser 69:81–92 Shiah FK, Ducklow HW (1994) Temperature regulation of heterotrophic bacterioplankton abundance, production, and specific growth rate in Chesapeake Bay. Limnol Oceanogr 39:1243–1258 2imek K, Macek M, Vyhnálek V (1990) Uptake of bacteriasized fluorescent particles by natural protozoan assemblage in a reservoir. Arch Hydrobiol Beih Ergebn Limnol 34:275–281 2oli´c M, Krstulovi´c N (1994) Role of predation in controlling bacterial and heterotrophic nanoflagellate standing stocks in the coastal Adriatic Sea: seasonal patterns. Mar Ecol Prog Ser 114:219–235 Tsai AY, Chiang KP, Chang J, Gong GC (2005) Seasonal diel variations of picoplankton and nanoplankton in a subtropical western Pacific coastal ecosystem. Limnol Oceanogr 50:1221–1231 Vaqué D, Calderón-Paz JI, Guixa-Boixereu N, Pedró-Alió C (2002) Spatial distribution of microbial biomass and activity (bacterivory and bacterial production) in the northern Weddell Sea during the austral summer (January 1994). Aquat Microb Ecol 29:107–121 Weinbauer MG, Peduzzi P (1995) Significance of viruses versus heterotrophic nanoflagellates for controlling bacterial abundance in the northern Adriatic Sea. J Plankton Res 17:1851–1856 Wikner J, Hagström Å (1991) Annual study of bacterioplankton community dynamics. Limnol Oceanogr 36:1313–1324 Wikner J, Rassoulzadegan F, Hagström Å (1990) Periodic bacterivore activity balances bacterial growth in the marine environment. Limnol Oceanogr 35:313–324 Wright RT, Coffin RB (1984) Measuring microzooplankton grazing on planktonic marine bacteria by its impact on bacterial production. Microb Ecol 10:137–149 Xiuren N, Vaulot D (1992) Estimating Synechococcus spp. growth rates and grazing pressure by heterotrophic nanoplankton in the English Channel and the Celtic Sea. Acta Oceanol Sin 11:255–273 Submitted: April 30, 2007; Accepted: March 18, 2008 Proofs received from author(s): May 30, 2008