Atmos. Chem. Phys., 12, 1367–1376, 2012 www.atmos-chem-phys.net/12/1367/2012/ doi:10.5194/acp-12-1367-2012 © Author(s) 2012. CC Attribution 3.0 License.
Atmospheric Chemistry and Physics
Seasonal variations of stable carbon isotopic composition and biogenic tracer compounds of water-soluble organic aerosols in a deciduous forest Y. Miyazaki1 , P. Q. Fu1,* , K. Kawamura1 , Y. Mizoguchi2 , and K. Yamanoi2 1 Institute
of Low Temperature Science, Hokkaido University, Sapporo, Japan Research Center, Forestry and Forest Products Research Institute, Sapporo, Japan * now at: Institute of Atmospheric Physics, Chinese Academy of Sciences, Beijing, China 2 Hokkaido
Correspondence to: Y. Miyazaki (
[email protected]) Received: 31 October 2011 – Published in Atmos. Chem. Phys. Discuss.: 16 November 2011 Revised: 17 January 2012 – Accepted: 27 January 2012 – Published: 3 February 2012
Abstract. To investigate the seasonal changes in biogenic water-soluble organic carbon (WSOC) aerosols in a boreal forest, aerosol samples were collected continuously in the canopy of a deciduous forest in northern Japan during 2009–2010. Stable carbon isotopic composition of WSOC (δ 13 CWSOC ) in total suspended particulate matter (TSP) exhibited a distinct seasonal cycle, with lower values from June through September (−25.5±0.5 ‰). This cycle follows the net CO2 exchange between the forest ecosystem and the atmosphere, indicating that δ 13 CWSOC likely reflects the biological activity at the forest site. WSOC concentrations showed the highest values in early summer and autumn. Positive matrix factorization (PMF) analysis indicated that the factor in which biogenic secondary organic aerosols (BSOAs) dominated accounted for ∼40 % of the highest concentrations of WSOC, where BSOAs mostly consisted of α/β-pinene SOA. In addition, primary biological aerosol particles (PBAPs) made similar contributions (∼57 %) to the WSOC near the forest floor in early summer. This finding indicates that the production of both primary and secondary WSOC aerosols is important during the growing season in a deciduous forest. The methanesulfonic acid (MSA) maximum was also found in early summer and had a distinct vertical gradient with larger concentrations near the forest floor. Together with the similar vertical gradients found for WSOC and δ 13 CWSOC as well as the α-/β-pinene SOA tracers, our results indicate that the forest floor, including ground vegetation and soil, acts as a significant source of WSOC in TSP within a forest canopy at the study site.
1
Introduction
Forest ecosystems act as a major sink of atmospheric CO2 and a source of atmospheric organic aerosols (Kavouras et al., 1998; Kulmala et al., 2004; Tunved et al., 2006). Forest vegetation contributes substantially to emissions of a variety of biogenic volatile organic compounds (BVOCs) via processes that are closely linked to photosynthesis (e.g., Pe˜nuelas and Staudt, 2010). In boreal forests, photosynthesis is inhibited in winter and occurs predominantly in sunlight during the growing season. Although forest–atmosphere interactions are potentially important for climate change assessments (Kulmala et al., 2004; Mahowald, 2011), such interactions are complicated and poorly represented in current global models (Bonan, 2008). Newly formed particles in forested areas contain a large fraction of water-soluble organic carbon (WSOC) (e.g., Cavalli et al., 2006; Hallquist et al., 2009), which can significantly alter the hygroscopic property of aerosols and act as cloud condensation nuclei (CCN). Nucleation events were frequently observed in a European boreal forest, and investigation of these events demonstrate a straightforward relation between monoterpene emissions and gas-to-particle formation (Tunved et al., 2006). However, previous observations have often been made in limited periods during intensive campaign studies. Long-term continuous measurements in forested regions are lacking and simultaneous ecosystem-scale measurements of WSOC and CO2 fluxes over several months to years are particularly scarce. Clarifying the seasonal evolution of WSOC in relation to forest
Published by Copernicus Publications on behalf of the European Geosciences Union.
1368
Y. Miyazaki et al.: Seasonal variations of WSOC in a deciduous forest
biological activity is crucial for a better understanding of the WSOC formation processes in forests. Besides biogenic secondary organic aerosol (BSOA) fractions, primary biological aerosol particles (PBAPs) (Medeiros et al., 2006; Rogge et al., 2007; Jia et al., 2010) contribute to the budget of WSOC in aerosols, although this budget is still poorly characterized. In addition, the relative importance of the canopy floor within forests is not well understood in terms of WSOC formation. The stable carbon isotope ratio (δ 13 C) is a powerful tool for source determination based on the distinctive signals of different aerosol carbon fractions. For example, C3 plants, which use the Calvin-Benson cycle as a metabolic pathway for carbon fixation in photosynthesis, have δ 13 C values typically in the range of −23 to −30 ‰ (Gelencs´er, 2004). All trees and most shrubs, grasses, and sedges in mid-latitude and boreal regions belong to the C3 class of plants. The most common application of carbon isotopic measurements for aerosols is for the measurement of total carbon (TC) (e.g., Cachier et al., 1986; Turekian et al., 2003). In contrast, very few studies have used the δ 13 C of WSOC for source apportionment (Fisseha et al., 2009; Kirillova et al., 2010). The WSOC-specific δ 13 C analysis, combined with biogenic molecular markers, allows for source apportionment of aerosol WSOC in forested areas. In this paper, we present seasonal changes in biogenic WSOC within the canopy of a broadleaf deciduous forest over an 18-month period. We provide measurements of WSOC and δ 13 CWSOC in relation to the net CO2 exchange between the forest ecosystem and the atmosphere. We also present the relative contributions of potential sources to WSOC formation in the forest canopy using δ 13 CWSOC , BSOA tracers, and PBAP tracers. Moreover, methanesulfonic acid (MSA) was found at the forest site, and its possible sources are discussed. MSA is formed by the photooxidation of dimethylsulfide (DMS) and is typically found in marinebiologically influenced aerosols; measurements of MSA in terrestrial regions are limited (e.g., Luk´acs et al., 2009). On the basis of these data sets, we discuss the relative importance of the forest floor in WSOC formation at a deciduous forest site.
2 2.1
Experimental Aerosol sampling
Aerosol sampling was conducted at the Sapporo forest meteorology research site (42◦ 590 N, 141◦ 230 E, 182 m a.s.l.), which is a secondary hardwood forest site located in the western part of Hokkaido, the northernmost major island of Japan. The experimental site is covered with broadleaf deciduous trees in a transitional stage from mature birch (Betula platyphylla) to climax species, mainly Mizunara oak (Quercus crispula). Needle-leaf evergreen trees are also found in the surrounding area. The understory consists of evergreen Atmos. Chem. Phys., 12, 1367–1376, 2012
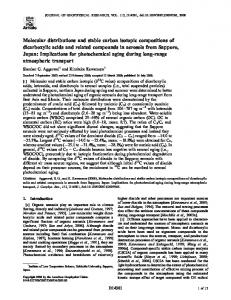
Sasa bamboo (Sasa kurilensis and Sasa senanensis), which widely covers the ground surface. Nakai et al. (2003) examined the seasonal variations in the leaf area index (LAI) at this forest site, showing that the initial foliating period is completed by the end of June, after which the LAI remains almost constant until September. They also reported that the evolution pattern of the LAI at this site is similar to that at other temperate deciduous forests (e.g., Greco and Baldocchi, 1996). The soil is loamy, originating from volcanic ash. The mean canopy height at the site is approximately 20 m (Nakai et al., 2003). Snow cover reaches approximately 1 m in depth and continues for more than 120 days per year, from December to mid-April. Total suspended particulate matter (TSP) samplings were conducted continuously using high-volume air samplers. The samples were collected using prebaked quartz fiber filters (25×20 cm) at a flow rate of 40 m3 h−1 at two levels above the forest floor: ∼2 m (June 2009–December 2010) and ∼15 m (June 2010–December 2010). Each aerosol sample was integrated usually over a 1-week period, corresponding to a sampled air volume of approximately 6700 m3 . Local meteorological parameters were measured every 10 min by a weather transmitter (WXT-510, Vaisala, Helsinki, Finland). Figure 1 shows the location of the sampling site and the surrounding area, as well as the observed frequencies of local wind directions with wind speed greater than 0.5 m s−1 at the sampling site. The predominant local wind direction in summer and autumn (May–October) was from the south to southwest, corresponding to the forested area. Moreover, the meteorological data show that 68 % of the local wind speed was 0.5 m s−1 . 2.2
Chemical analysis
To determine the WSOC concentration, a filter cut of 1.54 cm2 was extracted with ultrapure Milli-Q water using an ultrasonic bath. The total extracts were then filtrated with a disc filter (Millex-GV, 0.22 µm, Millipore, Billerica, MA, USA) followed by injection of dissolved OC in the extracts into a total organic carbon analyzer (Model TOC-Vcsh, Shimadzu, Kyoto, Japan) (Miyazaki et al., 2011). The WSOC value for a filter punch of a field blank corresponds to ∼7 % of the average WSOC concentration of the ambient samples. All WSOC data presented here have been corrected against field blanks. For the determination of δ 13 CWSOC , a filter (14.13 cm2 ) for each sample was acidified to pH 2 with hydrochloric acid (HCl) to remove inorganic carbon prior to extraction. The samples were then dried with a nitrogen stream for www.atmos-chem-phys.net/12/1367/2012/
Y. Miyazaki et al.: Seasonal variations of WSOC in a deciduous forest
1369
Fig. 1
142
144
o
Longitude ( E) N
N NW
W
E
W
SE
SW
(%)
SE
SW
S
S
Winter-Spring
Summer-Autumn
2
1
1 0
13
(b) δ CWSOC
0.3
-22
0.2
-23
0.1
-24
0
-25 -26
-0.1
-27
-0.2
-28
E
(%)
2
0
NE
NW
NE
3
Fig. 1. Location of the sampling site (the Sapporo forest meteorology research site). Also shown is the observed frequency of local wind directions with wind speed >0.5 m s−1 in winter–spring (November–April) and summer–autumn(May–October).
100 (c) MSA
100
50
50
0
30
NEE (mgCO2 m-2 s-1)
140
MSA (ng m-3)
138
3
-21
δ13CWSOC (‰)
42
4
(a) WSOC
0
(d) Temp.
Rainfall
300
20 200
10
100
0 -10
Rainfall (mm)
-3 WSOC ( µgC m )
44
40
4
Temperature (oC)
Latitude (oN)
46
0
6/1 7/1 8/1 9/1 10/1 11/112/1 1/1 2/1 3/1 4/1 5/1 6/1 7/1 8/1 9/1 10/1 11/1 12/1
approximately 2 h. WSOC was extracted from the decarbonated filters in 20 ml of Milli-Q water, using the same method as described above for measuring the WSOC concentration. The extracted samples were concentrated by rotary evaporation, and 40 µl of each sample were transferred to be absorbed onto 10 mg of pre-combusted Chromosorb in a pre-cleaned tin cup. The δ 13 CWSOC was then measured using an elemental analyzer (EA) (NA 1500, Carlo Erba, Milan, Italy) interfaced to an isotope ratio mass spectrometer (Finnigan MAT Delta Plus, Thermo Finnigan, San Jose, CA, USA) (Kawamura et al., 2004). The recoveries of WSOC using chemical standards (oxalic acid and Suwannee River fulvic acid) and ambient aerosols after the analytical steps were 90 % and 82 %, respectively. We also determined the concentrations of BSOA tracers for α-/β-pinene (3-methyl-1,2,3-butanetricarboxylic acid; 3MBTCA, 3-hydroxyglutaric acid; 3-HGA, pinic acid, and pinonic acid) and those for isoprene (2-methylerythritol and 2-methylthreitol). In addition, sucrose and trehalose were identified as possible tracers for PBAPs. Briefly, a filter cut was extracted with dichloromethane/methanol and the COOH and -OH functional groups in the extracted samples were converted to TMS esters and TMS ethers, respectively. The TMS derivatives were then analyzed for the above compounds using a gas chromatograph (HP GC6890N, HewlettPackard, Palo Alto, CA, USA) equipped with a fused silica capillary column (DB-5MS, Agilent Technologies, Santa Clara, CA, USA) and coupled to a mass spectrometer (5973 MSD, Agilent Technologies, Santa Clara, CA, USA) (Fu et al., 2009). www.atmos-chem-phys.net/12/1367/2012/
Date (2009)
Date (2010)
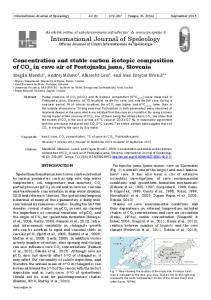
Fig. 2. Temporal variations of (a) WSOC, (b) δ 13 CWSOC (red solid squares) and NEE (blue dots), (c) MSA, and (d) ambient temperature and rainfall near the ground surface at a boreal forest site during the period June 2009–December 2010. The red solid circles in (a), (c), and (d) indicate average monthly values. Negative values of NEE in (b) indicate uptake of CO2 by the forest ecosystem.
For determination of inorganic ions, another filter cut was extracted with Milli-Q water. The total extract was filtrated through a membrane disc filter, and major anions and cations as well as MSA were determined using a Metrohm ion chromatograph (Model 761 compact IC; Metrohm, Herisau, Switzerland) (Miyazaki et al., 2009). 2.3
Net ecosystem exchange of CO2
Besides the aerosol measurements, we derived the net CO2 exchange between the forest ecosystem and the atmosphere (net ecosystem exchange, NEE) to characterize the carbon content in the aerosols in terms of forest biological activity. NEE is defined as the sum of the eddy covariance fluxes at 28.5 m height above the canopy and the change in CO2 storage in the volume from the ground to the height of the eddy covariance system. The eddy-covariance fluxes were obtained in a flux tower using a three-dimensional (3-D) sonic anemothermometer and an infrared CO2 /H2 O analyzer (Li6262; LiCor, Lincoln, NE, USA) (Nakai et al., 2003). To quantify the storage of CO2 below the altitude level of the Atmos. Chem. Phys., 12, 1367–1376, 2012
Fig.
1370
Y. Miyazaki et al.: Seasonal variations of WSOC in a deciduous forest
eddy measurement, vertical profiles of CO2 concentrations were measured at five altitude levels (2.7, 10.5, 16.3, 20.1, and 29.6 m above the ground surface) via sampling inlets mounted on the tower. Inside a shelter at the bottom of the tower, the sample air from each altitude was introduced into the CO2 /H2 O analyzer by rotation using an automatically controlled solenoid valve manifold. In the present study, an upward CO2 flux is considered to be positive, which means that a negative NEE value indicates net uptake of CO2 by the forest ecosystem. Further details of the NEE derived here are given elsewhere (Nakai et al., 2003).
3 3.1
Results and discussion Temporal variations of WSOC and δ 13 CWSOC
Figure 2a and b show the time series of WSOC concentrations and δ 13 CWSOC near the forest floor over an 18-month period. The WSOC concentrations peaked in early summer (May–June) and autumn (September–October), with averages of 2.9±1.5 µgC m−3 and 1.7±0.6 µgC m−3 , respectively. To our knowledge, this is the first report on a full annual cycle of WSOC and δ 13 CWSOC in forest aerosols. The δ 13 CWSOC exhibited a pronounced seasonal cycle, with higher ratios during December–April and lower ratios during June–September. The average δ 13 CWSOC in summer was −25.6±0.7 ‰, which is within the range (between −25 and −27 ‰) of standard compounds for biogenic tracers (cispinonic acid and sucrose) and of ambient WSOC aerosols mostly of contemporary biogenic C3 plant origin (Kirillova et al., 2010). The δ 13 CWSOC value is also similar to those of plant wax n-alcohols and n-acids in aerosols largely influenced by the temperate North American biosphere (Conte and Weber, 2002). Although δ 13 CWSOC alone cannot differentiate between primary and secondary WSOC in our data, the results indicate a dominant input of precursor molecules from C3 plants to WSOC from May to October, as generally expected in boreal forest. On the basis of the seasonal cycle of the δ 13 CWSOC , the period during which the highest WSOC concentrations were obtained can be characterized as the growing season for forest vegetation at this site. It should be noted that some anthropogenic sources have δ 13 C values similar to those of C3 plants in aerosols (e.g., Widory et al., 2006). However, an insignificant contribution of anthropogenic sources to the observed aerosols in the growing season is suggested by the substantially low concentrations of anthropogenic tracers (such as hopanes some of which were not detetcted). Moreover, the predominant local wind direction and speed in this season indicated that the sampled aerosols originated mostly from the forested area, as discussed in Sect. 2.1. The low concentrations of anthropogenic tracers together with the local wind data support the idea that the δ 13 C values in the growing season are Atmos. Chem. Phys., 12, 1367–1376, 2012
attributable mostly to C3 plants, rather than anthropogenic sources. Figure 2b also presents the time series of NEE together with δ 13 CWSOC . In 2010, uptake of CO2 due to photosynthesis by the forest ecosystem began in May and increased (corresponding to negative values of NEE) rapidly to a maximum from late June through July. The estimated respiration by the forest ecosystem increased after the disappearance of snow cover in April (data not shown). The seasonal cycle of δ 13 CWSOC closely followed that of NEE (r 2 = 0.44). Even though NEE can be interpreted as whole-ecosystem CO2 uptake and may not be fully comparable to our δ 13 CWSOC , the covariant temporal trends of δ 13 CWSOC and NEE suggest that δ 13 CWSOC was closely linked to the CO2 uptake by forest biological activity at this site. This indicates that the aerosols collected here may be representative of the studied forest area. Notably, the seasonal variation of MSA also showed a maximum during May and July (Fig. 2c). Possible sources of this MSA maximum will be discussed later in Sect. 3.3. 3.2
3.2.1
Source apportionment of WSOC using positive matrix factorization Source profiles
To better understand the seasonal changes in the contribution of possible sources to the observed WSOC, positive matrix factorization (PMF) (Paatero and Tapper, 1994) was applied. PMF can be used to identify underlying covariance among chemical parameters. The PMF analysis was performed for the collected samples using tracer compounds for BSOA, PBAP, and other biologically derived tracer compounds as well as inorganic species. The analysis resulted in five interpretable factors, which were characterized by the enrichment of each tracer compound and reproduced more than 92 % of the measured WSOC. Figure 3 shows composition profiles for the five factors resolved by PMF. Factor 1 was dominated by 2methylerythritol (i.e., 86 % of 2-methylerythritol is in Factor 1) and 2-methylthreitol (87 %), both of which are isoprene-SOA tracers (Claeys et al., 2004). Factor 2 was characterized by 3-HGA (49 %) (Claeys et al., 2007), pinic acid (38 %) (e.g., Yu et al., 1999), and 3-MBTCA (34 %) (Szmigielski et al., 2007), indicating that WSOC was significantly influenced by α-/β-pinene SOA. On the basis of these characteristics of each source profile, Factors 1 and 2 are referred to here as “isoprene-SOA-rich WSOC” and “α/β-pinene-SOA-rich WSOC”, respectively. Factor 3 was dominated by sucrose (89 %), whereas Factor 4 was characterized by trehalose (57 %). Saccharides have recently been proposed as unique molecular tracers for PBAPs such as spores, pollens, and fungi (e.g., Medeiros et al., 2006). Sucrose is an important primary saccharide of pollen grains (Pacini, 2000). On the other hand, trehalose is www.atmos-chem-phys.net/12/1367/2012/
Fig. 3 Y. Miyazaki et al.: Seasonal variations of WSOC in a deciduous forest
-3
Factor 2
(α-/β-pinene-SOA-rich)
60 40 20 0 80
Factor 3
(Sucrose- rich)
60 40 20 0 80
Factor 4
(Trehalose-rich)
60
1
F3 F5
F2 F1
0
Winter
0 80
F4 2
Autumn
20
Winter -Spring
40
Midsummer
WSOC (µgC m )
Fraction of species apportioned to factor (%)
3
Factor 1
(Isoprene -SOA-rich)
60
Early summer
80
1371
40 20 0 80
Fig. 4. Estimated relative contributions of different sources to WSOC concentrations resolved by PMF in each season. Open circles indicate the average concentrations of the measured WSOC.
Factor 5
60 (Sea salt + Anthropogenic) 40
+
NH4 Hopanes
Mg2+ 2+ Ca NO3nssSO42-
MSA + Na Cl
2-methylerythritol 3-HGA Pinonic acid Pinic acid 3-MBTCA Sucrose Trehalose Levoglucosan
0
WSOC 2-methylthreitol
20
Fig. 3. Five compositional WSOC source factors isolated by PMF.
known to be a fungal metabolite as well as a stress protectant for the soil microbial community, and has been proposed as F3 a marker compound for fungitive dust from biologically active surface soils (Rogge et al., 2007). Factors 3 and 4 are difficult to convincingly F2attribute to a specific source, given F5 the possibility that these saccharides originated from either PBAPs or other biologically derived sources such as resuspended soil dust and associated biota (e.g., Graham et al., 2003). However, each factor showed different contributions to WSOC in terms of seasonal characteristics, as discussed below. Thus, these two source factors are labeled here as “sucrose-rich WSOC” and “trehalose-rich WSOC,” respectively. Factor 5 showed enhanced contributions of both Na+ and anthropogenic tracers (e.g., hopanes), which could be a mixture of sea salt and anthropogenic aerosols transported from upwind regions. 3.2.2
Relative contributions of each factor to WSOC
Figure 4 shows the seasonal changes in the contribution of each factor to WSOC as resolved by PMF. Average concentrations and ratios of each parameter are also summarized in Table 1. In early summer, α-/β-pinene-SOA-rich www.atmos-chem-phys.net/12/1367/2012/
Factor 2 accounted for 36 % of WSOC, whereas isopreneSOA-rich Factor 1 contributed only 4 %. Factor 2 was also a significant contributor to WSOC in autumn (35 %), as expected from the peaks of α-/β-pinene SOA tracers in the two seasonal categories (Table 1). Among the measured α-/βpinene SOA tracers, 3-HGA showed the highest concentrations (2.1–9.3 ng m−3 ) throughout the study period, followed by pinic acid. Kourtchev et al. (2009) also reported that 3-HGA showed the highest concentrations (with a median value of 16.8 ng m−3 ) among the α-/β-pinene SOA tracers for PM2.5 aerosols collected at a mixed coniferous/deciduous forest site in K-puszta, Hungary, during summer 2003. Conversely, Factor 3 contributed 35 % of WSOC in early spring but was not apparent in autumn. The sucrose peak obtained in early summer (Table 1) is generally in good agreement with previous reports of the spring/early summer maxima of sucrose at boreal forests and rural sites (e.g., Medeiros et al., 2006; Jia et al., 2010). The large fraction of sucroserich Factor 3 suggests that pollen or pollen fragment sources contributed significantly to WSOC in this season. Trehaloserich Factor 4 accounted for 24 % and 50 % of WSOC in early summer and autumn, respectively. This implies that biologically derived sources such as resuspended soil dust and associated biota contributed to WSOC in early summer and autumn. In fact, the trehalose concentration showed positive correlations with the concentrations of arabitol (r 2 = 0.55) and mannitol (r 2 = 0.77), which are major fungal polyols in many green algal lichens (Lewis and Smith, 1967; Dahlman et al., 2003) and are well-known constituents of bacteria, fungi, and lower plants (Bieleski, 1982). The result supports the idea that fungal spores and fragments are the primary source of trehalose. The relative enhancement of WSOC in Atmos. Chem. Phys., 12, 1367–1376, 2012
1372
Y. Miyazaki et al.: Seasonal variations of WSOC in a deciduous forest
Table 1. Averages with standard deviations of each parameter near the forest floor in each season during 2010.
WSOC (µgC m−3 ) δ 13 CWSOC (‰) MSA (ng m−3 ) α-/β-Pinene SOA (ng m−3 ) 3-HGAa pinic acid 3-MBTCAb pinonic acid Isoprene SOA (ng m−3 ) 2-methylerythritol 2-methylthreitol Sucrose (ng m−3 ) Trehalose (ng m−3 ) −3 nss-SO2− 4 (µg m ) Ambient Temperature (◦ C)
Jan–Apr (Winter–Spring)
May–Jun (Early Summer)
Jul–Aug (Summer)
Sep–Oct (Autumn)
Nov–Dec (Winter)
1.0±0.3 −21.9±0.7 30±8
2.9±1.5 −24.0±0.8 64±15
1.5±0.4 −25.6±0.7 52±23
1.7±0.6 −24.7±0.8 30±7
1.2±0.4 −22.6±0.1 27±12
2.1±0.9 1.6±0.5 0.1±0.2 0.2±0.1
9.3±2.0 4.4±1.2 1.1±0.3 0.4±0.2
8.7±2.8 4.0±1.0 1.3±0.5 0.6±0.2
9.1±4.9 5.2±1.8 1.3±0.7 0.6±0.2
3.4±2.8 2.6±1.3 0.4±0.4 0.5±0.4
0.1±0.1 0.1±0.1 25.0±53.9 0.7±0.3 3.3±1.2 −1.7 ± 4.4
3.9±3.8 1.6±1.4 176.5±220.1 173.4±84 4.6±2.0 14.1±4.7
24.8±14.1 6.7±3.1 2.8±2.1 128.5±93.0 3.8±2.0 21.8±2.0
16.2±12.3 4.0±4.3 3.2±1.6 188.3±122.0 2.5±1.6 14.0±5.5
0.2±0.1 0.1±0.1 1.0±0.4 1.7±1.2 3.0±0.6 1.5±4.6
a 3-HGA: 3-hydroxyglutaric acid. b 3-MBTCA: 3-methyl-1,2,3-butanetricarboxylic acid.
autumn was likely due to enhanced contributions from microbially degraded materials during the period of leaf senescence and decay in this season (Nakai et al., 2003). Given that Factors 3 and 4 are both associated with the PBAPs fractions of WSOC, PBAPs can account for 57 % and 50 % of the WSOC peaks in the two seasons, respectively. In summary, the present results indicate that at this forest site, the SOA formations associated mainly with α-/β-pinene oxidation and the primary emissions from biological sources contribute almost equally to the peak of WSOC in TSP in the growing season of early summer as well as in autumn. The isoprene-SOA-rich factor (Factor 1) had different seasonality, with peaks in midsummer (July-August) accounting for 40 % of WSOC. This seasonal pattern is mainly attributable to the fact that isoprene originates only from photosynthetic tissues (i.e., shoots of ground vegetation) (Guenther et al., 2006); emissions are typically highest in midsummer (Aaltonen et al., 2011), when photosynthesis becomes most active. Note that the average WSOC was relatively low in July both in 2009 and 2010, even though the δ 13 CWSOC values indicate a dominant contribution of precursor molecules from C3 plants and intense photochemical activity. This may have been partly caused by an enhanced scavenging of aerosols because relatively large amounts of rainfall (>200 mm month−1 ) were recorded (Fig. 2d). Nevertheless, the PMF analysis indicates that biogenic SOA production (46 % from isoprene SOA and 54 % from α-/βpinene SOA) was the dominant source of WSOC in TSP in the midsummer period.
Atmos. Chem. Phys., 12, 1367–1376, 2012
3.3
Possible sources of MSA
As described in Sect. 3.1, MSA exhibited a distinct seasonal variation with maximum values during May and July as shown in Fig. 2c. The concentrations of MSA (9–95 ng m−3 ) are similar to the ranges reported in previous studies (∼10– 100 ng m−3 ) in marine aerosols (e.g., Ayers and Gras, 1991). The increase in the MSA concentrations may have been due to either enhanced contributions of marine air masses advectively transported from the sea or the oxidation of terrestrial biogenic DMS (Lamb et al., 1987). In fact, emissions of sulfur gases (DMS, H2 S, and CS2 ) have been reported for plant canopies (deciduous trees and pines) (Andreae et al., 1990) and mollisol and histisol soil (Lamb et al., 1987). Fig. 5 shows vertical profiles of several parameters within the forest canopy in summer, autumn, and winter. The difference in the MSA at two heights is statistically significant in summer and autumn (Fig. 5a): the concentration was higher near the forest floor (42±16 ng m−3 ) than at the 15-m level (30±15 ng m−3 ) throughout these seasons. The vertical gradient of MSA indicates an upward mass flux. Similar vertical profiles were also found for WSOC in summer and autumn (Fig. 5b). In contrast, MSA showed an anti-correlation with Na+ during summer and autumn, with enhanced concentrations occurring in the two seasons when δ 13 CWSOC decreased (Fig. 5c) near the ground. Moreover, according to the analysis of the local wind analysis, the majority of the observed aerosols in summer and autumn were likely influenced by emissions from major forested regions rather than marine sources, as shown in Fig. 1. In combination, these findings indicate that the enhanced concentrations of MSA in summer were most likely due to production from DMS www.atmos-chem-phys.net/12/1367/2012/
Fig. 5
Y. Miyazaki et al.: Seasonal variations of WSOC in a deciduous forest (a)
(b)
Altitude (m)
15
(c)
(d)
15
15
15
Autumn 10
10
10
5
5
Summer
10
1373
Winter 5 0
5
0
50
MSA (ng m-3)
0
0
1
2
-3 WSOC ( µ gC m )
0
-26
-24
-22
δ13CWSOC (‰)
0
0
5
10
3-hydroxyglutaric acid -3 (ng m )
Fig. 5. Vertical profiles of (a) MSA, (b) WSOC, (c) δ 13 CWSOC , and (d) 3-hydroxyglutaric acid (HGA) in summer (June–August 2010), autumn (September–November 2010), and winter (December 2010) at the study site. Values shown are averages with standard deviations at two heights. Note that the vertical profiles are not necessarily linear.
that originated from the forest floor rather than transport of MSA from oceanic regions. 3.4
Implications for WSOC production near the forest floor
Negative vertical gradients were also found for the α-/βpinene SOA tracers determined here (e.g., 3-HGA shown in Fig. 5d) both in summer and autumn. The average concentrations of 3-HGA were about two times higher near the forest floor than at the 15-m level in the two seasons. Aaltonen et al. (2011) recently reported that BVOC emissions from a boreal forest, mostly consisting of monoterpenes, also peaked in early summer and autumn. They attributed the seasonal variations to changes in the amount and types of litter, soil microbial activity, and physiological stages of plants, pointing out that the boreal forest floor can be a significant source of BVOC. Furthermore, MSA showed a statistically significant correlation with 3-HGA (r 2 = 0.50) and 3-MBTCA (r 2 = 0.55) in our data. The result indicates that the canopy floor in a boreal forest is likely a significant source of WSOC in summer and autumn. It should be noted that turbulent exchange of air between the forest and the atmosphere above can partly cause the lower concentrations of WSOC and the other tracers at the 15-m level. However, the vertical gradient of δ 13 CWSOC was insignificant (Fig. 5c) in the two seasons as well as in winter. Moreover, several samples taken only at night, when the forest and the air above the canopy would be decoupled, also showed the significant vertical gradient of WSOC (data not shown). It is also noted that trapping of WSOC beneath the canopy, which is significant mainly at night (e.g., Holzinger et al., 2005), can partly explain the negative vertical gradient. However, the time scale for each sample in our study is on the order of a week. Our data show averaged vertical profiles of WSOC including the data during the day when WSOC might be vertically well-mixed within the canopy. In addition, even when the vertical gradients of δ 13 CWSOC and potential temwww.atmos-chem-phys.net/12/1367/2012/
perature were insignificant (i.e., when vertical mixing was likely significant within the canopy), the vertical gradients of α-/β-pinene tracers and WSOC remained significant. These results support possible sources near the forest floor. More data including both BSOA tracers and VOCs near the forest floor over a time scale of a few years are needed to discuss the representativeness of the data at this site in future study. In addition to the source strength, photochemical activity is also an important factor to control the concentrations of secondarily formed WSOC. Zhang et al. (2010) recently found an Arrhenius-type correlation between the 3-MBTCA concentration and inverse temperature with a temperature range of 275–300 K based on ambient aerosol samples in central Europe. They suggested that the temperature dependence of 3-MBTCA is largely due to enhanced photochemical production by hydroxyl radicals (OH), indicating that 3-MBTCA can be used as a tracer for chemical aging of BSOA by OH. Considering that 3-MBTCA is formed by OH-initiated oxidation of cis-pinonic acid (PA) (Szmigielski et al., 2007), the 3-MBTCA/PA ratio can be an indicator of photochemical aging of BSOA. In our samples, the 3MBTCA/PA ratio was highest in early summer (2.59) compared with other seasons (0.72–2.38) (Table 1). This result implies that photochemical activity as well as intense emissions of BVOC from the forest floor can contribute to an increase in WSOC concentrations in early summer. 3.5
Possible sources of WSOC in winter
In winter, Factor 5, in which a mixture of sea salt and anthropogenic aerosols dominated, was a major contributor to WSOC (∼56–83 %). This is consistent with the δ 13 CWSOC , which exhibited higher values (−21.9±0.7 ‰) from December through April, similar to a typical δ 13 C range of OC in seawater and in marine aerosols (−20 ‰ to −22 ‰) (Turekian et al., 2003; Miyazaki et al., 2011). Additionally, the local wind direction supports that the air mass was influenced by the upwind marine region during this period Atmos. Chem. Phys., 12, 1367–1376, 2012
1374
Y. Miyazaki et al.: Seasonal variations of WSOC in a deciduous forest
(Fig. 1). These results indicate a predominant contribution of marine aerosols from an upwind oceanic region during this period. Note that an effect of some minor isotopic fractionation on δ 13 CWSOC cannot be ruled out a priori. This process may occur during oxidation of VOCs and partitioning of WSOC to the aerosol phase (Fisseha et al., 2009). However, reported isotopic effects on δ 13 C during aerosol formation and reactions relevant to δ 13 CWSOC are on the order of 0– 2 ‰ (e.g., Rudolph et al., 2003; Widory, 2006; Fisseha et al., 2009), which is lower than the difference in the δ 13 CWSOC between summer and winter (1 ∼4 ‰). Therefore, such processes would not have significantly affected the source apportionment ability of δ 13 CWSOC in this study. The vertical gradients of WSOC in winter were fairly weak compared to those in other seasons, likely due to the snow coverage from mid-December until March at the site. In boreal forest soils, lower temperature and snow cover in winter may suppress, but not completely halt, microbial activity (K¨ahk¨onen et al., 2001). The current results imply that the forest floor (ground vegetation and/or soil) acts as a significant source of WSOC within the forest canopy. 4
Conclusions
This paper presents the seasonal changes in biogenic WSOC in the canopy of a deciduous forest based on the aerosol samples collected in 2009–2010. The δ 13 CWSOC in aerosols exhibited a distinct seasonal cycle, with depleted ratios from June through September (−25.5±0.5 ‰). The δ 13 CWSOC in summer and autumn is within that reported for contemporary biogenic C3 plant origin, indicating a dominant input of precursor molecules from C3 plant ecosystems to WSOC. The seasonal cycle of δ 13 CWSOC corresponds to that of the CO2 uptake by the forest ecosystem from the atmosphere, indicating that δ 13 CWSOC reflected the degree of biological activity at this forest site. The WSOC concentrations showed peaks in early summer and autumn. PMF analysis indicated that factors in which BSOA (mostly α-/β-pinene SOA) dominated (∼40 %) and PBAPs dominated (∼57 %) made similar contributions to the maximum WSOC near the forest floor in early summer. The findings suggest that the growing season of forest vegetation is important for both primary and secondary formation of WSOC in a deciduous forest. In contrast, the PMF analysis indicated that biogenic SOA production was the dominant source of WSOC in midsummer. We found that MSA concentrations were also highest in early summer, with a distinct vertical gradient. Together with the similar vertical gradients of WSOC and δ 13 CWSOC as well as the α-/β-pinene SOA tracers, our results imply that the forest floor, including ground vegetation and soil, is a significant source of WSOC in TSP within a forest canopy.
Atmos. Chem. Phys., 12, 1367–1376, 2012
Acknowledgements. We thank J. Jung and S. Yoshida for their help in the aerosol sampling. This research was supported by grants-inaid for scientific research from the Ministry of Education, Culture, Sports, Science and Technology (MEXT) and the Environment Research and Technology Development Fund (B-0903) of the Ministry of the Environment, Japan. Edited by: A. Kiendler-Scharr
References Aaltonen, H., Pumpanen, J., Pihlatie, M., Hakola, H., Hell´en, H., Kulmala, L., Vesala, T., and B¨ack, J.: Boreal pine forest floor biogenic volatile organic compound emissions peak in early summer and autumn, Agr. Forest Meteorol., 151, 682–691, 2011. Andreae, M. O., Berresheim, H., Bingemer, H., Jacob, D. J., Lewis, B. L., Li, S.-M., and Talbot, R. W.: The atmospheric sulfur cycle over the Amazon Basin: 2. Wet season, J. Geophys. Res., 95, 16813–16824, 1990. Ayers, G. P. and Gras, J. L.: Seasonal relationship between cloud condensation nuclei and aerosol methanesulphonate in marine air, Nature, 353, 834–835, 1991. Bieleski, R. L.: Sugar alcohols, in: Encyclopedia of Plant Physiology, volume 13A, Plant Carbohydrates, volume I, Intracellular Carbohydrates, edited by: Loewis, A. and Tanner, W., SpringerVerlag, Berlin, Germany, 158–170, 1982. Bonan, G.: Forests and climate change: Forcings, feedbacks, and the climate benefits of forests, Science, 320, 1444–1449, 2008. Cachier, H., Buat-M´enard, M. P., Fontugne, M., and Chesselet, R.: Long-range transport of continentally-derived particulate carbon in the marine atmosphere: Evidence from stable carbon isotope studies, Tellus B, 38, 161–177, 1986. Cavalli, F., Facchini, M. C., Decesari, S., Emblico, L., Mircea, M., Jensen, N. R., and Fuzzi, S.: Size-segregated aerosol chemical composition at a boreal site in southern Finland, during the QUEST project, Atmos. Chem. Phys., 6, 993–1002, doi:10.5194/acp-6-993-2006, 2006. Claeys, M., Graham, B., Vas, G., Wang,W., Vermeylen, R., Pashynska, V., Cafmeyer, J., Guyon, P., Andreae, M. O., Artaxo, P., and Maenhaut, W.: Formation of secondary organic aerosols through photooxidation of isoprene, Science, 303, 1173–1176, 2004. Claeys, M., Szmigielski, R., Kourtchev, I., Van der Veken, P., Vermeylen, R., Maenhaut, W., Jaoui, M., Kleindienst, T. E., Lewandowski, M., Offenberg, J. H., and Edney, E. O.: Hydroxydicarboxylic acids: novel markers for secondary organic aerosol from the photooxidation of α-pinene, Environ. Sci. Technol., 41, 1628–1634, 2007. Conte, M. H. and Weber, J. C.: Plant biomarkers in aerosols record isotopic discrimination of terrestrial photosynthesis, Nature, 417, 639–641, 2002. Dahlman, L., Persson, J., N¨asholm, T., Palmqvist, K.: Carbon and nitrogen distribution in the green algal lichens Hypogymnia physodes and Platismatia glauca in relation to nutrient supply, Planta, 217, 41–48, 2003. Fisseha, R., Saurer, M., J¨aggi, M., Siegwolf, R., T., W., Dommen, J., Szidat, S., Samburova, V., and Baltensperger, U.: Determination of primary and secondary sources of organic acids and carbonaceous aerosols using stable carbon isotopes, Atmos. Environ., 43, 431–437, 2009.
www.atmos-chem-phys.net/12/1367/2012/
Y. Miyazaki et al.: Seasonal variations of WSOC in a deciduous forest Fu, P, Kawamura, K., Chen, J., and Barrie, L.: Isoprene, monoterpene, and sesquiterpene oxidation products in the high Arctic aerosols during late winter to early summer, Environ. Sci. Technol., 43, 4022–4028, 2009. Gelencs´er, A.: Carbonaceous aerosol, Atmospheric and oceanographic sciences library, 30, Springer, p. 350, 2004. Graham, B., Guyon, P., Taylor, P. E., Artaxo, P., Maenhaut, W., Glovsky, M. M., Flagan, R. C., and Andreae, M. O.: Organic compounds present in the natural Amazonian aerosol: Characterization by gas chromatography–mass spectrometry, J. Geophys. Res., 108, 4766, doi:10.1029/2003JD003990, 2003. Greco, S. and Baldocchi, D. D.: Seasonal variations of CO2 and water vapor exchange rates over a temperate deciduous forest, Global Change Biol., 2, 183–198, 1996. Guenther, A., Karl, T., Harley, P., Wiedinmyer, C., Palmer, P. I., and Geron, C.: Estimates of global terrestrial isoprene emissions using MEGAN (Model of Emissions of Gases and Aerosols from Nature), Atmos. Chem. Phys., 6, 3181–3210, doi:10.5194/acp-63181-2006, 2006. Hallquist, M., Wenger, J. C., Baltensperger, U., Rudich, Y., Simpson, D., Claeys, M., Dommen, J., Donahue, N. M., George, C., Goldstein, A. H., Hamilton, J. F., Herrmann, H., Hoffmann, T., Iinuma, Y., Jang, M., Jenkin, M. E., Jimenez, J. L., KiendlerScharr, A., Maenhaut, W., McFiggans, G., Mentel, T. F., Monod, A., Pr´evˆot, A. S. H., Seinfeld, J. H., Surratt, J. D., Szmigielski, R., and Wildt, J.: The formation, properties and impact of secondary organic aerosol: current and emerging issues, Atmos. Chem. Phys., 9, 5155–5236, doi:10.5194/acp-9-5155-2009, 2009. Holzinger, R., Lee, A., Paw U., K. T., and Goldstein, A. H.: Observations of oxidation products above a forest imply biogenic emissions of very reactive compounds, Atmos. Chem. Phys., 5, 67–75, doi:10.5194/acp-5-67-2005, 2005. Jia, Y., Clements, A. L., and Fraser, M. P.: Saccharide composition in atmospheric particulate matter in the southwest US and estimates of source contributions, J. Aerosol Sci., 41, 62–73, 2010. K¨ahk¨onen, M. A., Wittmann, C., Kurola, J., Ilvesniemi, H., and Salkinoja-Salonen, M. S.: Microbial activity of boreal forest soil in a cold climate, Boreal Environ. Res., 6, 19–28, 2001. Kavouras, I. G., Mihalopoulos, N., and Stephanou, E. G.: Formation of atmospheric particles from organic acids produced by forests, Nature, 395, 683–686, 1998. Kawamura, K., Kobayashi, M., Tsubonuma, N., Mochida, M., Watanabe, T., and Lee, M.: Organic and inorganic compositions of marine aerosols from East Asia: Seasonal variations of water soluble dicarboxylic acids, major ions, total carbon and nitrogen, and stable C and N isotopic composition, in: Geochemical Investigation in Earth and Space Science, A Tribute to Issac R. Kaplan, 9th edn., The Geochemical Society, edited by: Hill, R. J., Leventhal, J., Aizenshtat, Z., Baedecker, M. J., Claypool, G., Eganhouse, R., Goldhaber, M., and Peters, K., 243–265, 2004. Kirillova, E. N., Sheesley, R. J., Andersson, A., and Gustafsson, ¨ Natural abundance 13 C and 14 C analysis of water-soluble orO: ganic carbon in atmospheric aerosols, Anal. Chem., 82, 7973– 7978, 2010. Kourtchev, I., Copolovici, L., Claeys, M., and Maenhaut, W.: Characterization of aerosols at a forested site in central Europe, Environ. Sci. Technol., 43, 4665–4671, 2009. Kulmala, M., Suni, T., Lehtinen, K. E. J., Dal Maso, M., Boy,
www.atmos-chem-phys.net/12/1367/2012/
1375
¨ Aalto, P., Keronen, P., Hakola, H., M., Reissell, A., Rannik, U., B¨ack, J., Hoffmann, T., Vesala, T., and Hari, P.: A new feedback mechanism linking forests, aerosols, and climate, Atmos. Chem. Phys., 4, 557–562, doi:10.5194/acp-4-557-2004, 2004. Lamb, B., Westberg, H., Allwine, G., Bamesberger, L., and Guenther, A.: Measurement of biogenic sulfur emissions from soils and vegetation: application of dynamic enclosure methods with natusch filter and GC/FPD analysis, J. Atmos. Chem., 5, 469491, 1987. Lewis, D. H. and Smith, D. C.: Sugar alcohols (polyols) in fungi and green plants: 1. Distribution, physiology and metabolism, New Phytol., 66, 143–184, 1967. Luk´acs, H., Gelencs´er, A., Hoffer, A., Kiss, G., Horv´ath, K., and Harty´ani, Z: Quantitative assessment of organosulfates in sizesegregated rural fine aerosol, Atmos. Chem. Phys., 9, 231–238, doi:10.5194/acp-9-231-2009, 2009. Mahowald, N.: Aerosol indirect effect on biogeochemical cycles and climate, Science, 334, 794–796, 2011. Medeiros, P. M., Conte, M. H., Weber, J. C., and Simoneit, B. R. T.: Sugars as source indicators of biogenic organic carbon in aerosols collected above the Howland Experimental Forest, Maine, Atmos. Environ., 40, 1694–1705, 2006. Miyazaki, Y., Aggarwal, S. G., Singh, K., Gupta, P. K., and Kawamura, K.: Dicarboxylic acids and water-soluble organic carbon in aerosols in New Delhi, India, in winter: Characteristics and formation processes, J. Geophys. Res., 114, D19206, doi:10.1029/2009JD011790, 2009. Miyazaki, Y., Kawamura, K., Jung, J., Furutani, H., and Uematsu, M.: Latitudinal distributions of organic nitrogen and organic carbon in marine aerosols over the western North Pacific, Atmos. Chem. Phys., 11, 3037–3049, doi:10.5194/acp-11-3037-2011, 2011. Nakai, Y., Kitamura, K., Suzuki, S., and Abe, S.:Year-long carbon dioxide exchange above a broadleaf deciduous forest in Sapporo, Northern Japan, Tellus, 55B, 305–312, 2003. Paatero, P. and Tapper, U.: Positive matrix factorization: a nonnegative factor model with optimal utilization of error estimates of data values, Environmetrics, 5, 111–126, 1994. Pacini, E.: From anther and pollen ripening to pollen presentation, Plant Syst. Evol., 222, 19-43, 2000. Pe˜nuelas, J. and Staudt, M.: BVOCs and global change, Trends Plant Sci., 15, 133–144, 2010. Rogge, W. F., Medeiros, P. M., and Simoneit, B. R. T.: Organic marker compounds in surface soils of crop fields from the San Joaquin Valley fugitive dust characterization study, Atmos. Environ., 41, 8183–8204, 2007. Rudolph, J., Anderson, R. S., Czapiewski, K. V., Czuba, E., Ernst, D., Gillespie, T., Huang, L., Rigby, C., and Thompson, A. E.: The stable carbon isotope ratio of biogenic emissions of isoprene and the potential use of stable isotope ratio measurements to study photochemical processing of isoprene in the atmosphere, J. Atmos. Chem., 44, 39–55, 2003. Szmigielski, R., Surratt, J. D., G´omez-Gonz´alez, Y., Van der Veken, P., Kourtchev, I., Vermeylen, R., Blockhuys, F., Jaoui, M., Kleindienst, T. E., Lewandowski, M., Offenberg, J. H., Edney, E. O., Seinfeld, J. H., Maenhaut, W., and Claeys, M.: 3-methyl1,2,3-butanetricarboxylic acid: An atmospheric tracer for terpene secondary organic aerosol, Geophys. Res. Lett., 34, L24811, doi:10.1029/2007GL031338, 2007.
Atmos. Chem. Phys., 12, 1367–1376, 2012
1376
Y. Miyazaki et al.: Seasonal variations of WSOC in a deciduous forest
Tunved, P., Hansson, H.-C., Kerminen, V.-M., Str¨om, J., Dal Maso, M., Lihavainen, H., Viisanen, Y., Aalto, P. P., Komppula, M., and Kulmala, M.: High natural aerosol loading over boreal forests, Science, 312, 261–263, 2006. Turekian, V. C., Macko, S. A., and Keene, W. C.: Concentrations, isotopic compositions, and sources of size-resolved, particulate organic carbon and oxalate in near-surface marine air at Bermuda during spring, J. Geophys. Res., 108, 4157, doi:10.1029/2002JD002053, 2003. Widory, D.: Combustibles, fuels and their combustion products: A view through carbon isotopes, Combust. Theory Model., 10, 831–841, 2006.
Atmos. Chem. Phys., 12, 1367–1376, 2012
Yu, J., Cocker III, D. R., Griffin, R. J., Flagan, R. C., and Seinfeld, J. H.: Gasphase ozone oxidation of monoterpenes: Gaseous and particulate products, J. Atmos. Chem., 34, 207–258, 1999. Zhang, Y., Y., M¨uller, L., Winterhalter, R., Moortgat, G. K., Hoffmann, T., and P¨oschl, U.: Seasonal cycle and temperature dependence of pinene oxidation products, dicarboxylic acids and nitrophenols in fine and coarse air particulate matter, Atmos. Chem. Phys., 10, 7859–7873, doi:10.5194/acp-10-7859-2010, 2010.
www.atmos-chem-phys.net/12/1367/2012/