Saharan dust: Results from the Dust Outflow and Deposition to the ... [1] North African dust is important for climate through its direct radiative effect on solar and.
Click Here
JOURNAL OF GEOPHYSICAL RESEARCH, VOL. 113, D14S05, doi:10.1029/2007JD009606, 2008
for
Full Article
Seasonal variations of the physical and optical characteristics of Saharan dust: Results from the Dust Outflow and Deposition to the Ocean (DODO) experiment C. L. McConnell,1 E. J. Highwood,1 H. Coe,2 P. Formenti,3 B. Anderson,4 S. Osborne,5 S. Nava,6 K. Desboeufs,3 G. Chen,4 and M. A. J. Harrison5 Received 15 November 2007; revised 20 March 2008; accepted 24 April 2008; published 28 June 2008.
[1] North African dust is important for climate through its direct radiative effect on solar and
terrestrial radiation and its role in the biogeochemical system. The Dust Outflow and Deposition to the Ocean project (DODO) aimed to characterize the physical and optical properties of airborne North African dust in two seasons and to use these observations to constrain model simulations, with the ultimate aim of being able to quantify the deposition of iron to the North Atlantic Ocean. The in situ properties of dust from airborne campaigns measured during February and August 2006, based at Dakar, Senegal, are presented here. Average values of the single scattering albedo (0.99, 0.98), mass specific extinction (0.85 m2 g�1, 1.14 m2 g�1), asymmetry parameter (0.68, 0.68), and refractive index (1.53–0.0005i, 1.53–0.0014i) for the accumulation mode were found to differ by varying degrees between the dry and wet season, respectively. It is hypothesized that these differences are due to different source regions and transport processes which also differ between the DODO campaigns. Elemental ratios of Ca/Al were found to differ between the dry and wet season (1.1 and 0.5, respectively). Differences in vertical profiles are found between seasons and between land and ocean locations and reflect the different dynamics of the seasons. Using measurements of the coarse mode size distribution and illustrative Mie calculations, the optical properties are found to be very sensitive to the presence and amount of coarse mode of mineral dust, and the importance of accurate measurements of the coarse mode of dust is highlighted. Citation: McConnell, C. L., E. J. Highwood, H. Coe, P. Formenti, B. Anderson, S. Osborne, S. Nava, K. Desboeufs, G. Chen, and M. A. J. Harrison (2008), Seasonal variations of the physical and optical characteristics of Saharan dust: Results from the Dust Outflow and Deposition to the Ocean (DODO) experiment, J. Geophys. Res., 113, D14S05, doi:10.1029/2007JD009606.
1. Introduction [2] Mineral dust is an important species in the Earth’s atmosphere. Picked up from the surface around the globe, the majority of this dust is a natural aerosol although models suggest that 5 – 7% of the global dust loading is anthropogenic in origin [Tegen et al., 2004] and this may be between 0 and 15% in the North African region [Yoshioka et al., 2005]. Activities such as land use change and overgrazing increase the dust available for uplift [e.g., Tegen and Fung, 1995]. Dust is lifted from land surfaces across the globe, but Saharan mineral dust accounts for an annual source of 400– 700 Tg a�1 [Washington et al., 2003], a large proportion of the total. Dust is emitted from sources within North Africa, 1
Department of Meteorology, University of Reading, Reading, UK. School of Earth, Atmosphere and Environmental Science, University of Manchester, Manchester, UK. 3 LISA, CNRS, Universite´s Paris 12 et Paris 7, Cre´teil, France. 4 NASA Langley Research Center, Hampton, Virginia, USA. 5 Met Office, Exeter, UK. 6 National Institute of Nuclear Physics, Florence, Italy. 2
Copyright 2008 by the American Geophysical Union. 0148-0227/08/2007JD009606$09.00
of which the Sahara forms the major part [e.g., Woodward, 2001], and can be advected across the Atlantic toward the southeast USA and South America [Prospero, 1999; Formenti et al., 2001; Reid et al., 2003]. Some of this dust advection occurs during Africa-wide outbreaks [e.g., Slingo et al., 2006]; there has been somewhat less focus on the properties of airborne dust during less extreme outbreaks and throughout the year. [3] The most direct way in which mineral dust can influence global climate is by scattering and absorbing radiation, affecting both regional and global energy balance. Mineral dust, perhaps most interestingly of all aerosols, can affect both solar and terrestrial radiation. In the shortwave part of the spectrum, dust scatters radiation back to space but depending on the albedo of the underlying surface it can either increase (over ocean) or make little difference (over desert) to the total albedo. The impact in the longwave depends crucially on the surface temperature and the altitude of the dust layer. Radiation from the ground is absorbed in the dust layer and reemitted back toward the ground thereby potentially increasing the surface temperature. For dust over the ocean surface the result is usually dominated by the solar effect, however for dust at altitude
D14S05
1 of 19
D14S05
MCCONNELL ET AL.: SEASONAL VARIATIONS OF SAHARAN DUST
over a desert surface the longwave effect can dominate the flux changes at the top of the atmosphere. It is also important to distinguish between the effect at the top of the atmosphere and at the surface, since the direct solar radiation reaching the ground can be dramatically reduced while the diffuse component increases substantially during major dust outbreaks. The impact of dust on longwave radiation is important for satellite retrievals of sea surface temperature and the spectral signal within the 8– 12 mm region can be used to infer the mineralogy of the dust [Highwood et al., 2003]. The Saharan Dust Experiment (SHADE) surveyed the optical properties and radiative impact of Saharan dust during September 2000 [Haywood et al., 2003]. Magnitudes for the local direct radiative effect over the ocean reached as much as �130 W m�2 at the top of the atmosphere for an individual dust storm. Slingo et al. [2006] also showed top of atmosphere shortwave flux increased by 100 W m�2 while the surface downward solar flux at Niamey reduced by as much as 300 W m�2 for the dust storm of early March 2006. These are considerable perturbations to the local energy balance. In terms of global climate change, the IPCC 2007 report considered the anthropogenic dust top of the atmosphere radiative forcing to range between �0.3 W m�2 and +0.1 W m�2 [Forster et al., 2007]. Key parameters for determining the radiative effect of dust include the single scattering albedo (w0), the asymmetry parameter (g), and the mass specific extinction (kext), which are dependent on size distribution and refractive index. [4] Other impacts of North African dust on the climate system are less well studied and quantified. Even small concentrations of mineral dust are thought to be able to significantly affect cold cloud properties including the radiative properties of cirrus, dehydration of the tropopause and convective cloud dynamics. Laboratory studies show that dust might act as ice nucleii and have shown dust to exhibit complex primary and secondary nucleation at varying ice supersaturations [e.g., Field et al., 2006]. Accordingly, DeMott et al. [2003] results from CRYSTAL-FACE (The Cirrus Regional Study of Tropical Anvils and Cirrus Layers – Florida Area Cirrus Experiment) showed that Saharan dust plumes were associated with elevated ice nuclei counts across Florida, while Richardson et al. [2007] showed a proportionately high contribution to ice nuclei by mineral dust over the continental USA. It has also been hypothesized that dust may provide a surface for heterogeneous chemical reactions to take place. For example, ozone can be destroyed on pure calcium carbonate particles. Salisbury et al. [2006] found that daily cycles and absolute concentrations of some oxygenated species were different during dust storms in the MINATROC (Mineral dust aerosol and tropospheric chemistry) project. However, it was impossible to unequivocally attribute this to heterogeneous reactions on the dust itself. [5] Airborne North African dust is of great interest to marine biologists. Much of the dust leaving the western coast of Africa is deposited in the Atlantic Ocean where it provides a flux of nutrients such as iron and phosphorus to the ocean. This deposition stimulates nitrogen fixation and relieves iron limitation of phytoplankton activity. The resulting growth of marine biological organisms results in ocean sequestration of carbon dioxide and fluxes of hal-
D14S05
ocarbons, alkylnitrate and DMS between atmosphere and ocean. Iron from mineral dust therefore plays an indirect route in carbon and other mass fluxes between atmosphere and ocean [Jickells et al., 2005]. [6] One climate impact which has received much interest in recent years has been the role of North African dust in tropical storm and hurricane formation. Jones et al. [2004] reported indirect observations of modification of African Easterly Waves (the forerunner disturbances of some hurricanes) via the radiative impacts of dust. Evan et al. [2006] showed that mean dust coverage as measured by satellites and tropical cyclone activity are strongly correlated over the North Atlantic. Particular highlight has been given to the contrasting North Atlantic hurricane seasons of 2005 (active, fewer dust outbreaks than normal) and 2006 (less active, more dust outbreaks than normal). However, this is not in itself enough to suggest that the dust is directly influencing the tropical cyclones. Various mechanisms including the radiative impact on sea surface temperature, and alteration of vertical shear regions, and the entrainment of dust laden dry air have been proposed. However, none of these have been shown to be a predominant governor of cyclone activity, with N. Atlantic sea surface temperatures playing a very large role in determining the cyclone activity. The correlation between dust and cyclone activity may stem from them both being driven by a third party, for example Sahelian rainfall in the previous season. [7] Because of the significant destructive capacity of hurricanes, there is considerable interest in summer season dust uplift and transport. The mechanisms of dust production and uplift are rather different between dry season (November to March) and the wet season (July– September). During the dry season, dust in western Africa is mainly found at low altitudes and its uplift often results from activity along trailing cold fronts associated with systems passing through the Mediterranean region. Orography and local advection effects then magnify the dust uplift [e.g., Slingo et al., 2006]. The winter season, therefore, tends to produce very dramatic dust outbreaks that last a few days. During the wet season, dust tends to be uplifted in convection over the African continent and then transported westward at altitude. The different transport mechanisms between seasons could have an effect on the size distribution of dust, and hence result in different optical properties. The vertical profiles of dust also vary substantially between seasons [e.g., Karyampudi et al., 1999; Zhu et al., 2007], which will also have an impact on the radiative effect. [8] In addition, there is evidence that the African source regions may differ throughout the year [e.g., Schepanski et al., 2007; Washington et al., 2003; Chiapello et al., 1997]. The Bode´le´ Depression in Chad is perhaps the major source region for mineral dust, but there are significant sources in the western Sahara which also influence the dust flowing toward the Atlantic. As shown by Washington and Todd [2005] and Engelstaedter and Washington [2007], there is evidence that the uplift from these different sources responds to different parts of the atmospheric dynamics. In the case of the Bode´le´ Depression the presence and strength of the low-level jet is important, while dust production from the western Sahara seems to be more closely related to the degree of low-level convergence. Differing mineralogy at these sources may influence the
2 of 19
D14S05
MCCONNELL ET AL.: SEASONAL VARIATIONS OF SAHARAN DUST
Figure 1. DODO campaign meteorology from ERA operational analyses. The 1000 mbar geopotential (m2 s�1) for (a) DODO1 period 7– 17 February 2006, (b) DODO1 period 14– 16 February 2006, and (c) DODO2 period 22– 28 August 2006. The 850 mbar wind vectors for (d) DODO1 period 7 – 17 February 2006, (e) DODO1 period 14– 16 February 2006, and (e) DODO2 period 22 –28 August 2006. Locations of Dakar and Nouakchott are indicated by a star and circle, respectively.
3 of 19
D14S05
D14S05
MCCONNELL ET AL.: SEASONAL VARIATIONS OF SAHARAN DUST
D14S05
Figure 2. Flight tracks for (a) DODO1 and (b) DODO2 campaigns based in Dakar, Senegal.
composition of mineral dust [Claquin et al., 1999; Formenti et al., 2008] and its microphysics, and thus the radiative impact [e.g., Todd et al., 2007; Highwood et al., 2003]. [9] It is important to remember that dust is not the only aerosol that affects sub Saharan Africa. During the dry season, considerable biomass burning activity along the coast of the Gulf of Guinea and convection there results in a ubiquitous layer of biomass burning aerosol at higher altitudes above the dust, and this complicates retrieval of aerosol properties from AERONET (Aerosol Robotic Network) and satellite methods as biomass burning aerosol has quite different properties to dust. The interaction of dust and
biomass during January – February 2006 was examined in detail by the Dust and Biomass Experiment (DABEX) of the UK Met Office [Johnson et al., 2008; J. M. Haywood et al., Overview of the Dust and Biomass Burning Experiment and African Monsoon Multidisciplinary Analysis Special Observing Period-0, submitted to Journal of Geophysical Research, 2008] and parallels between dust and biomass found during that campaign and those reported here are discussed by Osborne et al. [2008]. [10] In terms of understanding the climate impact of dust throughout the year there is clearly a need to establish whether the likely seasonal differences in uplift and trans-
4 of 19
MCCONNELL ET AL.: SEASONAL VARIATIONS OF SAHARAN DUST
D14S05
D14S05
Table 1. Summary of Flights During DODO1 and DODO2 Campaigns Flight Number DODO1 B169
Date
Takeoff, Landing
Operating Area
7 Feb 2006
112228, 141834
over ocean south of Dakar
B170 B171 (B172)
11 Feb 2006 12 Feb 2006
095447, 145335 084911, 130656
over ocean south of Dakar north of Nouadhibou, over ocean
B173
14 Feb 2006
094953, 143615
B174
15 Feb 2006
094400, 131354
B175
16 Feb 2006
085143, 141538
coastal region, Dakar-Nouackchott over sea north and south of Dakar land regions in northern Mauritania
DODO2 B237
22 Aug 2006
135855, 182401
over ocean northwest of Dakar
B238
23 Aug 2006
130025, 173152
land regions in northern Mauritania
B239
24 Aug 2006
095141, 135328
B240
24 Aug 2006
151619, 193645
over ocean, between and to the south of Dakar and Sal over ocean northwest of Dakar
B241
25 Aug 2006
135438, 183200
B242
28 Aug 2006
110243, 153338
over ocean between Nouadhibou and Dakar over ocean northwest of Dakar
port processes lead to any discernible influence in radiative or microphysical properties. From a biogeochemical point of view, these may also lead to differences in nutrient deposition to the ocean. The Dust Outflow and Deposition to the Ocean (DODO) project was conceived to use aircraft measurements of airborne dust to constrain model estimates of dust deposition to the ocean. The microphysical and optical properties and the vertical structure the dust that were measured during the two major fieldwork periods in Africa are described in this paper. Section 2 describes the airborne campaigns and instrumentation in more detail, including measurement correction procedures based on an intercomparison flight with the NASA DC-8 aircraft. The characteristics of dust found during both DODO campaigns are described in sections 3, 4 and 5. The paper ends with discussion in section 6. The project is ongoing, and model results will be reported elsewhere in due course.
2. Methodology 2.1. DODO Meteorology and Flight Patterns [11] In order to characterize airborne North African dust and outflow to the ocean in both the dry season and the wet season, two airborne campaigns based in Dakar, Senegal, were organized. DODO1 took place during the dry season from 7 to 16 February 2006, while DODO2 followed in the wet season from 22 to 28 August. Both campaigns were also associated with the AMMA (African Monsoon Multidisciplinary Analysis) project [Redelsperger et al., 2006]. The 1000 mbar geopotential and 850 mbar wind vectors are shown in Figure 1, for the whole of DODO1 (Figures 1a and 1d), the last 3 days of DODO1 (Figures 1b and 1e), and the whole of DODO2 (Figures 1c and 1f). During DODO1 the flow changed substantially: for the first week the flow was dominated by an anomalous low-pressure system
Objectives instrument shake-down, biomass burning aerosol sampling in situ biomass aerosol collection model validation for major dust storm to north of region; aircraft lost science power during refuel therefore no data available from B172 in situ sampling of local dust source in situ sampling of dust advected over ocean and biomass aerosol in situ sampling and radiometric measurements over land, moderate dust loading in situ and radiation measurements of dust over ocean off Senegal/Mauritania coast sample heavy dust loadings over land in Mauritania forecast by dust models and visible in satellite imagery in situ measurements of dust forecast over ocean to south of Dakar-Sal area mapping of in situ dust to north of Dakar for comparison with B239 intercomparison flight with NASA DC8 and high-level calibration of radiometers in situ and radiation measurements of moderate dust loadings to north of Dakar
located over the Canary Islands, shown by the geopotential lines in Figure 1a, which resulted in little offshore flow in the region between Dakar and Nouakchott (Figure 1d). This is contrary to the predominantly easterly flow that would be expected from climatology [e.g., Hastenrath, 1991] and no dust was sampled during this period. The flow changed during the three final days of the campaign, becoming more climatological with northerly/northeasterly flow to the north of Dakar (Figures 1b and 1e), advecting light dust loadings toward Dakar. During this period the dust samples discussed in this study were collected on flights B173, B174 and B175 (Figure 2a). This flow pattern is not reflected in the DODO1 averages (Figures 1a and 1d) because of its short time duration. To the south of Dakar the flow was offshore (see Figure 1d) giving rise to the advection of biomass aerosol (originating from southern West Africa) at midlevels in the troposphere, this being sampled during three of the six DODO1 flights which operated to the south of Dakar (see Figure 2a). [12] The geopotential in Figure 1c shows the Saharan heat low positioned over Algeria during DODO2. The wind vectors at 850 mbar suggest offshore flow to the north of Dakar, with a recirculation to the south of the region. However, it is important to note that these mean circulation patterns are a combination of flow patterns from a succession of African easterly waves that passed over Dakar during this time, bringing relatively large meridional excursions of alternately dry and moist airflow over Dakar. The six flights during DODO2 concentrated mainly on the ocean and land areas to the north of Dakar (Figure 2b), reflecting the largest likelihood of dust sampling. During DODO2, Dakar itself was frequently affected by clouds associated with Mesoscale Convective Systems which passed mainly to the south of the main operating area. A summary of the
5 of 19
D14S05
MCCONNELL ET AL.: SEASONAL VARIATIONS OF SAHARAN DUST
D14S05
Table 2. Summary of Aerosol-Related Instruments on Board the FAAM BAe146 Operated During the DODO Campaigns Type of Measurement Aerosol microphysics Aerosol optical properties
Instrument PMS PCASP, GRIMM OPC, DMT CDP TSI nephelometer, PSAP
Aerosol chemical composition
bulk filters, Aerodyne AMS, VACC
Trace gas chemistry
O3, CO
Thermodynamics
AVAPS
Size Range (Optically Equivalent Radius), Wavelengths, etc.
Comment
0.05 – 1.5 mm, 0.15 – 20 mm, 2.5 – 20 mm l = 0.45, 0.55, 0.7 mm; l = 0.567 mm 90-mm Nuclepore 0.4 mm pore size; quartz; Particle sizes 50 – 500 nm; temperature range 50 – 300°C, PCASP 0.05 – 1.5 mm
location, duration and nature of the flights in both DODO campaigns is given in Table 1. [13] In this study results are presented for aircraft maneuvers consisting of vertical profiles, measuring the vertical distribution of aerosol, and straight and level runs, measuring in situ aerosol for a duration of between 5 and 30 min at a constant altitude. Vertical profiles range from either ground level (in the case of takeoff or landing) or the aircraft’s minimum safe altitude of 50ft over sea or approximately 500ft over land, to above the aerosol layer. The aircraft flies at 110 m s�1 but ascends/descends at 5 m s�1 and therefore covers considerable horizontal distance during a profile, which means that the straight and level run data is valuable in terms of showing the horizontal variation. Most instruments on the BAe146 (including the nephelometer) sample at least 1Hz, giving good resolution of data in the vertical and horizontal. Straight and level runs will hereafter be referred to as ‘‘runs.’’ 2.2. BAe146 Instrumentation [14] The core instrumentation on the UK community Facility for Airborne Atmospheric Measurements (FAAM) BAe146 is described by Haywood et al. (submitted manuscript, 2008). Details of the most relevant instrumentation for aerosol and dust measurements are given in Table 2. Key instruments included the wing-mounted Passive Cavity Aerosol Spectrometer Probe (PCASP), TSI integrating nephelometer model 3563 and Radiance Research Particle Soot Absorption Photometer (PSAP) (corrected according to standard procedures as in the work by Bond et al. [1999]) in terms of aerosol microphysical and optical properties for the accumulation mode. [15] Bulk filters were used to collect samples of airborne dust. The aerosol sampling system used on board the BAe146 is identical to that previously used on board the UK Met Office C-130 and is described in detail by Andreae et al. [2000], who estimated the inlets to the filters to sample 35% of the coarse mode by mass. Aerosol particles were sampled by filtration onto two stacked filter units (SFUs) mounted in parallel. Each SFU can hold a maximum of three filters on sequential 47-mm diameter polyethylene supports, but only one stage was used during DODO. Samples were collected only during horizontal flight legs lasting not less than 20 – 30 min in order to guarantee sufficient loading of the filter samples. One SFU consisted of a Nucleopore filter (nominal pore size 0.4 mm) measuring the inorganic composition. The second SFU was used for measuring carbonaceous aerosols on one quartz filter.
particle scattering coefficient, particle absorption coefficient inorganics (elements and water soluble fraction), carbon (EC and OC), volatile and semivolatile aerosols, water and volatile material O3 and CO are sampled using online analyzers temperature, pressure, winds, GPS
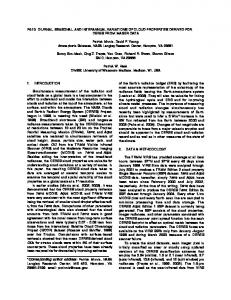
2.2.1. Nephelometer Corrections Using the DC-8 Intercomparison [16] During DODO2, the BAe146 flew a wing tip to wing tip comparison flight (B241) with the NASA DC-8. Flight B241 included 3 straight and level runs within the Saharan Air Layer over the Atlantic Ocean to the north of the Cape Verde Islands (see Figure 2b). This provided an opportunity to compare the nephelometers on board both aircraft. The BAe146 was operating a TSI 3563 nephelometer running from a Rosemount inlet, which has been estimated by Haywood et al. [2003] to have an upper limit for dust particles at around 3 mm in terms of optical diameter, although the true cutoff is not well defined. The DC-8 operated a TSI 3563 nephelometer behind the NASA LaRC type inlet. This inlet has been shown to give a 50% loss of dust particles above 3.6 mm aerodynamic diameter (giving an optically equivalent diameter of 2.0 mm [McNaughton et al., 2007]). [17] Figure 3 shows the scattering from the DC-8 and the BAe146 TSI nephelometers during one of the three straight and level runs from flight B241. In each case, both nephelometers measured dry scattering at low values of relative humidity and the data has been corrected as advised by Anderson and Ogren [1998]. Relative humidity during these runs varied between 52% to 69% and so no attempt
Figure 3. Nephelometer measurements of scattering in Mm�1 from intercomparison flight B241 (BAe146 run 2) at 2100 m within dust layer. Heavy lines are BAe146 measurements corrected according to Anderson and Ogren [1998]. Light lines are DC-8 TSI nephelometer data corrected similarly. Dotted lines are 450 nm, solid lines are 550 nm, and dashed lines are 700 nm.
6 of 19
MCCONNELL ET AL.: SEASONAL VARIATIONS OF SAHARAN DUST
D14S05
Table 3. Linear Pearson Correlation Coefficients (r) Between DC-8 and BAe146 Data During Three Wing Tip to Wing Tip Straight and Level Runs Within Dust Layers During DODO2 Flight B241 Channel
Run 1
Run 2
Run 3
0.45 mm 0.55 mm 0.70 mm
0.93 0.82 0.80
0.96 0.97 0.94
0.93 0.94 0.91
has been made to account for any hygroscopic growth, which is thought to be small for dust particles within this range of humidities [e.g., Li-Jones et al., 1998; Carrico et al., 2003] It is apparent that the two nephelometers are sampling similar variability in the aerosol layer (i.e., spatial variability) however there is a significant offset between the two instruments, with the BAe146 scattering being substantially lower than the DC-8. In addition, the 450 nm channel on the BAe146 nephelometer is reading relatively much lower than other frequencies compared to the DC-8. The ratio between DC-8 and BAe146 values is approximately 2.5 in each of the 3 runs. Table 3 shows the linear Pearson correlation coefficients (r) for scattering measured by the two systems at the three different wavelengths during the three different straight and level runs within dust. The average ratios of the DC-8 to BAe146 scattering across the three runs were 7.3, 2.36 and 2.4 at 450, 550 and 700 nm respectively. [18 ] The combined evidence of (1) high correlation between the two nephelometers at all wavelengths and in all three runs, (2) higher scattering measured by the DC-8 nephelometer by a factor of 2.5, and (3) underestimation of aerosol optical depth by the nephelometer and PSAP compared to AERONET by an average factor of 3.1 (see following paragraph), point to a fault with the BAe146 nephelometer, suggesting a sensitivity loss perhaps due to the high dust loadings experienced during an immediately preceding campaign where the nephelometer was not closely monitored and which may have resulted in the detectors becoming dirty. On the basis of the similar inlet cutoff diameters on the two aircraft and the large differences in scattering between the two nephelometers, it is thought unlikely that the differences in scattering are due to the DC-8 inlet having a greater passing efficiency. [19] It was therefore decided that for DODO2, the BAe146 nephelometer data would be scaled to agree with the DC-8 TSI data. A linear fit was used to fit the BAe146 data to the DC-8 data. The resulting corrections using the average fit parameters across all three runs for 450, 550 and 700 mm channels of the BAe146 scattering data are shown below. � � �1 ¼ 33:2 � 10�6 þ 7:3 � s450 s450 corr in m
ð1Þ
� � �1 ¼ 11:3 � 10�6 þ 2:36 � s550 s550 corr in m
ð2Þ
� � �1 ¼ 10:1 � 10�6 þ 2:4 � s700 s700 corr in m
ð3Þ
Note that a larger correction for blue wavelengths is required because of the very low scattering at blue
D14S05
wavelengths compared to red and green wavelengths. Figure 4 shows the effect of this correction for one of the straight and level runs, the triangles representing the correlation of the original BAe146 data with the DC-8 data, and the diamonds the improved correspondence when the fits in equations (1)– (3) above are applied. It should be noted that the uncertainty in passing efficiency of the BAe146 Rosemount inlet relative to the DC-8 LaRC type inlet results in a small amount of uncertainty in applying the scaling factor from the intercomparison flight B241 to the other DODO2 flights where the aerosol size distributions and optical properties may be different. [20] The underestimation of scattering by the BAe146 nephelometer can also be shown by comparing optical depths measured by the Dakar AERONET station at Mbour to those obtained by integrating the vertical profiles of scattering in the vicinity of the only AERONET station, according to the expression: Zz t 550 ¼ 0
s550 corr dz w550 0
ð4Þ
where w550 is the single scattering albedo calculated from a 0 horizontal run in a dust layer at an appropriate altitude. PSAP data is only used for straight and level runs when the flow rate has been manually set to 3 L per minute and integration of absorption measured by the PSAP during profiles is not possible as the flow rate is not recorded on the BAe146. The comparison of calculated AODs with those measured by AERONET is shown in Table 4. DODO1 profiles (assumed to be unaffected by the nephelometer issues, but still affected by any inlet losses) underestimate AOD compared to AERONET by a factor of 1.54 which is consistent with previous experience during SHADE [Haywood et al., 2003], this being attributed to loss of coarse mode particles in the instrument inlet. The DODO2 comparison using data corrected using the DC-8
Figure 4. Correlation plot of DC-8 and BAe146 nephelometer measurements from BAe146 runs 1 – 3 of flight B241. Triangles show BAe146 data with correction only according to Anderson and Ogren [1998]. Diamonds show BAe146 data corrected according to a linear fit against the DC-8 data at each of three wavelengths and averaged across all three runs. Heaviest symbols are 550 nm, and palest are 700 nm.
7 of 19
MCCONNELL ET AL.: SEASONAL VARIATIONS OF SAHARAN DUST
D14S05
D14S05
Table 4. Correction Factors Obtained From Comparing AERONET Optical Depths at Dakar With Integrated Extinction From Accumulation Mode Measurements During Aircraft Profiles at Dakar Flight DODO1 B168 B169 B171 B173 B174 B175 B175 Mean DODO2 B236 B237 B238 B238 B242 B242 Mean
Aircraft-Based Optical Depth t 550
AERONET Optical Depth at 550 nm t AERONET
P17 P1 P1 P1 P10 P1 P8
0.21 0.30 0.11 0.09 0.05 0.12 0.04
0.38 0.24 0.11 0.12 0.11 0.15 0.11
1.83 0.81 1.00 1.34 2.03 1.19 2.56 1.54
P10 P8 P1 P9 P1 P11/P12
0.33 0.61 0.38 0.42 0.18 0.27
0.23 0.64 0.68 0.48 0.42 0.29
0.71 1.06 1.80 1.16 2.30 1.08 1.35
Profile
data gives a similar underestimate, whereas using data not corrected in equation (2) the aerosol optical depth was underestimated by a factor of 3.1. [21] The variability of the underestimation of aerosol optical depth shown in Table 4 is assumed to be related to differing amounts of coarse mode aerosol being present, although some of the variation may be explained by discrepancies in inlet passing efficiency between the two aircraft which would result in a different scaling factor being required for different size distributions. As concerns hygroscopic growth, few estimates of hygroscopicity of Saharan dust exist, but it is likely that relative humidity effects are small. When dust is mixed with large amounts of other aerosols, humidity can be more important, but using the hygroscopic growth values for submicron Asian dust mixtures of Carrico et al. [2003] and biomass burning aerosol hygroscopic growth characteristics from Magi and Hobbs [2003] with our profiles resulted in AOD estimates far larger than those from AERONET. Therefore we do not account for hygroscopic growth here, but acknowledge that this could result in small increases in the calculation of AOD. The average distance between the mean profile location and the AERONET station varies between 29 and 254 km (mean of 114 km). Despite some of the profiles being further away from the AERONET station there is no correlation between distance to the AERONET station and the ratios of the AODs, so this is unlikely to be the main cause of differences in AOD. [22] The comparison of AERONET and aircraft-measured AODs points to a consistency between approaches and supports that the scaling of the BAe146 nephelometer to the DC-8 nephelometer. Further examination, on a flight by flight basis, of the nephelometer behavior during the AMMA airborne campaign immediately prior to the DODO2 campaign suggests that the instrument apparently developed a problem just before deployment in DODO2, a problem that we were not able to rectify in the field. Unfortunately it is not possible from these comparisons to ascertain precisely the problem with the BAe146 nephelometer during DODO2, although loss in the inlets of larger particles is certainly a contributing factor, and this is partly
C = t AERONET/t 550
responsible for the underestimation of AOD in both DODO campaigns. No further attempts were made to adjust the nephelometer scattering data for hygroscopic growth for the cases presented here, based on low relative humidity values during runs sampling dust (46% on average during the whole of DODO) and low expected hygroscopic growth rates for dust particles [e.g., Li-Jones et al., 1998; Carrico et al., 2003]. 2.2.2. Measurement of Size Distribution [23] The accumulation mode is measured by a wingmounted PCASP which measures particles sized between 0.05 and 1.5 mm optically equivalent radius. It is assumed to sample at 100% efficiency at all sizes because of the short sampling lines and relatively small maximum size. Errors in the PCASP-measured size distribution due to nonspherical particles [Osborne et al., 2008] are moderate compared to other sources of uncertainty affecting the optical properties presented here. [24] Measurements of the coarse mode size distribution are much less well defined than those for the accumulation mode [e.g., Reid et al., 2003], and measurement techniques on the FAAM BAe146 are less well validated. During DODO2 the coarse mode was measured by a Droplet Measurement Technology cloud droplet probe (CDP-100) (see Table 2) and by particle counting software used on scanning electron microscope (SEM) analysis images from filter samples (see Table 2). An internal optical probe was run but line losses prevented any meaningful numbers being used for the supermicron sizes. Limitations of each technique for measuring the coarse mode and the processing of the size distributions in order to allow comparisons are as follows: [25] 1. The CDP is mounted nonoptimally 10 cm away from the aircraft skin which resulted in some initial uncertainty in the sample volume as a function of particle size [Abel, 2007]. Subsequent comparisons with several cloud instruments, including FSSP-100, Johnson-Williams, Small Ice Detector and Nevzorov were used to determine the sample volume which showed a consistent behavior for droplet sizes below 20 mm radius [Abel, 2007]. On the basis of these comparisons the CDP number concentration for
8 of 19
D14S05
MCCONNELL ET AL.: SEASONAL VARIATIONS OF SAHARAN DUST
particles up to a radius of 20 mm has been adjusted by a factor of 0.35 to account for uncertainties in the sample volume. Above 20 mm radius the CDP has a shadowing effect due to its position on the aircraft and hence data from sizes larger than this has been discounted. The lower edge of the smallest CDP size bin is not well characterized and has also been discounted. To create a full size distribution the CDP size distribution has simply been joined onto the PCASP size distribution, and in most cases the transition from PCASP to CDP size distribution appears smooth. [26] 2. Filter samples were also used to obtain another estimate of the coarse mode size distribution. SEM analysis was performed at the Laboratoire Interuniversitaire des Syste`mes Atmospheriques (LISA) in Cre´teil, France. Particle counting software was used on SEM images of dust samples to obtain a size distribution (as described by Chou et al. [2008]). The smallest 4 size bins from the SEM size distribution were defined to be the same as the largest 4 bins from the PCASP, so that the PCASP and SEM size distributions overlap. The SEM number distribution was higher than that of the PCASP in the four overlapping bins and a scaling factor was necessary to match the two. The whole SEM size distribution was then scaled down accordingly. The SEM technique is a 2-D procedure which measures geometrical diameter, and may overestimate particle diameters if the dust particles are nonspherical. Thus the scaling down of the SEM size distribution can partly be interpreted as accounting for this overestimation of diameter, as well as a conversion from geometrical to optical diameter. Errors in the PCASP size distribution due to the refractive index and particle shape might also intervene as estimated by Osborne et al. [2008], but are not able to account for the difference between the SEM and PCASP size distributions. [27] Because of limitations with each technique we regard the various estimates of the coarse mode as a range of possibilities. 2.3. Dispersion Modeling Using NAME [28] To identify potential dust sources, investigations were undertaken using the UK Met Office Numerical Atmospheric-dispersion Modeling Environment (NAME). This is a Lagrangian particle model [Ryall and Maryon, 1998] in which emissions from pollutant sources are represented by parcels released into a model atmosphere driven by the meteorological fields from the Met Office’s numerical weather prediction model, the Unified Model [Cullen, 1993]. Each parcel carries the mass of one or more pollutant species and evolves by various physical and chemical processes during its lifespan. Although originally designed as an emergency response tool, NAME has subsequently been developed for a wide range of applications [e.g., Middleton et al., 2008; Gloster et al., 2007; Webster et al., 2007; Witham and Manning, 2007]. [29] In this work two approaches have been taken. First, to identify potential source regions of the dust measured during DODO, NAME was initiated at a location where the aircraft had measured dust, and the air mass was run backward in time over 5 days in order to identify locations where the air mass had been in the lower boundary layer, within 200 m of the surface. While this technique highlights regions from which the air originated, it does not indicate
D14S05
where dust was actually uplifted. In recent years a dust scheme has been developed [Athanassiadou et al., 2006] in which dust is dynamically lifted, transported and deposited on the basis of the surface properties and meteorology. Therefore second, the relative contribution to the dust observed by the aircraft originating from different parts of the model domain have been identified by altering the extent of the modeled domain.
3. Identification of Aerosol Types [30] The dominant aerosol types encountered during DODO were mineral dust (both campaigns) and biomass burning aerosols (DODO1 only). In order to isolate runs where the accumulation mode was dominated by dust only, we first removed runs where scattering from the nephelometer at 450 nm was greater than 550 nm and 700 nm, indicating the presence of biomass burning aerosol. For the remaining runs, we then looked at data from the aerosol mass spectrometer (AMS) and at the analysis of filter samples using scanning electron microscopy (SEM) and transmission electron microscopy (TEM). Analysis of air mass origin (see section 5) was not part of the selection criteria for dust cases, but the results support the hypothesis that the selected cases were dust aerosol, having sources in the Sahara and Sahel. However, we note that air mass origins do indicate that dust sampled during flights B173 and B174 had air mass origins around Spain and Portugal as well as in the northwest Sahara. [31] Analysis of filter samples does not suggest any mixing of aerosol types or the presence of other components. Submicron mass loadings of organics and sulfates for DODO1 were determined using AMS data [see Capes et al., 2008]. The dust cases described in this study have less than 15% of the submicron mass constituted by sulphates and organics, and can therefore be considered as dominated by dust in the accumulation mode, with the exception of run 3.1 in flight B174 where higher mass loadings of sulphates were found. On this basis, the aerosol samples presented are referred to as dust, on the assumption that mineral dust is almost certainly the dominant aerosol type and that mixing with other components is thought to be unlikely for the runs that have been selected.
4. Characteristics of Dust in DODO1 and DODO2 4.1. Vertical Profiles [32] Figure 5 shows the variety of vertical profiles of dust (and biomass burning aerosol) found during the DODO campaigns. In each case, the scattering coefficient at 550 nm, Angstrom exponent (calculated using the 550 and 700 mm channels of the nephelometer), and ozone mixing ratio are shown. Small or even negative Angstrom exponent values imply larger particles (more likely to be dust), while larger positive values suggest small particles (more likely to be biomass burning or anthropogenic aerosol). [33] Over land, close to the source, vertical profiles are quite similar for both the dry and wet season (Figures 5a and 5c), both showing a dust layer close to the surface. Figure 5a in the dry season (flight B175) shows a thick dust
9 of 19
D14S05
MCCONNELL ET AL.: SEASONAL VARIATIONS OF SAHARAN DUST
D14S05
Figure 5. Vertical profiles of corrected 550 nm scattering (Mm�1), ozone mixing ratio (ppbv) and 550 – 700 nm Angstrom exponent for (a) B175 profile 7 (Mauritania, dry season), (b) B174 profile 6 (over ocean, dry season), (c) B238 profile 3 (Mauritania, wet season), and (d) B237 profile 2 (over ocean, wet season).
layer from the surface extending to 3000 m with the largest scattering toward ground level. The wet season (Figure 5c, flight B238) shows a similar layer also extending to around 3000 m, but with peak scattering at around 1000 m. Above 3000 m low scattering values (