MA 700007—8/5/2008—15:54—RAMESHMU—299700—XML Model1 – pp. 1–7
Proceedings of the Institution of Civil Engineers Maritime Engineering 000 Month 2008 Issue MA0 Pages 1–7 doi: 10.1680/ Paper 700007 Received 20/03/2007 Accepted 18/04/2008 Keywords: coastal engineering/ management/sea defences
Uwe Dornbusch Coastal Processes Scientist, Mouchel Group, Haywards Heath, West Sussex, UK
Sediment transport through rock groynes on mixed beaches U. Dornbusch
FRGS
Rock or boulder groynes are an increasingly popular option for constructing groynes with the purpose of maintaining beach levels within the groyne compartment created. Due to the open blockwork nature of construction, rock groynes are permeable to water and sediment in contrast to either concrete or timber groynes. No data exists on the rate at which mixed sediment beach material penetrates through rock groynes, yet they are used as terminal features in groyne fields or are used to maintain discontinuities in coastal alignment. On the basis of the beach volumes, which were calculated from aerial photographs and ground surveys over different time intervals and covering more than 5 years, examples from two coast protection schemes in south-east England show that where the beach levels on either side of the rock groyne differ, the rate of throughput is almost constant and independent of wave approach. Measured rates of transport can reach up to 1$27 m3 per day. Throughput is a function of the gradient between the beaches on either side which is determined by the cross-sectional area between the two beach profiles. An exponential relationship between the differences in cross-sectional areas either side of the rock groyne and rate of throughput is proposed.
1. INTRODUCTION In recent decades, rock revetments and groynes have become increasingly popular in sea defence design, particularly in the UK.1 Rock groynes are particularly recommended for highenergy shingle beaches due to their energy-absorption potential, easy construction and maintenance; they are also recommended as terminal structures.2 Although it is acknowledged that rock groynes are potentially permeable to sediment,2,3 there is no information available concerning the rate of throughput and the conditions that determine this rate. In particular, if the groynes are constructed as terminal structures, the rate of throughput will determine the speed with which material is leaving the groyne field and thus the rate and cost at which it needs to be replaced. These considerations should be taken into account when designing a coast protection scheme as they will have an impact on the lifespan and maintenance costs of that scheme. 1.1. Study area The study area consists of the beaches at Rottingdean and Saltdean, which are located along the coast of south-east Maritime Engineering 000 Issue MA0
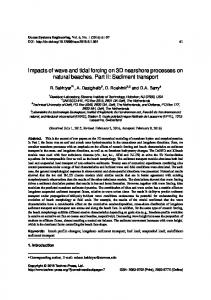
England, about 6 km east of Brighton (Fig. 1). The macrotidal coast with a spring tide range of 6$3 m4 is exposed to waves predominantly from south-westerly directions and are created in the western and central English Channel and eastern Atlantic. Maximum offshore wave heights recorded in the area exceed 6 m.5 The coast to the east of Brighton consists of chalk cliffs that are 30 to 40 m high and an intertidal chalk platform that is about 150 m wide (Fig. 2). At the end of the nineteenth century, a continuous narrow fringing beach is shown along the cliff toe on the first edition ‘One Inch’ Ordnance Survey map, but this beach subsequently disappeared in the twentieth century due to continued longshore drift and the disruption of the transport path following the installation of groynes updrift. Hanging dry valleys cut through the cliffs at Rottingdean and Saltdean, leading to lower foreshore levels and the formation of a slight embayment at Saltdean. To stop cliff erosion along this frontage6 a continuous seawall from Brighton to Saltdean has been maintained since the late 1930s with local protection in the form of groynes and toe protection at Rottingdean and Saltdean, dating back to the nineteenth century. Due to the low beach volumes and the gradual disintegration of the groynes, sea defences in the area received a major overhaul in the 1990s that included the beach recharge at Rottingdean and Saltdean. Based on grading curves of the dredged material used for the recharge and sediment samples collected from 0$2 to 0$6 m depth on S2 and S4 in 2004 (beaches are abbreviated to the initial of the location and the number as shown in Fig. 2), the beaches have a sand content of between 20 and 30% and a D50 of the beach material O 2 mm of between 13 and 19 mm.7 The schemes at Saltdean and Rottingdean are very similar in design using a mixture of large concrete and boulder groynes that were recharged with 103 000 and 110 000 m3 of mixed sand and shingle, respectively. The Rottingdean scheme was carried out in 1994 and the Saltdean scheme in 1996. The groynes at Rottingdean and Saltdean have crest levels of 6 m above Ordnance Datum (OD), or more than 2$5 m above mean high water springs. The rock groynes are approximately 25 m wide at the base and 5 m wide at the crest. They were countersunk into the platform by 1 m with a crest level of 6 m and side slopes of 1 in 2. The outer armour layer is approximately 3 m thick and made of 7–11 t rock while the core was built using 3–6 t rock. It is estimated that the achieved density of the structure is between 1$5 and 1$6 t mK3, which is equivalent to approximately 40% voids.
Sediment transport through rock groynes on mixed beaches
Dornbusch
1
MA 700007—8/5/2008—15:54—RAMESHMU—299700—XML Model1 – pp. 1–7
50
0
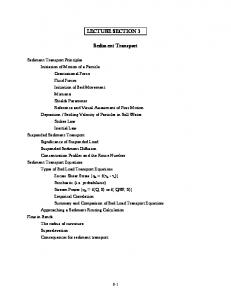
The groynes extend for 15 to 40 m seawards of the mixed beach toe ( junction between the steeper upper sand and gravel beach and the lower, almost flat intertidal sand cover or rock platform) at Rottingdean and for a minimum of 22 m at Saltdean (Fig. 2). Apart from the distance between the beach toe and the end of the groyne which would hamper transport around the groynes, there is no evidence in the field that would suggest that beach material rounds the groynes at the seaward end nor is there beach material visible in the voids near the ends of the groynes. This is also supported by the aerial photographs in Fig. 2 where bright white patches of shore platform can be seen along parts of the beach toe (e.g. R4, S1 and S2) that result from abrasive action of beach material. Such whitened areas are absent around the tip of the groynes. Only during storms coinciding with spring tides is a storm berm created that will reach slightly above the groyne crest level against the western side of the groynes. From material trapped on the entrenched walkway on top of the groyne between S4 and S5 on such occasions, the amount of material moved eastwards over the groynes is estimated to be less than 10 m3 a year during the observation period. Due to variations in coastal orientation followed by the seawall (Fig. 1), the groyne compartments were filled so that significant offsets of corresponding water lines exist between the updrift and downdrift sides of some of the groynes (Fig. 2).Beaches R5, S1 and S6 are open on one side, allowing material to leave or enter the beach depending on wave direction.
50 Km
South-east England
Brighton
Rottingdean Saltdean
200
0
200 400 600 800 m
Fig. 1. Location map of Rottingdean and Saltdean within southeast England. Inset shows the outline of seawalls and groynes and the relative position of the two sites. Boxes show the locations in Fig. 2
(a)
R1 R2 Water level contours
R5
R4
R3
HWS HWN MWL LWN
50
0
50
100
150
200 m
(b)
S1
S2
S3
Both schemes are unusual in their combination of concrete and rock groynes that have created virtually closed systems with almost no sediment passing over or around the groynes. Together with detailed topographic surveys undertaken using high-accuracy surveying techniques, they are therefore ideal to quantify volume changes within the groyne compartments and to assess the occurrence and magnitude of sediment transport through rock groynes.
S4 S5
S6
2. METHOD 2.1. Ground surveys
Fig. 2. Orthophotos of the coastal protection schemes at Rottingdean (a) and Saltdean (b) showing location and type of groynes, location of different beach compartments mentioned in the text and a selection of water level contours. Contours based on the final topographic survey for each beach. Orthophotos are based on a flight in May 2001 and have been kindly provided by the Environment Agency. HWS, ; HWN, ; MWL, ; LWN, 2
Maritime Engineering 000 Issue MA0
Topographic surveys were carried out using a Topconw RTK global positioning system (GPS) with the rover antenna mounted on a pole with a 0$3 m diameter wheel at the base. Points were recorded approximately every 0$3 to 0$5 m in autotopo mode along cross-shore transects that were spaced at 4 to 15 m intervals,
Sediment transport through rock groynes on mixed beaches
Dornbusch
MA 700007—8/5/2008—15:54—RAMESHMU—299700—XML Model1 – pp. 1–7
depending on the longshore variation of the beach topography. All surveys were carried out by the author, providing consistency in the topographic judgement for profile spacing. Points were recorded with horizontal and vertical precision generally better than G 0$015 m equivalent to capturing volume changes better than G 1$5 m3 per 100 m2, although surface roughness of the beach would result in a larger error. Points were imported into ArcVieww 3.2a and the beach surfaces were interpolated using triangulated irregular networks (TIN). To provide a better basis for analysis, the TINs were converted into grids with a cell size of 0$3 m. Nineteen topographic surveys were carried out on an almost monthly basis between July 2003 and January 2005 on Saltdean Beach7 with several of the surveys being carried out almost immediately after storms. An additional ground survey was carried out on 14 August 2006 on Saltdean Beach and one ground survey was carried out on 7 October 2006 at Rottingdean. 2.2. Photogrammetric survey Colour aerial photographs flown for the annual beach monitoring survey carried out by the UK Environment Agency on 5 May 2001 at a scale of 1 : 5000 were used for the photogrammetric analysis. The images were available at a scanned resolution of 21 mm, providing a ground resolution of approximately 0$2 m. Ground control points for the triangulation were collected with the same GPS system as used for ground surveys, using predominantly corners of features such as manhole covers that were aligned with the flight direction, producing very accurate mathematical models for the photogrammetry.8–10 Digital elevation models (DEM) were extracted from the stereo photos using PCIGeomaticaw 9.1 with a DEM ground resolution of 0$3 m. The DEMs were manually edited by interpolating holes within the DEM where the DEM extraction failed and exported into ArcVieww 3.2a. The comparison for areas that had not changed between 2001 and 2006 (areas at the back of the beach and areas of the promenade) provided a final elevation control for using the photogrammetry and topographic surveys to assess beach surface elevation changes. Using this adjustment, the beach elevation for the photogrammetry was within the order of G 0$05 m in comparison with the topographic survey.8,9 Beach volumes and differences between beach volumes for different surveys were calculated in two different ways. For the beaches at Saltdean the surface elevation grids for all topographic surveys were overlain in the GIS and for each cell the lowest elevation out of all surveys was determined. The surface composed of the lowest cell values for each surface cell was taken as the minimum surface and was used as the reference surface to calculate beach volume (surveyed beach surface minus minimum beach surface). The advantage of this method lies in the fact that the reference surface was not an arbitrary level (as, for example, K2 m OD) but took account of surveyed values and that the error associated with the elevation of the minimum surface was the same for all comparisons.7 As the minimum surface was based on the topographic surveys the volume of beaches that have gained over time could be negative for the photogrammetric survey in 2001; this was the case for Maritime Engineering 000 Issue MA0
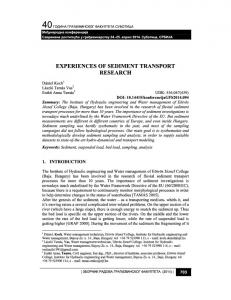
S2. In the case of the comparison between the photogrammetric survey and the last topographic survey in 2006, beach elevation surfaces were simply subtracted from each other within the GIS. Regardless of the method used, the beach area remained the same and included the whole beach between the groynes, from the seawall to the mixed beach toe. 3. RESULTS 3.1. Saltdean At Saltdean, results from ground surveys with different survey intervals were incorporated with results from the 2001 aerial survey, which in combination covered a period of more than 5$25 years (5 May 2001 to 14 August 2006). The results of the ground surveys covering 3 years (July 2003 to August 2006) and assessing also the changes in surface sediment cover have been published elsewhere.7 They were used here to provide an indication of the accuracy for the photogrammetric method and a comparison between the long- and short-term beach volume fluctuations. Based on the monthly ground surveys between July 2003 and January 2005, Fig. 3 shows that the beach volumes in individual groyne bays at Saltdean behaved quite differently. S4 was regarded as the reference beach because it is located between two large concrete groynes and no management intervention has been carried out. The volume fluctuations had a range of 366 m3 which equated to a maximum range of elevation changes of 0$06 m (Table 1). This was only twice the range of the GPS recording accuracy and indicates that the volume had not changed over more than 5 years, despite an apparent loss of 0$13 m3 per day based on a linear regression of the monthly surveys (Table 1). Values that were very similar to the extremes of the photogrammetric survey in 2001 and the ground survey in 2006 also occurred during the period of monthly surveys so that the connecting line between the end surveys is not representative of a trend; in fact the apparent inter-survey changes reflect the error associated with the survey and surface interpolation method. The volume variations shown in Fig. 3 and the correlation coefficient of R2 Z K0$214 for the regression therefore confirm that there was no long-term trend at S4. The low range in the volume variations also indicates that there was no measurable cross-shore exchange between the upper mixed sand and shingle beach and either the intertidal sandy foreshore or the sub-tidal area. Because S4 is representative for all groyne embayments at Rottingdean and Saltdean in its geometry and relationship to groyne layout, it can be postulated that beach volume in all other embayments should not have changed unless transport of beach material through a groyne or some other intervention had taken place. The latter was the case for S3, where repairs to the groyne extensions either side of the beach were carried out between March and May 2004. To provide protection to the foreshore next to the groynes and to allow better access for heavy plant, 1400 m3 of beach material from the upper part of the beach above mean high water was taken and placed alongside the groyne extensions onto the lower sand beach. Following the completion of the work, the material was left in position. Through natural movement, some of the material found its way onto the upper mixed beach again; however, some material appears to have been lost offshore as subsequent surveys
Sediment transport through rock groynes on mixed beaches
Dornbusch
3
MA 700007—8/5/2008—15:54—RAMESHMU—299700—XML Model1 – pp. 1–7
4000
Volume: m3
3000
regression) of beach material each day. S5 lost 1304 m3 or 0$29 m in average beach elevation with an average daily loss of 0$68 m3 (based on the end point surveys and the linear regression). S6 gained 341 m3 or 0$18 m3 to 0$20 m3 per day depending on the method of calculation.
Beach volume change S1 S2 S3 S4 S5 S6
2000
Finally, S1 showed the largest fluctuations between surveys 1000 and a long-term gain of 1552 m3. However, S1 was excluded from the regression analysis because it is only 0 constrained by a groyne on its Jan-01 Jan-02 Jan-03 Jan-04 Jan-05 Jan-06 Jan-07 eastern side and beach Fig. 3. Variation in beach volumes at Saltdean. Volumes are given in cubic metres above the minimum material is therefore able to surface that was created using the ground surveys only move in and out of the survey area. As the long-term longshore transport along this coast is eastward,11 any material show an average deficit of 300 m3 in comparison with the period that can leave the Rottingdean scheme will arrive at S1 and the before. Some material had also disappeared from the lower sandy beach is therefore set to remain stable or gain in the long term beach.7 The comparison between the photogrammetric survey although significant losses are likely to occur in the short term and the surveys prior to March 2004 as well as the comparison through drift reversal initiated by easterly waves. between the surveys after June 2004 and the final survey in August 2006 (Fig. 3) show that beach volumes have been stable within each of these periods supporting the findings for S4.
3.2. Rottingdean
In contrast, S2, S5 and S6 showed distinct long-term trends with constant rates as illustrated by the long-term and shortterm beach volumes. As individual surveys do have an inherent error attached to them, the rates of throughput were based on the linear regression through all surveys. However, to provide a comparison with Rottingdean, values based on the photogrammetric survey and the last topographic survey are also provided (Table 1). S2 gained 2068 m3, which represents a change of beach elevation spread over the entire active beach (beach area between the mixed beach toe and the crest of the highest storm berm) of 0$4 m. On average the beach gained between 1$07 m3 (end point surveys) and 1$12 m3 (linear
Table 1 shows the comparison between the beaches in 2001 and 2006. It can be assumed that the error for each of the two surveys was similar to those at Saltdean; the fact that only the endpoint surveys were available increases the error of the changes calculated between these surveys. Based on the total volume changes and the amount of surface elevation resulting from it, Table 1 shows that R2 and R3 have not changed whereas R1, R4 and R5 have either gained or lost material. R3 is constrained by a concrete groyne on the eastern side and a rock groyne on the western side and lost 82 m3 whereas R2, which is constrained by two rock groynes, showed a loss of 400 m3. This volume loss on R2 equated to a surface lowering of 0$06 m. Both the volume lost and the conversion into
Location
ID
Area : m2
Saltdean Saltdean Saltdean Saltdean Saltdean Saltdean Rottingdean Rottingdean Rottingdean Rottingdean Rottingdean
1 2 3 4 5 6 1 2 3 4 5
5738 5133 10 509 6620 4571 2754 6170 7264 6690 6824 1316
*
Volume change based on end surveys: m3 1552 2068 K479 K366 K1304 341 1640 K400 K82 K2507 K637
Elevation change based on end surveys: m 0$27 0$40 K0$05 K0$06 K0$29 0$12 0$27 K0$06 K0$01 K0$38 K0$48
Change based on end surveys: m3/day 0$80 1$07 K0$25 K0$19 K0$68 0$18 0$83 K0$20 K0$04 K1$27 K0$32
Change based on linear regression: m3/day * 1$12 * K0$13 K0$68 0$20
R2 of the linear regression * 0$965 * K0$214 0$903 0$849
Not calculated because of the non-linear behaviour of this beach due to management intervention (S3) or the ‘openness’ of the beach (S1).
Table 1. Summary of beach areas, changes in beach volume, resulting mean elevation change and average rate of volume change for beaches at Saltdean and Rottingdean between 5 May 2001 and 14 August 2006 (Saltdean) or 7 October 2006 (Rottingdean) 4
Maritime Engineering 000 Issue MA0
Sediment transport through rock groynes on mixed beaches
Dornbusch
MA 700007—8/5/2008—15:54—RAMESHMU—299700—XML Model1 – pp. 1–7
elevation change were almost the same as for S4, so that it can be assumed that this beach has also not changed. R1 gained 1640 m3, which is equivalent to a surface elevation increase of 0$27 m. R4 and R5 lost 2507 and 637 m3, respectively, which converts into elevation changes of 0$38 and 0$48 m. The beach to the west of R1 was not analysed because its behaviour is likely to be very similar to that of S1 and in addition an unquantified amount of beach material was removed in 2005 to assist construction of a protection scheme further west. 4. DISCUSSION Survey results for the beaches at Rottingdean and Saltdean show that beaches constrained by concrete groynes have not changed their volume whereas those between rock groynes have either remained stable or have changed. The high-resolution survey data from Saltdean suggest that this volume change was not event driven but appeared to occur at a steady rate. One condition likely to be responsible for the steady stream of beach material from one side of a rock groyne to another is the gradient introduced by the different beach levels on either side of the groyne, illustrated by the offset of the water lines in Fig. 2 and the examples of cross profiles next to the rock groynes in Fig. 4. The maximum difference in elevation either side of a rock groyne was found between R4 and R5, reaching almost 5 m (Fig. 4(b)) which equates to a slope of 1 in 4. Based on similar profiles for the other groynes at Rottingdean and the rock groynes at Saltdean, the difference in the cross-sectional area
between the two profiles either side of each groyne was calculated with a maximum of 233 m2 between R4 and R5 and a minimum of 8 m2 between R2 and R3 (Fig. 4). A high correlation exists between the rate of throughput per day and the cross-sectional area difference with R2 Z 0$952 using the rates based on the end surveys at Rottingdean and the regression values for Saltdean (Table 1) and 0$962 if the end survey values are used for both Rottingdean and Saltdean. The relationship is plotted in Fig. 5. Even though there are only five data points, an exponential relationship appears to fit the data better (R2 Z 0$960) than a linear regression (R2 Z 0$900). A non-linear relationship would also appear to be more appropriate considering that with an increasing cross-sectional difference area the resistance of the path through the rock groyne increases in two aspects: (a) the width of the groyne increases towards the base, thus lengthening the path; and (b) the path leads through the ‘finer’ core material of the groyne where voids are likely to be smaller than in the armour layer and thus slow down the flow. Considering Rottingdean and Saltdean together, R4, R5, S1 and S2 can be thought of as forming one sediment cell as the concrete groynes west of R4 and east of S2 can be assumed to be fixed boundaries. Rottingdean has lost 3144 m3 from R4 and R5 (east of the concrete groyne) whereas Saltdean has gained 3620 m3 on S1 and S2 (west of the concrete groyne). The difference is small and can be accounted for by variations in the amount of beach material that lies in front of the seawall
7 6 R2
Elevation: m OD
5
Groyne
4
R3
MHWS
3 2 1 0 –1 –2
Mixed beach toe
–3 0
25
50
75
100
Distance from seawall: m (a) 7 6 R4
Elevation: m OD
5
Groyne
4
R5
MHWS
3
Cross-sectional difference area
2 1 0 –1 –2
Mixed beach toe
–3 0
25
50
75
100
125
150
Distance from seawall: m (b)
Fig. 4. Examples of cross shore profiles either side of rock groynes. (a) Profiles of R2, R3 and the groyne separating the two beaches. (b) Profiles of R4, R5 and the groyne separating the two beaches. Profiles are based on the photogrammetrically derived surfaces created from the 2001 aerial photographs (no smoothing applied) and were drawn along the groyne crest line (groyne level) and 10–14 m either side (beach levels). MHWS, mean high water springs Maritime Engineering 000 Issue MA0
Sediment transport through rock groynes on mixed beaches
Dornbusch
5
MA 700007—8/5/2008—15:54—RAMESHMU—299700—XML Model1 – pp. 1–7
250 R 4-5
material from S2 appears to be the best option to address this developing shortage.
Cross profile area: m2
200
5. SUMMARY 150
S 1-2
100 S 5-6
50 R 1-2 R 2-3
0 0
0·5
1
1·5
3
Volume throughput: m /day
Fig. 5. Scatter plot between the rate of beach material throughput and the cross shore area difference between the profiles on either side of the rock groyne. Data label refers to location (S, Saltdean; R, Rottingdean) and the beach numbers either side of the groyne. Curve is the best fit regression y Z 10$581e2$4426x with R2 Z 0$952
between Rottingdean and Saltdean or the survey error (in comparison with the combined area of S1 and S2, the volume difference of 476 m3 would result in a surface elevation change of 0$044 m; compared with the combined area of R4, R5, S1 and S2 of 0$025 m). 3
Beach volumes in the order of 20 000 m for individual groyne compartments mean that annual losses or gains of up to 460 m3 per year are significant over the lifetime of an engineering scheme. In the case of S2 it could be expected that the gain would decrease with time as the beach level difference between S1 and S2 became smaller. However, because S1 is likely to continue gaining material from Rottingdean, the gains of S1 seem to almost counterbalance the losses into S2, so that the transfer rate is more likely to remain as it is.
A comparison between mixed beaches constrained by concrete or rock groynes has shown that while those between concrete groynes do not show any volume change through natural processes over a period of more than 5 years, those constrained by rock groynes can show significant changes. These volume changes are associated with a constant transport through the rock groyne when the beach surface elevation either side of the rock groyne differs. The relationship between the transport rate and difference in elevation expressed in the difference of the cross shore area between profiles next to the groynes is likely to be an exponential relationship due to the increased resistance encountered through the wider groyne section towards the bottom and the change of void size between the outer armour layer and the inner core. The design of the scheme with its mix of impermeable concrete groynes, permeable rock groynes and differential beach fill due to the coastal alignment did not seem to have taken the possibility and magnitude of beach material transport through rock groynes into account. Based on the knowledge about rock groyne permeability presented, it would seem possible to create coastal protection schemes that provide some constant and controlled through-flow through the scheme that could be beneficial to the coast downstream. ACKNOWLEDGEMENTS Data collection was carried out while the author was employed in the Interreg III project ‘Beaches at Risk’ at the University of Sussex. Aerial photographs were kindly provided by the Environment Agency and discussion of the scheme with the consulting engineers at Royal Haskoning is gratefully acknowledged. I would also like to thank the three referees for useful comments. The views expressed in this paper are those of the author alone.
REFERENCES The two most vulnerable beaches are R4 and S5 as these lie east of a concrete groyne and lose material through its eastern rock groyne. They are also the most vulnerable due to the shape and position of the seawall behind them. At R4, the seawall is offset landward by 32 m at a point that is 25 m east of the western groyne (Fig. 2) and whereas on the aerial photographs in 2001 the beach in front of this section reached up to the seawall, nearly 0$8 m of the top of the seawall was exposed in 2006 and attacked under storm conditions. The 4 m OD beach contour is meeting the seawall. At S5 the seawall is offset seawards by 14 m at a point that is 27 m east of the western groyne and the 5 m OD contour intercepts the seawall so that storm waves reach it and can enter the undercliff walk behind through an access gap in the seawall. Both beaches are likely to continue losing beach material at the present rate because in the case of R4, the downdrift beach is also losing material or, in the case of S5, is not gaining material at the same rate as it is lost updrift. It is foreseeable that R4 will need to receive some top-up material in the future to prevent storm waves overtopping onto the undercliff walk. Based on the results presented, recycling of 6
Maritime Engineering 000 Issue MA0
1. REEVE C., CHADWICK A. and FLEMING C. Coastal Engineering, Processes, Theory and Design Practice. Spon, New York, 2004. 2. SIMM J. D., BRAMPTON A. H., BEECH N. W. and BROOKE J. S. Beach Management Manual. Construction Industry Research and Information Association (CIRIA), 1996. Report No. 153. 3. FLEMING C. A. Guide on the Use of Groynes in Coastal Engineering. Construction Industry Research and Information Association (CIRIA), 1990. Report No. 119. 4. UK HYDROGRAPHIC OFFICE. Chichester to Ramsgate including Dover Strait (SC5605), 4th edition. UK Hydrographic Office, 2004. 5. CHANNEL COASTAL OBSERVATORY. Wave Data. http://www.channelcoast.org/ (accessed on 5 January 2007). 6. DORNBUSCH U., MOSES C., ROBINSON D. and WILLIAMS R. Spatial and temporal variations of the chalk cliff retreat rate in East Sussex, 1873 to 2001. Marine Geology, in press. 7. DORNBUSCH U., ROBINSON D., MOSES C. and WILLIAMS R. B. G. Variation in beach behaviour in relation to groyne spacing and groyne type for mixed sand and gravel beaches, Saltdean, UK. Zeitschrift fu¨r Geomorphologie, Supplement Band, in press.
Sediment transport through rock groynes on mixed beaches
Dornbusch
MA 700007—8/5/2008—15:54—RAMESHMU—299700—XML Model1 – pp. 1–7
8. DORNBUSCH U., ROBINSON D., MOSES C. and WILLIAMS R. B. G. Soft copy photogrammetry to measure shore platform erosion on decadal time scales. In Proceedings of CoastGIS 2005 (GREEN D. (ed.)), Aberdeen, July 2005. 9. DORNBUSCH U., ROBINSON D., MOSES C. and WILLIAMS R. B. G. Soft copy photogrammetry to measure shore platform erosion on decadal time scales. In Coastal and Marine Geospatial Technologies, (GREEN D. (ed.)) Springer, 2008, in press.
10. DORNBUSCH U., ROBINSON D., WILLIAMS R. and MOSES C. Chalk shore platform erosion in the vicinity of sea defence structures and the impact of construction methods. Coastal Engineering, 2007, 54, No. 11, 801–810. 11. JENNINGS S. and SMYTH C. Holocene evolution of the gravel coastline of East Sussex. Proceedings of the Geological Association, 1990, 101, No. 3, 306–308.
What do you think? To comment on this paper, please email up to 500 words to the editor at
[email protected] Proceedings journals rely entirely on contributions sent in by civil engineers and related professionals, academics and students. Papers should be 2000–5000 words long, with adequate illustrations and references. Please visit www.thomastelford.com/journals for author guidelines and further details.
Maritime Engineering 000 Issue MA0
Sediment transport through rock groynes on mixed beaches
Dornbusch
7