Indicators, and the Occurrence of Enteric Viruses in Estuarine. Sediments ... water quality conditions and that indicator bacteria in water are not reflective of.
APPLIED AND ENVIRONMENTAL MICROBIOLOGY, Mar. 1980, p. 588-596 0099-2240/80/03-0588/09$02.00/0
Vol. 39, No. 3
Relationships Between Environmental Factors, Bacterial Indicators, and the Occurrence of Enteric Viruses in Estuarine Sediments RAYMOND L. LABELLE,' CHARLES P. GERBA,1* SAGAR M. GOYAL,' JOSEPH L. MELNICK,1 IRINA CECH,2 AND GREGORY F. BOGDAN2 Department of Virology and Epidemiology, Baylor College of Medicine,' and School of Public Health, University of Texas,2 Houston, Texas 77030
Current standards for evaluation of the public health safety of recreational and shellfish-harvesting waters are based upon bacteriological analysis, but do not include an evaluation of the number of viruses. The objective of this study was to determine the occurrence of enteric viruses in estuarine sediments and to find a relationship, if any, between the presence of viruses in seawater or sediment or both and various biological and physicochemical characteristics of the environment. Viruses were found in greater numbers in sediment than in overlying seawater on a volume basis. Several types of enteroviruses were isolated: coxsackievirus types A16, Bi, and B5, echovirus type 1, and poliovirus type 2. On several occasions, viruses were isolated from sediments when overlying seawaters met bacteriological water quality standards for recreational use. Statistical analysis of the relationship between viruses in seawater or in sediment and other variables measured yielded only one significant association: the number of viruses in sediment was found to be positively correlated with the number of fecal coliforms in sediment. No other physical, chemical, or biological characteristic of seawater or sediment that was measured showed statistically significant association with viral numbers. No correlation was found between bacterial indicators and virus in the overlying waters. The data indicated that evaluation of the presence of bacteria and viruses in sediment may provide additional insight into long-term water quality conditions and that indicator bacteria in water are not reflective of the concentration of enteric viruses in marine waters. The construction of off-shore sewage outfalls and coastal canal communities with limited sewage treatment facilities has sparked an interest in the public health safety of the surrounding waters. The survival and persistence of viruses in the estuarine environment is of special interest since viruses appear to survive longer than coliform bacteria, which are presently used to judge water quality (35). Large numbers of viruses have been shown to be discharged into marine waters by offshore sewage outfalls (8, 10, 35), and they have also been detected in coastal canal water polluted by small-package sewage treatment plants and septic tanks (19). Using a recently developed technique to quantitate viruses in marine sediments (18), Gerba et al. found viruses in greater numbers in sediments near sewage outfalls than in the overlying seawater (15). Although viruses are inactivated more readily in seawater than in freshwater (27), they can survive much longer if adsorbed to sediments (36). Recent outbreaks of hepatitis in Houston, Tex., and in Calhoun, Ga. (26), caused by consumption of hepatitis A virus-containing
oysters which were taken from water considered safe (by bacteriological standards) for shellfish harvesting, have caused concern about the present state of knowledge of virus survival and transport in the estuarine environment. In 1905 Savage (34) concluded that samples of mud yielded more reliable bacteriological evidence of the degree of fecal pollution of a tidal river than samples of either water or oysters. More recent investigations (15, 23, 38) have found that coliforms, fecal coliforms, and salmonellae tend to concentrate in sediment and that they are almost totally located in the upper layers (top 2 in [ca. 5 cm]) of sediment (2, 38, 41). Escherichia coli has been shown to survive longer in sediment than in seawater (16). It appears that fecal bacteria concentrate and survive in sediments until they are resuspended by activities that disturb sediment, such as dredging and rapid rainwater runoff (17, 22, 29). It has been demonstrated that bottom-feeding fish have higher levels of coliforms, fecal coliforms, and fecal streptococci than do surface-feeding and predaceous fish (13). Also, oysters have been 588
VOL. 39, 1980
shown to accumulate more virus if it is present as a crude suspension rather than as purified virus, indicating that virus associated with a small amount of particulate matter is taken up more efficiently by shellfish (24). The current study was undertaken to determine whether the number of viruses in sediments could be correlated with various indicators used to judge water quality and to ascertain the number of viruses that could be expected to be present in sediments of areas into which domestic sewage was being discharged. MATERIALS AND METHODS Samples and sampling sites. Seawater samples to be used for viral analysis were obtained as grab samples in 20-liter stainless-steel pressure vessels (Millipore Corp., Bedford, Mass.). Sediment samples were obtained with the aid of an Ekman dredge and were stored in plastic bags on ice until they were processed in the laboratory for viruses and bacteria. The sample obtained by the Ekman dredge covered a square area, 15 by 15 cm, and was dug to an average depth of 2 cm. Samples of approximately 100 to 400 g could be obtained, depending upon the compaction of the surface of the sediment. Sediment was divided into 100-ml samples for bacterial analysis and 400-ml samples for viral analysis. Samples were processed immediately after returning to the laboratory. Water and sediment samples were obtained from shore stations. Seven coastal canals and four oyster beds situated in the Galveston Bay area, located within 80 km (50 miles) of Houston, Tex., on the Gulf of Mexico, were studied. Detailed maps of their locations have been published (15; R. LaBelle, Ph.D. dissertation, Baylor College of Medicine, Houston, Tex., 1979). Samples were obtained on two to four occasions from the polluted sites (H-86, H-86a, H-86b, H-81, and K-27), whereas only one or two samples were obtained from the less-polluted sites (T-50 and 323 and oyster beds no. 1, 2, 3, and 4). A total of 30 seawater and 42 sediment samples were analyzed. Seawater temperature varied from 9 to 16°C through the course of this study, which was conducted from November 1977 to early April 1978. Virus concentration from water. Attempts to isolate viruses from 20-liter samples of estuarine water were performed according to the procedure of Payment et al. (33). The following is a brief summary of the procedure. A 20-liter seawater sample was adjusted to pH 3.5 using 1 N HCI, and A1Cl3 was added to a final concentration of 0.0015 M. The solution was then passed through 3.0- and 0.45-nm-pore size Filterite filters (Filterite Corp., Timonium, Md.; Duo-Fine filters) in a flat 142-mm-diameter filter holder. Viruses were eluted with 50 ml of 0.05 M glycine (pH 11.5). The eluate was adjusted to neutrality using 1 M glycine (pH 2.0). The efficiency of this method was approximately 50% (14). Virus concentration from sediment. Attempts to isolate viruses from sediment were performed according to a previously developed procedure (18), with one modification: tryptose phosphate broth containing
ENTERIC VIRUSES IN SEDIMENTS
589
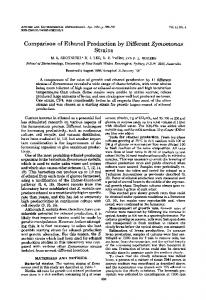
10% fetal calf serum adjusted to pH 11.5 was used as the eluent in the reconcentration step. The modified procedure for virus isolation is as follows: (i) addition of 400 ml (approximately 500 g [wet weight]) of sediment to 1,500 ml of 0.25 M glycine buffer containing 0.05 M ethylenediaminetetraacetic acid with a final pH of 11.0; (ii) shaking of the sediment-eluent mixture for 5 min; (iii) removal of sediment by centrifugation; (iv) adjustment of the supernatant to pH 3.5 by addition of 1 M glycine buffer (pH 2.0) (neutralization of the eluate should be performed as quickly as possible [within 15 min] to prevent inactivation of the virus due to the high pH [11]); (v) addition of 1 M AlC13 to a final concentration of 0.06 M; (vi) passage of the eluate through a series of adsorbent membrane filters (3.0- and 0.45-,um Filterite filters); (vii) elution of the virus from the filters with tryptose phosphate broth containing 10% fetal calf serum (pH 11.5); and (viii) neutralization of the filter eluate with 1 M glycine buffer (pH 2.0). The average efficiency was approximately 50% for the sediments examined in this study (18). Virus isolation. Virus assays were performed by the plaque-forming unit method (39), using passages 140 to 150 of the buffalo green monkey kidney (BGM) cell line which was passaged, grown, and maintained by previously described methods (31). Samples of 2 ml were inoculated directly onto a monolayer of BGM cells in a 75-cm2 flask. Virus was allowed to adsorb for 90 to 120 min at 37°C before the cells were overlaid with agar. Since the samples were obtained from polluted areas, 10 yg of neomycin sulfate and 100 U of mycostatin per ml were added to the overlay agar, in addition to 500 U of penicillin and 500 ug of streptomycin per ml. The overlaid cell cultures were incubated at 37°C and were examined daily for 10 to 14 days for the presence of plaques. All plaques were picked and passed once in BGM cells under liquid medium, and progeny from some samples were identified using pools of enterovirus antisera (30). From 50 to 100% of the total eluate volume of each sample was assayed, depending upon the concentration of virus in the final concentrate. Bacteriological analysis. The determination of most probable numbers of total coliform and fecal coliform bacteria was carried out according to Standard Methods for the Examination of Water and Wastewater (3) and as detailed elsewhere (19). Clostridia were enumerated using differential reinforced clostridial medium as a presumptive medium in a most-probable-number test (9). The inoculated tubes were incubated anaerobically in a GasPak system (BBL Microbiology Systems, Cockeysville, Md.) at 37°C for 48 h. Blackening of the medium indicated the presence of clostridia. Cultures from positive tubes were transferred to litmus broth tubes, which were incubated at 37°C for 48 h. Acidification, coagulation, and gas production were considered positive for Clostridium perfringens (9). Statistical analysis. The statistical evaluation of the relationships between the number of viruses in the sediments and the environmental variables was performed through multivariate regression analysis. Before this analysis, the scatter plots of the viral counts against each independent variable were examined.
590
LABELLE ET AL.
APPL. ENVIRON. MICROBIOL.
coxsackievirus type B5 (coxsackie B5), seven as echovirus (echo) 1, and one each as coxsackie Bi, coxsackie A16, and poliovirus (polio) 2. Five isolates were not typable by the enterovirus typing sera. We have isolated viruses from these waters in a previous study (20) and obtained several different types of enteroviruses. The two studies have only one virus in common: echo 1. As stated above, the first step in the statistical evaluation of sampling data was the analysis of bivariate scatter plots for viral counts versus other individual characteristics of water or sediment. Such analysis indicated that out of 12 independent variables, only 1, the number of fecal coliforms found in the sediments, had a significant regression coefficient (P < 0.0001) with the number of viruses isolated from sediRESULTS ments. The association of the number of fecal Water quality information obtained at the coliforms and viruses in sediments was direct, collection sites is presented in Table 1. meaning that the increase in fecal coliform numSince we were primarily interested in deter- ber was associated with higher viral numbers, mining whether there was a relationship be- with the coefficient of linear correlation R equal tween the presence of viruses in sediment and to 0.76 (Fig. 1). The regression remained statisthe presence of viruses in seawater, most of the tically significant when the semi-log transforsites were chosen because of their known pollu- mation was applied (Fig. 2), although log-log tion (20). The most-probable-number values for transform worsened the fit. coliforms at the sampling sites at the time of Other variables were not found to be of statisvirus isolation are shown in Table 2. In all but tical significance when studied on a one-to-one one case of virus isolation from water, the total basis with the dependent variable (which was and fecal coliform counts exceeded the values numbers of virus, either in water or sediment), recommended for recreational waters (1,000 to- and the exponential curve approximations were tal coliforms per 100 ml, 70 fecal coliforms per not substantially better than the linear. It is 100 ml) (12). On one occasion, when water met important that neither the number of viruses the standards for both recreational and shellfish- nor the number of fecal coliforms in water apharvesting waters (70 coliforms per 100 ml), peared to be a good predictor of the number of viruses were isolated from the water overlying viruses found in the sediments, and vice versa. an oyster bed. In four cases when the overlying The scattergram of the number of viruses seawater met the recommended standards for versus pH (Fig. 3) may be noteworthy. The recreational water, viruses were isolated from examination of the scattergram suggested that sediment. At one of these sites (H-86), two of a pattern might exist here, i.e., the number of these cases occurred at the same approximate viruses appeared to increase only in a certain area on the same day and yielded virus isolates. range of pH, from about 7.8 to 8.4; it dropped at This site is a sewage outfall area of a canal both higher and lower ends of the pH scale. It is community. The total and fecal coliform counts not possible to judge presently whether this in the sediment were also the highest observed pattern is real or artificial, but this should be at this site. The two other sites had relatively studied further when more data become availalow numbers of total and fecal coliforms in the ble. sediment. This indicates that, even though inThe effect of each factor in the presence of dicator organisms were present in low numbers others on the number of viruses in the sediments in sediment, it was possible for virus to be pres- was evaluated using the stepwise multiple ent. regression analysis, as explained in Materials Of the 440 natural isolates obtained, 83 and Methods. This showed essentially that a plaques were plucked, and attempts were made single variable, the fecal coliform count, exto grow virus in one or two passages in BGM cell plained as much as 57% of the variation in the culture. Twenty-three isolates were successfully number of viruses found in the sediment. The passaged, and serotyping was attempted using variance contribution due to other variables was enterovirus typing pools (30). Of the viruses insubstantial. With the addition of each new grown in cell culture, eight were typed as variable, the changes in R2 were small. A sum-
This step proved to be very helpful in the search for a mathematical approximation of the complex process studied. For all variables (except for rain index, which was a discrete variable), the bivariate relationships with the viral count as a dependent variable were first approximated by a least-squares fit of a linear model. Further, the possibility was also considered that an exponential curve may provide better approximation of the biological relationships under study, and therefore the least-squares fit of the log-transformed data was tried. The number of viruses in the sediments, denoted by Y, was studied as a function of various characteristics of water quality and sediments, denoted by Xi, X2, * * X13. This hypothesized functional dependence was evaluated by stepwise multiple regression using the SPSS computer package version 7 (32). -
VOL. 39, 1980
ENTERIC VIRUSES IN SEDIMENTS
(36 (30 U-J cq
o6 00
Cq
m eq
V:q
(m
M
cl
00
cq
C4
cq
C14
v
m v
2
068 cylt- -o C)
v
O
V
CYD
t-
C6
eNf
ck
m
00
C14
-
C)
cq
-
Cl
UID Cos
t-
,
Iis
cq
LO 00 00 CII C-1
v cq
15
V V CII m C14 m
ti
Cq
LO
Cq
C'4
v
C14
u. CI.
o6
Ci cl) 00
.6
00 0
t,:
(3q
x
06
i:-§ .
o
ui
m
-
-4
8 cNi C; m Ml , V m
jl.
C9
'ID
C)
cq
U-.
cq t-
cli
o?
8
C.
CID -4
C9
cq
rl:, Ml 9 40 v
4 8
C M v M m t-
m
06
C6 WD C6 U" 6 C',Too
tlt:r -V-V-V-cq-
v
C)
§
cq -cq
e
v -4
m
C9
c)
C48 ml Lf.
C) Cq O
v cq
m
Lo,
C-1
Lo,
00
cv,I
cq
g ;. § t-
cq
cNf
v-
m
v
C"D
G v
C6
C)
C)
00
C]
r.c cq
§ cq
A
.,,v v cq
v
v
v
§ cq eg
C)
C,i
00-
C9
cNf
cq
C,4 cq 0
cq o
cn ec, C9 v C4
-.4 cq m N cl,
cq
Cj
m
ck cl,
Cl
V
IW C4
00
M
.c
cq
v-
C14
c.4
-4 1-4
C-4
v
cq C> cq -0
cq
m
§ (C3,01
te Lo
Lco, m
0
cr
EbJD
4-1 4J,
C9
CC co
cn .T.
>
a
cn
591
5.F;9
L.ARR.T.T.
AT TI tlL.
! TA U' lW ki Cj14, JAL:Jl JJN
APPL. ENVIRON. MICROBIOL.
TABLE 2. Isolation of virus from water and sediment and comparison to bacterial indicators Site
Date
H-86
11/15/77 11/22/77 4/12/78 4/12/78 2/27/78 2/27/78 11/15/77 11/22/77 12/01/77 11/15/77 11/22/77 11/22/77 12/09/77 12/21/77 2/27/78 3/03/78
H-86a T-50 H-86b H-81 K-27 H-86d
Oyster bed no. 1
MPN' of indicator organisms per 100 ml
PFU/20 1 PFU/20 1 sea-
sedi-
watera
mentb
6 15 374 528 0 0 0 5 30 0 1 8 2 1 0 7
200 0 0 140 350 280 50 50 480 170 0 0 0 0 50 0
Total coliforms
Fecal coliforms
Water
Sediment
Water
Sediment
24,000 11,000 24,000 4,600
46,000 240,000 240,000 210,000 460,000 460,000 11,000 240,000 240,000
24,000 11,000 11,000 4,600
46,000 46,000 110,000 15,000 460,000 460,000 2,400 21,000 240,000
200 200 460
24,000 24,000 23
24,000 24,000 24,000 4,600 50 4
90 90 460
24,000 11,000
930