Int. J. Plant Sci. 161(5):779–783. 2000. Copyright is not claimed for this article.
SEEDLING RESPONSE TO ELEVATED CO2 IN FIVE EPIGEAL SPECIES C. R. Tischler,1,* H. W. Polley,* H. B. Johnson,* and R. E. Pennington† *USDA-ARS, Grassland, Soil, and Water Research Laboratory, 808 E. Blackland Road, Temple, Texas 76502-6712, U.S.A.; and †Roche Molecular Biochemicals, 9115 Hague Road, Indianapolis, Indiana 46250-0414, U.S.A.
Evidence from numerous sources indicates that atmospheric CO2 concentration has increased over the last 200 yr and will continue to increase in the foreseeable future. Much research is directed toward predicting the effects of this change on terrestrial vegetation. We quantified the effects of elevated CO2 (700 mL L21) on the seedling growth characteristics of five C3 species. These species all had epigeal germination morphology but differed by a factor of 20 in seed mass. The species and their respective seed-mass ranges were as follows: bagpod sesbania (Sesbania vesicaria), 0.23–0.26 g; cotton (Gossypium hirsutum var. Coker 317), 0.12–0.13 g; mesquite (Prosopis glandulosa), 0.041–0.048 g; cucumber (Cucumis sativus L. cv. Straight-8), 0.026–0.030 g; and hemp sesbania (Sesbania exaltata), 0.012–0.013 g. We measured increased total biomass in the elevated CO2 environment for all species within 3 d of emergence. This rapid response contrasts with published reports that more time was required for a detectable response of seedlings to elevated CO2. Growth analyses indicated that no single growth parameter predicted the responses of these species to elevated CO2. However, maximum area of cotyledons was a better predictor of total biomass (at day 16) than was initial (day 0) seedling mass. Our data indicate that future increases in atmospheric CO2 will greatly improve the competitive ability of C3 epigeal species during the earliest growth stage in which cotyledons are still expanding. Keywords: seedling morphology, epigeal, CO2 response, seedling establishment.
Introduction
species having higher RGR in a normal atmosphere. If this is a general phenomenon, then a relationship should exist between seed mass and magnitude of response to elevated CO2 for the following reasons. First, Jurado and Westoby (1992), in a comparison of 32 Australian species, found that the RGR of seedlings from heavier-seeded species was lower than the RGR of seedlings from lighter-seeded species. They also cited extensive literature supporting this thesis (however, cf. Kelley 1996). Second, Seibert and Pearce (1993) compared growth and morphological characteristics of four weed and two crop species and found that the small-seeded weeds had higher RGRs than the crop species, presumably because they partitioned more seed reserves to the production of leaf area early in development. And finally, taken together, the reports of Radoglou and Jarvis (1992, 1993), Juardo and Westoby (1992), Seibert and Pearce (1993), and Bunce (1997) suggest that both the magnitude and the rapidity of response to elevated CO2 may be influenced by seed mass. Previous work has not considered the possible confounding influence of seedling morphology on response to CO2 concentration. Lovell and Moore (1971) were among the first to discuss the influence of seedling morphology on early growth. In a study of four species with divergent developmental morphologies, they found that species with expanding cotyledons tended to accumulate biomass faster than species with nonexpanding or nonphotosynthetic cotyledons. Species with nonexpanding cotyledons produced true leaves at an earlier stage, but at the expense of rapid growth during the very early stages of development. Poorter and Remkes (1990) compared relative growth rates of 24 wild species and found a high correlation between leaf-area ratio (LAR; leaf area divided by total biomass) and RGR. This was despite the fact that the species they
Predictions of future increases in atmospheric CO2 concentration (Trabalka et al. 1986) have prompted numerous investigations into the potential effects of this change at levels ranging from the individual plant to the ecosystem. Even at the plant level, the effects of CO2 enrichment are complex and interact with factors such as phenology and water and nutrient availability. Most studies to date have focused on plant response in later stages of development, in order to determine effects of CO2 enrichment on reproductive output. Radoglou and Jarvis (1992, 1993) studied seedlings in the early stages of development and suggested that seedlings with small cotyledons (i.e., low mass seed) showed a response to elevated CO2 earlier than seedlings with large cotyledons (large seed) because, in the latter, the large cotyledons provided substrate for growth for a longer period. The large-seeded species in their study was Vicia faba L., a hypogeal species, and the smaller-seeded species was Phaseolus vulgaris, an epigeal species. Vicia faba showed no positive response to elevated CO2 during the first 45 d after emergence, while Phaseolus vulgaris showed positive effects of elevated CO2 on biomass within 17 d of emergence. Bunce (1997) studied growth parameters of C3 crop and weed species and found that the ratio of total biomass at elevated versus ambient CO2 concentrations was correlated with relative growth rate (RGR; dry mass increase [g g21 d22]) at the ambient CO2 concentration. Similarly, Poorter (1993) found that the stimulation in RGR was generally greater in 1
Author for correspondence; e-mail
[email protected].
Manuscript received January 2000; revised manuscript received May 2000.
779
INTERNATIONAL JOURNAL OF PLANT SCIENCES
780
Table 1 Total Biomass (mg) of Four Species (Grown at 365 or 700 mL L21 CO2) 7–16 d after Emergence Species and CO2 concentration Bagpod: 365 ........... 700 ........... Cotton: 365 700 ........... Mesquite: 365 ........... 700 ........... Cucumber: 365 ........... 700 ...........
Day 7
Day 10
Day 13
Day 16
268.2A 348.8B
361.0A 515.8B
724.5A 1179.4B
1248.0A 2077.5B
154.1A 242.5B
282.3A 436.6B
557.6A 904.4B
1150.4A 1796.6B
45.3A 48.7A
48.9A 66.0B
79.7A 112.5B
120.0A 210.8B
169.2A 268.9B
337.8A 662.5B
757.29A 1279.3B
1672.9A 3048.2B
Note. Values for a species and age not followed by the same letter are significantly different at the 5% level (Duncan’s multiple range test).
studied included both monocots and dicots, annuals and perennials, and a broad array of seedling morphologies. Thus, seedling morphology and other factors need to be taken into consideration to clarify relationships between seed mass, seedling morphology, and response to CO2 enrichment. In addressing the question of the rate and magnitude of C3 seedling response to elevated CO2 as affected by seed mass, germination morphology (hypogeal or epigeal) should be controlled. Our objective was to test the prediction that the rapidity and magnitude of seedling response to elevated CO2 is a function of seed mass; to this end, we used five epigeal species with a wide range in seed mass. Our second objective was to search for relationships between RGR and NAR (net assimilation rate; rate of dry-weight accumulation divided by leaf area) in five species grown at current and elevated CO2.
(Steywe & Sons, Corvallis, Oreg.) that were 25 cm deep and 6.25 cm in diameter at the top. A commercial peat-perlite potting mix (Sun Grow Horticulture, Bellevue, Wash.) was employed. Total cone volume was ca. 425 cm3. Cones were arranged in interlocking racks of 20. Planting dates were staggered to allow emergence to occur at about the same time for all species so that all species would experience similar light environments. Times from planting to emergence were as follows: mesquite and cucumber, 3 d; cotton and hemp sesbania, 4 d; and bagpod sesbania, 5 d. After planting, cones were watered weekly with full strength Hoagland’s solution (Hoagland and Arnon 1950). At emergence, aberrant seedlings were discarded, and four healthy seedlings of each species were randomized within each rack. Aberrant seedlings were most common in cotton, where some degree of cotyledonary leaf damage from acid delinting was observed on every seedling. Seven plants per species were harvested at emergence (day 0) and on subsequent harvest dates. This “day 0” value, rather than mass of the dry seed, was used as the starting point for RGR analyses and as an estimate of seed mass. We thus avoided complications associated with the mass contribution of the inert seed coat, the mass of which tends to increase as total seed mass increases across species (Fenner 1983). At each harvest date in each experiment, seedlings were cut at soil level, and shoots were separated into leaves and stems. Areas of cotyledonary and true leaves were determined with a photoelectric leaf-area meter. Potting mix was washed from the roots. Plant parts were dried 24 h at 657C. Dry masses of roots, shoots, cotyledonary leaves, and true leaves were measured. Two adjacent glasshouse bays at the Grassland, Soil, and Water Research Laboratory (Temple, Tex.) were utilized; CO2 concentrations were either 365 or 700 mL L21. Air within each bay was sampled each 4 min with a Li-Cor (Lincoln, Nebr.) Model LI-622262 infrared gas analyzer to determine CO2 concentration. Pure CO2 was injected into the 700 mL L21 glassTable 2
Material and Methods For each of the five species used in this study, large seed lots were assembled, and seeds were individually weighed so that a relatively narrow band of seed masses could be used for each species, thus reducing the effects generated by intraspecific variation in seed mass. This precaution was taken because we have observed significant correlations between seed mass and cotyledonary leaf area (cucumber) and seed mass and primary leaf area (bean; C. Tischler and H. Polley, unpublished data). The species and their respective seed-mass ranges were as follows: bagpod sesbania (Sesbania vesicaria), 0.23–0.26 g; cotton (Gossypium hirsutum var. Coker 317), 0.12–0.13 g; mesquite (Prosopis glandulosa), 0.041–0.048 g; cucumber (Cucumis sativus L. cv. Straight-8), 0.026–0.030 g; and hemp sesbania (Sesbania exaltata), 0.012–0.013 g. Cotton was obtained from the Texas Agricultural Experiment Station (Temple, Tex.), and cucumber was purchased locally. For the other three species, seed were hand collected from individual plants in central Texas in the fall of 1995. Seeds of bagpod and hemp sesbania and mesquite were scarified before planting. Seeds were planted in plastic cones
Total Biomass (mg) of Five Species 3 d after Emergence at 365 and 700 mL L21 CO2 Species and CO2 concentration Bagpod: 365 ........... 700 ........... Cotton: 365 ........... 700 ........... Cucumber: 365 ........... 700 ........... Mesquite: 365 ........... 700 ........... Hemp: 365 ........... 700 ...........
Experiment 2
Experiment 3
159.6A 167.9A
164.4A 183.1B
91.7A 105.3B
109.5A 132.8B
50.3A 68.5B
68.9A 91.4B
29.4A 32.0B
33.8A 38.7B
11.2A 13.4B
14.1A 19.2B
Note. If a pair of values in the same experiment column are not followed by the same letter, they are significantly different (P p 0.05).
TISCHLER ET AL.—SEEDLING CO 2 RESPONSE
781
Table 3
Data Analysis
RGR and NAR for Five Species Calculated for 3–10 d after Emergence
Standard ANOVA and mean separation techniques were used to establish treatment differences. Relative growth rates were determined by standard methods. Initially, comparisons between species were made when species had a similar dry mass, as suggested by Coleman et al. (1994) and Poorter (1993). However, because of the large differences in seedling masses between species, this approach was abandoned. Average RGR and NAR values were calculated for the period of 3–10 d postemergence with data from experiment 2. This approach minimized possible problems created by developmental rests (Vogel 1980) or differences in growth rate related to developmental stage (Stebbins 1976).
Species and CO2 concentration (mL L21) Bagpod: 365 ............ 700 ............ Cotton: 365 ............ 700 ............ Mesquite: 365 ............ 700 ............ Cucumber: 365 ............ 700 ............ Hemp: 365 ............ 700 ............
RGR (g g21 d21)
NAR (g m22 d21)
0.214 0.256
13.20 17.80
0.421 0.442
19.45 26.20
0.131 0.182
9.31 13.38
Results
0.282 0.331
9.24 13.48
Experiment 1
0.347 0.427
12.41 18.49
house bay as needed to maintain the target concentration. In the 365 mL L21 bay, outside air was blown into the bay to maintain the desired ambient concentration. Air temperature was maintained near the outdoor temperature by periodic adjustment of thermostatic controls. The spring and summer of 1996 was unusually dry, and for all experiments described, plants experienced little overcast weather.
Experiment 1 Emergence occurred on April 1 and 2, 1996. Seedlings were sampled on days 7, 10, 13, and 16. Hemp sesbania was not included as an entry in this experiment.
Experiment 2 Data from experiment 1 indicated that, by the day 7 harvest, plants in the 700 mL L21 atmosphere had significantly greater dry mass than those in the 365 mL L21 atmosphere. Thus, days 3 and 5 after emergence were included as sampling times in experiment 2 in order to determine more precisely when responses to elevated CO2 were observable. Results from experiment 1 indicated no differences in total biomass at emergence between the two CO2 greenhouses, and thus day 0 cones (used to calculate initial seedling mass) were planted only in the 700 mL L21 greenhouse. Planting dates were adjusted so that emergence occurred on May 5 and 6, 1996.
By 7 d after emergence seedlings of bagpod sesbania, cotton, and cucumber in the 700 mL L21 glasshouse bay were significantly higher in mass than analogous seedlings grown at the present CO2 concentration (table 1). However, the difference was not significant in the case of mesquite. This may have been partially caused by inadequate sample number (n p 5) for this species at the 700 mL L21 atmosphere and also by an aberrant seedling in this small sample. As expected, all differences between CO2 atmospheres were significant for all species at all subsequent harvest dates (table 1). The species included in this experiment exhibited pronounced differences in biomass accumulation. The ratio of biomass at day 16 (data not shown) to that at day 0 (365 mL L21 CO2 atmosphere) was 16.9, 66.9, 8.5, and 4.4, for cotton, cucumber, bagpod sesbania, and mesquite, respectively.
Experiments 2 and 3 In experiment 2, total biomass at 3 d after emergence was significantly greater at 700 than at 365 mL L21 CO2 for all species except bagpod; and in experiment 3, it was greater in all cases (table 2). For subsequent harvests (days 5–16, ex-
Experiment 3 Planting dates were adjusted such that emergence occurred on June 26 and 27, 1996. In this experiment, only day 3 data were collected for cotton, bagpod sesbania, cucumber, and mesquite. However, for hemp sesbania, adequate cones were planted to allow sampling at days 3, 5, 7, 10, and 16. These additional dates were included because hemp sesbania was not included in experiment 1, and additional data were needed to verify that the results of experiment 2 were indeed representative of growth of that species.
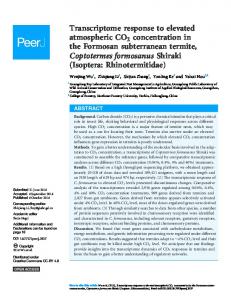
Fig. 1 Relationship between relative growth rate (RGR) at 365 mL L21 CO2 and the ratio of RGR at 700 mL L21 CO2 compared to that at 365 mL L21 CO2 for five species (r 2 p 0.729; P p 0.0654).
INTERNATIONAL JOURNAL OF PLANT SCIENCES
782
Table 4 Cotyledonary Leaf Area and Average Daily Increase in Biomass (First 16 d) of Five Species at Ambient and Elevated CO2 Biomass accumulation (mg) Species
Area (cm)
365 mL L21 CO2
700 mL L21 CO2
Bagpod ......... Cotton .......... Cucumber ...... Mesquite ....... Hemp ...........
17.0 50.0 30.0 3.5 3.0
109 119 135 12 35
138 167 197 25 75
periment 2), the difference was significant in all cases. Biomass values were correspondingly higher in experiment 3 than in experiment 2 in every case, presumably because of the longer day lengths experienced in experiment 3. Behavior of hemp sesbania in experiment 3 (days 3–16) was very similar to that in experiment 2. Data from experiment 2 was used to calculate average RGR and NAR values for days 3–10. For each species, RGR and NAR values were higher at elevated CO2 (table 3). The relationship between RGR at current CO2 concentration and relative stimulation in biomass at high versus current CO2 (data not shown) was not significant (somewhat contrary to the findings of Bunce 1997). In fact, relative stimulation in biomass was fairly constant for all species except hemp sesbania, where stimulation was approximately twice that of the other four species. Also, there was no simple relationship between RGR at current CO2 and absolute increase in RGR at elevated CO2 (contrary to the pattern reported by Poorter 1993). There was a negative relationship between RGR at current CO2 and the relative increase in RGR with increasing CO2 (P p 0.065; fig. 1). The relative increase in RGR was positively related to the relative stimulation in NAR at elevated CO2 (table 3), which is consistent with Bunce (1997) but contrary to Poorter (1993). The relative increase in NAR, however, was not related to NAR at the current CO2 level. No relationship between initial seedling mass (day 0) and RGR (days 3–10) was apparent (data not shown). When mean LAR was determined from actual values calculated for all species and harvest dates, LAR was lower at elevated CO2 in all but one case (3-d-old mesquite). Also, LAR was lowest at days 3 and 16 for all species except cucumber, where the highest LAR was observed at day 3 (data not shown), presumably because of the extent of cotyledonary leaf expansion in this species. Average daily biomass accumulation over the 16 d of experiment 2 for both CO2 levels are presented along with maximum cotyledonary leaf area of the five species in table 4. Although rankings for maximum cotyledonary leaf area and biomass accumulation are not in strict rank order, a good correspondence between the two factors is apparent. In fact, Pearson correlation coefficients between maximum cotyledonary leaf area and biomass accumulation (for the entire 16 d) at 365 and 700 mL L21 CO2 were 0.812 (P p 0.095) and 0.809 (P p 0.097), respectively. These correlations were much better
than the corresponding correlations between initial seed mass (day of emergence) and biomass accumulation, 0.542 (P p 0.3453) and 0.401 (P p 0.5031), indicating that degree of cotyledon expansion is more important than mass at emergence in influencing biomass accumulation.
Discussion Rapidity of Response to Elevated CO2 The experiments described here demonstrate that for the five epigeal species studied significant responses to an atmosphere enriched to 700 mL L21 CO2 were observable within 3 d of emergence for four species and that responses were present in one out of two cases for a fifth species (bagpod). We saw little evidence for a relationship between seed mass and rapidity of response to elevated CO2, at least in the range of seed masses (and within the single morphological type) we utilized. Our data do not directly conflict with those of Radoglou and Jarvis (1992, 1993), given that the large-seeded species they used exhibits hypogeal germination morphology and that it also has a seed mass substantially greater than that of the largest seed-mass species used in our experiments. Our ability to detect early responses to elevated CO2 may be because we carefully controlled seed mass in our experiments. Because cotyledonary leaf area in cucumber is proportional to seed mass, differences in seed mass may generate variability that would not allow early detection of CO2 responses. In addition, in the two cultivated species (cotton and cucumber) and three native species in our study, selection for seed mass was never performed, contrary to the situation in the species studied by Radoglou and Jarvis (1992, 1993). Consistent with the predictions of Lovell and Moore (1971), total area of cotyledonary leaves was a good predictor of rate of biomass accumulation (at least for the first 16 d of seedling growth).
Growth Analyses The 20-fold difference in seed mass of the species we tested makes comparisons of RGR at a constant weight impossible because comparisons at the same seedling dry weight were complicated by large differences in phenology between the largest- and smallest-seeded species. Our approach of averaging from days 3 to 10 also tends to reduce effects of seedling “rests” (Vogel 1980) and transient differences in growth rate such as those observed by Stebbins (1976). Mesquite, the only woody species in this study, had the lowest RGR, but the value of 0.131 g g21 d22 is substantially higher than mean RGR values presented by Hunt and Cornelissen (1997). In a study of 59 temperate plant species, they found a grand mean RGR of 0.09 g g21 d22 for woody species. However, as our determinations were made early in development, when the mesquite seedling composition was more herbaceous than woody, one might expect an abnormally high RGR as compared to values determined later in development. Contrary to Bunce (1997), our data showed no relationship between RGR at normal CO2 and relative stimulation in biomass accumulation. Although the relationship between relative increase in RGR and relative stimulation of NAR at elevated CO2 was not significant, this result was likely influenced by the species used in our study. Thus, we believe that interspecific
TISCHLER ET AL.—SEEDLING CO 2 RESPONSE patterns in the response of biomass to CO2 enrichment are likely to be more complicated than either Bunce (1997) or Poorter (1993) suggested and, in some cases, that these patterns may be species specific. Relative stimulation in biomass with CO2 elevation is a function of both RGR at current CO2 concentration and the increase in RGR at elevated CO2. At the high light levels employed in this experiment, increase in RGR was correlated with relative increase in NAR, but increase in NAR was not easily predictable from NAR at present CO2. Bunce (1997) found a good correlation between changes in NAR and response of leaf photosynthetic rate to CO2, which
783
suggests that a better understanding of mechanisms governing the photosynthetic response of seedlings to CO2 will be necessary to predict seedling response to CO2 enrichment.
Acknowledgments Alicia Naranjo planted the seed and assisted in harvesting and processing plant material. Ron Whitis and Chris Kolodziejczyk maintained CO2 and environmental control systems and data records.
Literature Cited Bunce JA 1997 Variation in growth stimulation by elevated carbon dioxide in seedlings of some C3 crop and weed species. Global Change Biol 3:61–66. Coleman JS, K McConnaughy, DD Ackerly 1994 Interpreting phenotypic variation in plants. Trends Ecol Evol 9:187–191. Fenner M 1983 Relationships between seed weight, ash content and seedling growth in twenty-four species of Compositae. New Phytol 95:697–706. Hoagland DR, DI Arnon 1950 The water-culture method for growing plants without soil. Calif Agric Exp Stn Circ 347:1–39. Hunt R, JHC Cornelissen 1997 Components of relative growth rate and their interrelations in 59 temperate plant species. New Phytol 135:395–417. Jurado E, M Westoby 1992 Seedling growth in relation to seed size among species of arid Australia. J Ecol 80:407–416. Kelly CK 1996 Seed mass, habitat conditions and taxonomic relatedness: a re-analysis of Salisbury (1974). New Phytol 135:169–174. Lovell P, K Moore 1971 A comparative study of the role of the cotyledon in seedling development. J Exp Bot 22:153–162. Poorter H 1993 Interspecific variation in the growth response of plants to an elevated ambient CO2 concentration. Vegetation 104/ 105:77–97.
Poorter H, C Remkes 1990 Leaf area ratio and net assimilation rate of 24 wild species differing in relative growth rate. Oecologia 83: 553–559. Radoglou KM, PG Jarvis 1992 The effects of CO2 enrichment and nutrient supply on growth, morphology and anatomy of Phaseolus vulgaris seedlings. Ann Bot 70:245–256. ——— 1993 Effects of atmospheric CO2 enrichment on early growth of Vicia faba, a plant with large cotyledons. Plant Cell Environ 16: 93–98. Seibert AC, RB Pearce 1993 Growth analysis of weed and crop species with reference to seed weight. Weed Sci 41:52–56. Stebbins GL 1976 Seed and seedling ecology in annual legumes. I. A comparison of seed size and seedling development in some annual species. Oecol Plant 11:321–331. Trabalka JR, JA Edmonds, JM Reilly, RH Gardner, DE Reichle 1986 Atmospheric CO2 projections with globally averaged carbon cycle models. Pages 534–560 in JR Trabalka, DE Reichle, eds. The changing carbon cycle: a global analysis. Springer, New York. Vogel EF de 1980 Seedlings of dicotyledons. Centre for Agricultural Publishing and Documentation, Wageningen. 465 pp.