Oikos 121: 442–448, 2012 doi: 10.1111/j.1600-0706.2011.19420.x © 2011 The Authors. Oikos © 2012 Nordic Society Oikos Subject Editor: Justin Travis. Accepted 15 June 2011
Selective feedback between dispersal distance and the stability of mutualism Keenan M. L. Mack K. M. L. Mack (
[email protected]), Indiana Univ., 1001 E. 3rd St. Jordan Hall 149C, Bloomington, IN 47405, USA.
The evolution and maintenance of mutually beneficial interactions has been one of the oldest problems for evolutionary theory. For cooperation to be stable, mechanisms such as spatial population structure must exist that prevent noncooperative individuals from invading cooperative groups. Selection for certain traits like increased dispersal can erode that structure. Here, I used a spatially explicit individual based dual lattice computer simulation to investigate how the evolution of dispersal interacts with the evolution of mutualism and how this interaction affects the stability of mutualism in the face of non-mutualists. I ran simulations manipulating the self-structuring phenotype, dispersal distance, over a range of environmental conditions, as well as letting both dispersal and mutualism evolve independently, with and without a cost of dispersal. I found that environmental productivity is negatively correlated with the stability of mutualism, and that the stability of mutualism relied on the ability of mutualists to evolve shorter dispersal distances than non-mutualists. The inclusion of a dispersal cost essentially fixed the upper limit of dispersal, and therefore limits the ability of non-mutualists to evolve higher average dispersal than mutualists, but as costs are relaxed, the differences are recovered. These results show how selection on seemingly unrelated traits can align suites of traits into holistic life history strategies.
The evolution and maintenance of mutually beneficial interactions, whether it is between conspecifics or individuals of different species, has historically been a great dilemma for evolutionary theory. The challenge being that if cooperation has a cost associated with it, non-cooperative individuals not paying the cost still receive the benefit from a cooperative partner. Therefore, non-cooperators have higher average fitness than cooperators and will invade and replace the cooperative individuals (Trivers 1971, Axelrod and Hamilton 1981). Yet, cooperative behavior has been widely observed in nature (Dugatkin 1997). Many solutions have been offered to explain the numerous apparent examples of evolved cooperation, but all of them essentially depend on cooperative individuals tending to interact with other cooperative individuals. This tendency can result from either recognition mechanisms or mechanisms that generate spatiotemporal structure. Besides the dynamics of cooperation, the simple mean field expectations of numerous evolutionarily and ecologically important processes change when treated as spatial explicit. This has been shown both theoretically and empirically for predator–prey dynamics (Huffaker 1958, Briggs and Hoopes 2004), competitive dynamics (MacArthur 1958, Hanski 2008) and mutually beneficial interactions (van Baalen and Rand 1998, Bever et al. 2009). Population structure can be generated by the environment, through environmental heterogeneity, and the phenotypes of individuals within the population themselves. These self-structuring phenotypes affect the spatial organization of genotypes in 442
the population and therefore generate spatial structure even in homogeneous environments (Lion and van Baalen 2008). For instance, dispersal is a self-structuring phenotype because individuals with short dispersal tend to cluster around each other, while individuals with longer dispersal will be more evenly distributed throughout their environment. Dispersal is generally thought of as selectively advantageous. In heterogeneous environments, more dispersal allows organisms to better exploit higher quality patches of environment while avoiding poorer ones (Gadgil 1971). Limited dispersal can itself generate environmental heterogeneity by making populations viscous, which leads to clumped distributions in space. Not only will these clumps be denser, and therefore more resource depleted, they can attract predators and parasites, both of which will select for dispersal away from the clump (Gadgil 1971). However, even in homogeneous environments, dispersal is favored because it shifts competitive interactions away from like genotypes and toward unlike ones (Hamilton and May 1977). Limited dispersal can impede or promote the evolution of mutualism depending on the context of the interaction. The evolution of cooperation can be impeded by limited dispersal if the intensity of local competition increases as a result and leads to more intense local density regulation (Taylor 1992, Wilson et al. 1992) or if the cost/benefit payoff structure favors negative frequency dependence, as in the hawk–dove game were being different from your interaction partner is the best strategy (Hauert and Doebeli 2004), but also see (Sicardi et al. 2009). However, limited dispersal can
also favor cooperation by generating clusters of mutualists that can interact with each other more than they interact with non-cooperators (Nowak and May 1992, Doebeli and Knowlton 1998, Killingback et al. 1999). Because of the selective interaction between these two traits, other studies have looked at how they evolve together and found that the evolution of dispersal distance negatively correlates with the evolution of cooperation (Koella 2000, Le Galliard et al. 2005). This leads to the expectation that non-cooperators will evolve longer dispersal distance in response to the spread of cooperators and/or cooperators will evolve shorter dispersal distance. The conflict between selection for increasing dispersal distance and cooperation requiring limited dispersal can potentially create a barrier against the evolution and maintenance of cooperation (Le Galliard et al. 2005). While the previously mentioned studies looked at this selective feedback in altruism, the evolution of mutualism requires more than just the autocorrelation between cooperative partners. It also demands that the clumping of cooperators in one species’ population is coordinated with the clumping of cooperators in the other species’ population as well. I designed an individual based computer simulation to investigate how the evolution of dispersal interacts with the evolution of mutualism, and how this interaction affects the stability of mutualism in the face of non-mutualists. This simulation used a dual lattice approach which models the dynamics of two species that do not directly compete, and yet interact in biologically important ways. Mutualist pairs, such as plants and mycorrhizal fungi, flowers and pollinators etc., often exemplify this type of interaction pattern because the two species engaging in the mutualistic interaction are so distantly related that the resources they compete for are negligible. Because Travis et al. (2005) showed that baseline reproductive output has a strong effect on the outcome of the evolution of mutualism, I ran simulations manipulating dispersal distance over a range of environmental qualities. For each interaction phenotype (mutualist or non-mutualist), dispersal distance was either fixed over a range of possible values or was evolvable.
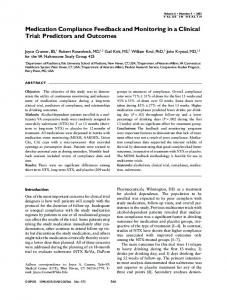
Methods Model The simulation was a stochastic individual based model on dual lattices (Doebeli and Knowlton 1998, Yamamura et al. 2004, Travis et al. 2005). Each species occupies, reproduces, disperses and competes over only one of the two two-dimensional lattices (Fig. 1). The two species interact with each other through pair wise interactions at corresponding coordinates on the two different lattices, but not with individuals of the same species on the same lattice other than competition for offspring establishment space. Only one individual can occupy each cell on each lattice during any iteration. Each lattice was wrapped like a torus to avoid edge effects. Individuals of both species can have one of two interaction phenotypes: mutualist (m) or non-mutualist (n), therefore the species interact symmetrically. The currency of the interaction is measured in gross offspring production (rg). This is a function of the cost to the mutualist (c) for providing a
Species 1
Species 2
Figure 1. Diagram of dual lattice. Species 1 reproduces, disperses and phenotypes compete (filled arrows) on one lattice while species 2 exists entirely on the other. The two species interact in pairs (empty arrow) at corresponding coordinates on the two lattices. This interaction determines the offspring production of interaction partners occupying the cells at each coordinate combination. Increased offspring production increased the probability of that phenotype being awarded occupancy of a cell in the next generation.
benefit to its interaction partner and the benefit (b) received from interacting with a mutualist. The equations describing the four possible interaction payoffs are given in Table 1. The model sets up a classic prisoner’s dilemma with the relative payoff inequality being nm ⬎mm ⬎nn ⬎mn (Luce and Raiffa 1957). Total offspring production then is the sum of rg and a background environmental quality parameter, ro. While this simulation shares many similarities to previous dual lattice simulations (Doebeli and Knowlton 1998, Yamamura et al. 2004, Travis et al. 2005, 2006, Brooker et al. 2007), there are many important differences. This simulation used discrete generations with the parent cells all dying or being replaced by offspring at the end of each iteration, which is the conservative assumption because overlapping generations theoretically increases the ease with which cooperation evolves (Taylor and Irwin 2000, Travis et al. 2006). Because of this, an explicit death rate was not specified like other simulations of this kind. Another difference was that benefits and costs were measured in actual offspring produced, not frequency of successful reproduction like previous models. This model also introduced more realistic dispersal in that it was not just local (nearest neighbor) or global (random dispersal anywhere on the lattice). Dispersal away from the parent cell was simulated by adding values chosen randomly from a normal distribution with a mean of zero and a standard deviation equal to a dispersal phenotype variable (d) to the x- and y-coordinate values of the parent location (all random numbers were generated using Marsaglia’s ziggurat algorithm with a period of approximately 264, Marsaglia and Tsang 2000). Initially, dispersal was fixed (d ⫽ 1, 2, 3, 4, or 5) for each interaction type and symmetrical across lattices. Pair wise combinations of dispersal and interaction types were run testing for the stability of mutualism at each of Table 1. The interaction payoffs for mutualists (m) and non-mutualists (n) in terms of gross offspring production (rg) minus the cost to the mutualist (c) for providing a benefit (b) to its interaction partner, where ro is the baseline offspring production without any interaction based on the environmental quality. Interaction partner Focal individual m n
m
n
rg ⫽ ro ⫹ b – c rg ⫽ ro ⫹ b
rg ⫽ ro – c rg ⫽ ro
443
those parameter combinations. Dispersal was then allowed to evolve along with mutualism by randomly assigning each individual in the population a dispersal value between 0 and 5 chosen from a uniform distribution and rounded to the ten-thousandths place at the beginning of each run. To confirm that starting conditions did not confound the results, variation was also added to the population through a mutational process in separate runs. The rate of mutation was 0.01 for all simulations. The size of each mutation was selected randomly from a normal distribution with a mean of zero and a standard deviation of one. Using these mutation based simulations, a cost of dispersal (χ) was added to the model. The reproductive output after including the cost of dispersal (rχ) was calculated by subtracting an individual’s dispersal value scaled by χ from the gross reproductive output of that individual (rχ ⫽ rg – χ ⫻ d). Therefore, the longer an individual’s average dispersal, the fewer offspring an individual could potentially produce. Parameter combinations including costs were replicated three times using eight different values of χ (2, 1, 0.5, 0.333, 0.25, 0.2, 0.1, or 0.05) at r0 ⫽ 1. However, aside from the runs including costs, because the evolution of dispersal results using a mutational process to generate variation were qualitatively similar to the simpler fixed runs, they are not reported here. All simulations were run on 50 ⫻ 50 square lattices for 500 generations, at the end of which, all measured values showed some stochastic variation around an equilibrium population mean. Simulations with up to 200 ⫻ 200 sized lattices and up to 2000 generations were run, however the results were not qualitatively different from the smaller, shorter runs presented here. Parameter values were set to b ⫽ 10, c ⫽ 1 (following Yamamura et al. 2004) for all runs. At the start, lattices were completely filled and interaction
Dispersal parameter (dn) non-mutualist
r0 = –1
phenotypes (m and n) were randomly assigned in equal frequencies. The environmental quality parameter, ro, which is essentially the environmentally induced background reproductive potential, ranged between –1 and 2 since previous studies have shown that it can have an important effect on the stability of mutualism (Travis et al. 2005, 2006). Competition was modeled through the assignment of cells in the next generation from competing offspring. In the case when more than one offspring attempted to colonize a cell the cell was awarded stochastically with a frequency equal to the relative proportion of offspring vying for the cell from each parent. For instance, if 10 offspring disperse into the same cell, five from parent A, three from parent B, and two from parent C, then an offspring from parent A will be awarded the cell 50% of the time, offspring from parent B 30% of the time and offspring from parent C 20% of the time. All simulations were written in MATLAB R14 SP3. GLM models with lattice and environmental quality as fixed effects were used to test statistical differences in the response variables mean dispersal value and mean frequency of mutualism with Tukey tests for pair wise mean comparisons. All statistical analyses were performed in MINITAB 14. Best-fit curves were plotted using MS Excel 2003.
Results Evolution and maintenance of mutualism with different dispersal distances I found stable mutualism in poor baseline environmental quality with all dispersal phenotype combinations (ro ⫽ –1, Fig. 2). In high quality environments (ro ⫽ 2), non-mutualists
r0 = 0
Frequency of mutualism
5
1.0
4
0.9
3
0.8
2
0.7
1
0.6 r0 = 1
0.5
r0 = 2
5
0.4
4
0.3
3
0.2
2
0.1
1
0.0 1
2
3 4 5 2 1 3 4 Dispersal parameter (dm) mutualist
5
Figure 2. The equilibrium frequency of mutualism after 500 generations given fixed dispersal distance values for mutualists (dm) and nonmutualists (dn). The panels represent four levels of baseline environmental quality (r0 ⫽ –1, 0, 1 and 2). Each square represents a dispersal parameter combination. The grey scale corresponds to the average frequency of mutualism (white being fixed for mutualism, black being fixed for non-mutualism) after five replicate runs for a given combination of dispersal parameters. Dispersal was symmetrical between species (lattices).
444
dominated and eliminated mutualists from both lattices. Between these two extremes, mutualists and non-mutualists coexisted. In lower quality environments (ro ⫽ –1 and 0), mutualism always fixed on one of the two lattices (Fig. 3a, all lattices that had non-mutualists go extinct were designated lattice 1 for the sake of more informative graphical representation. Mutualism did not fix on the same lattice in all runs.). On the other lattice, mutualists and non-mutualists coexisted. At ro ⫽ 1, mutualists and non-mutualists coexist on both lattices as long as dispersal distance is short (Fig. 2, 3a). Evolution of dispersal distance with the evolution of mutualism When dispersal distance was allowed to evolve (values of d between 0 and 5), average dispersal of mutualists was significantly shorter than non-mutualists (Table 2, LS means for mutualists and non-mutualists were 1.935 (SE ⫽ 0.211) and 3.334 (SE ⫽ 0.211) respectively, GLM: F1,64 ⫽ 21.94, p ⬍ 0.0001). There was also a significant interaction between mutualism and environmental quality for predicting evolved mean dispersal distance (GLM: F3,64 ⫽ 21.65, p ⬍ 0.0001). The effect of environmental quality on dispersal distance for non-mutualists was shorter dispersal evolving in ro ⫽ 2 when compared to ro ⫽ –1 and 0 (Fig. 3b, post hoc Tukey test: ro ⫽ 2 vs ro ⫽ –1, p ⫽ 0.01; ro ⫽ 2 vs
Frequency of mutualism
(a)
ro ⫽ 0, p ⫽ 0.039). For mutualists, dispersal evolved significantly longer in ro ⫽ 0, than in either ro ⫽ –1 or 1 (post hoc Tukey test: ro ⫽ 0 vs ro ⫽ –1, p ⬍ 0.0001; ro ⫽ 0 vs ro ⫽ 1, p ⫽ 0.0003). Also, mutualist dispersal when ro ⫽ 1 was significantly shorter than in ro ⫽ –1 environments (post hoc Tukey test: ro ⫽ –1 vs ro ⫽ 1, p ⬍ 0.0001). In all previously reported results, the cost of dispersal (χ) was zero. However, as the cost of dispersal is increased, the magnitude of the difference between the evolved dispersal values of mutualists and non-mutualists decreases (Fig. 4). With a cost of dispersal included, mutualism is still the strongest predictor of evolved dispersal distance (Table 3, GLM: F1,64 ⫽ 455.72, p ⬍ 0.0001), however, cost is also a strong predictor (GLM: F7,64 ⫽ 104.53, p ⬍ 0.0001). There was also a significant interaction between mutualism and cost of dispersal (GLM: F7,64 ⫽ 80.40, p ⬍ 0.0001). As cost of dispersal increased, the mean frequency of mutualism across both lattices increased (Fig. 4, R2 ⫽ 0.942, best fit curve: y ⫽ –0.0849x2 ⫹ 0.3988x ⫹ 0.2437).
Discussion The evolution and maintenance of cooperation requires that cooperative phenotypes tend to interact with other cooperative phenotypes, thereby generating a phenotypic covariance.
1 Frequency of mutualism (lattice 1) Frequency of mutualism (lattice 2)
0.75
0.5
0.25
0 –1
Mean dispersal value
(b)
0
1
2
6 5 4
Average dispersal of nonmutualists (lattice 1)
3
Average dispersal of mutualists (lattice 1)
2
Average dispersal of nonmutualists (lattice 2)
1
Average dispersal of mutualists (lattice 2)
0
–1
0 1 Environmental quality
2
Figure 3. (a) The equilibrium frequency of mutualism after 500 generations with evolvable dispersal over four baseline environmental qualities. Solid bars represent species 1 (which was assigned to whichever lattice fixed for mutualism in a given run), while striped bars represent species 2; (b) The evolved dispersal distance after 500 generations over four baseline environmental qualities. Solid and striped bars represent the same as above, while black represents non-mutualists and grey represents mutualists. Whiskers represent standard errors. When one of the phenotypes went extinct on one of the lattices but not the other, those values were designated lattice 1 for the sake of meaningful graphical representation. Non-mutualists did not go extinct exclusively on the same lattice in all runs.
445
Table 2. GLM analysis of variance for evolved mean dispersal distance with mutualism phenotype, lattice identity, and environmental quality as predictors. Source
DF
Seq SS
Adj SS
Adj MS
F
p
Lattice identity Enviromental quality Mutualism phenotype Lattice ⫻ Environment Lattice ⫻ Mutualism Environment ⫻ Mutualism Lattice ⫻ Environment ⫻ Mutualism Error Total
1 3 1 3 1 3 3 64 79
0.455 13.772 39.128 1.206 0.002 115.806 4.431 114.126 288.927
0.455 13.772 39.128 1.206 0.002 115.806 4.431 114.126
0.455 4.591 39.128 0.402 0.002 38.602 1.477 1.783
0.26 2.57 21.94 0.23 0.00 21.65 0.83
0.615 0.062 0.000 0.878 0.974 0.000 0.483
Mutualism and altruism are two distinct forms of cooperation, the former being the net mutually beneficial interaction between individuals of different species, with the later being the net mutually beneficial interaction between individuals of the same species (Boucher et al. 1982). While many of the dynamics can easily be translated between the two processes, mutualism is an essentially ecological interaction. The evolutionary maintenance of mutualism requires the covariance of phenotypes not only within species, but also between species (Frank 1994). If mutualists are replaced by non-mutualist in one of the two interacting species, the system reduces to the simpler case of altruism, and can be maintained by a covariance of cooperative phenotypes within a single species. One way of generating the necessary covariance is with spatial structure of both species’ populations by limited dispersal (Nowak and May 1992, Doebeli and Knowlton 1998, Killingback et al. 1999, Sicardi et al. 2009). When mutualisms rely on limited dispersal to generate the spatial structure required to maintain the mutualism, the selective advantage associated with increasing dispersal distance constitutes a potential threat to their stability. In this study, I found that when both mutualism and dispersal distance were allowed to evolve, non-mutualists phenotypes evolved a long distance dispersal strategy, while mutualists evolved a short dispersal strategy, even though shorter dispersal is selectively inferior in the absence of mutualism phenotypes. This selective sorting of traits into suites allows for the coexistence of both mutualists and non-mutualists under certain environmental qualities (Fig. 2). I found stable mutualism in poor baseline environmental quality and non-mutualists dominating the high quality environments, regardless of dispersal phenotype, with coexistence at intermediate environmental quality, as shown previously (Callaway et al. 2002, Travis et al. 2005, 2006). In lower quality environments, mutualism always went to fixation on one of the two lattices. This pattern extrapolated to an environment with heterogeneous quality should generate rolling patches of mutualist of one or the other species which would be invaded by non-mutualists in nearby higher quality environment patches, or similar quality environments nearby that the other species fixed for mutualists. An intriguing avenue of future work would be to test whether this local turnover of mutualists can lead to global stability of mutualism in heterogeneous environments. When mutualism fixes on one of the two lattices, the results essentially recover previous studies looking at altruism (Koella 2000). In these cases, the dynamics of the 446
mutualism reduces to altruism and are exactly analogous to shared resource models of altruism since the cooperative trait is effectively reciprocated within species indirectly by altering the density and location of individuals of the other species on the other lattice, which are all mutualists. Here, instead of cooperators releasing a shared resource into the environment that can be used by any local individuals, cooperators foster higher densities of mutualists around the corresponding coordinates of their cell on the other lattice by increasing the reproductive output of mutualist interaction partners on the other lattice. Like the shared resource examples, noncooperators can exploit the shared resource, in this case higher local densities of mutualist phenotypes on the other lattice, without paying the cost. Conversely, cooperators return the favor by increasing the density of mutualists on the other lattice around their own cell. In fact, in lower quality environments, non-cooperators strengthen the effect by actively eliminating
Figure 4. The mean evolved dispersal value after 500 generations over a range of dispersal costs for mutualists (open circles) and nonmutualists (filled circles) at r0 ⫽ 1. Each of the five replicates per parameter combination is represented by a single point. The thin black line represents the best-fit curve for mean dispersal in mutualists (R2 ⫽ 0.528, y ⫽ 0.8467x-0.1488) while the thick black line represents the best-fit curve for non-mutualists (R2 ⫽ 0.925, y ⫽ 7503x-0.7058). Gray filled circles represent the mean frequency of mutualism across both lattices after 500 generations. The solid gray line represents the best-fit curve for mean frequency of mutualism across both lattices (R2 ⫽ 0.942, y ⫽ -0.0849x2 ⫹ 0.3988x ⫹ 0.2437).
Table 3. GLM analysis of variance for evolved mean dispersal distance with the cost of dispersal, mutualism phenotype, and lattice identity as predictors. Source
DF
Seq SS
Adj SS
Adj MS
F
p
Cost of dispersal Mutualism phenotype Lattice identity Cost ⫻ Mutualism Mutualism ⫻ Lattice Cost ⫻ Lattice Cost ⫻ Mutualism ⫻ Lattice Error Total
7 1 1 7 1 7 7 64 95
86.5373 53.8976 0.0028 66.565 0.0149 0.2332 0.1134 7.5692 214.9334
86.5373 53.8976 0.0028 66.565 0.0149 0.2332 0.1134 7.5692
12.3625 53.8976 0.0028 9.5093 0.0149 0.0333 0.0162 0.1183
104.53 455.72 0.02 80.4 0.13 0.28 0.14
0.000 0.000 0.877 0.000 0.724 0.959 0.995
mutualists from the other lattice by reducing their growth rate below 1. Also in agreement with previous studies, I found cooperation to be negatively correlated with dispersal distance (Koella 2000, Le Galliard et al. 2005). Though, this is the first study to show the correlation in a mutualistic system. Also, this is the first study to demonstrate incremental evolution of decreasing dispersal distance with mutualist phenotypes and increasing distance with non-mutualist phenotypes. It is interesting to notice that when there is coexistence on both lattices selection for shorter dispersal by mutualists is strongest (Fig. 3b). For non-mutualists, increasing dispersal distance increases their ability to find patches of mutualists. Increased dispersal distance also reduces the overexploitation of high density mutualist patches, which results in local extinction of the non-mutualist at low environmental qualities. Reducing dispersal distance is only advantageous to mutualists when there are non-mutualists present in both species. This is evident when non-mutualists go extinct on one lattice and dispersal for the mutualists on the lattice fixed for mutualism is not particularly different than dispersal on the lattice with coexistence and appears to be neutral even though the average dispersal distance for the remaining non-mutualists continues to increase. As baseline environmental quality increases, offspring production increases, and therefore the intensity of local density regulation increases. Increased local density increases the benefits of dispersal, thereby further undermining the mutualists’ ability to invade higher quality environments. Mutualists are also less successful in high quality environments partially because the benefit they receive from the mutualistic behavior becomes a relatively smaller portion of their total reproductive output as environmental quality increases. However, the fact that mutualists did not evolve dispersal distance as long as non-mutualists, particularly in the species that fixed for mutualism, is evidence that the mutualism phenotype is able to compensate for the negative effects of local density regulation (Platt and Bever 2009). Though, this trend it probably dependent on there being empty space in the model. Even in the absence of non-mutualists, mutualists would benefit from creating clusters in space since they have a higher reproductive output when interacting with each other than alone. This would be an interesting direction to take the model in future work. The evolved difference between mean dispersal distance of mutualists and non-mutualists is dependent on the
assumption of a low cost of dispersal. However, that pattern disappears when the cost of each additional unit of dispersal distance costs more than roughly one third of an offspring (Fig. 4). At least for plants, it seems that dispersal structures can exceed that level of cost (Lord and Westoby 2006). That said, the inclusion of a cost of dispersal actually facilitates the stability of mutualism by setting an upper limit to the evolved dispersal distance for non-mutualists. This effectively pushes the community further into the lower left corner of Fig. 2 where both mutualists and non-mutualists have relatively short dispersal. It is interesting to note that at high cost of dispersal mutualists actually evolved slightly higher mean dispersal values. This switch coincided with the mean frequency of mutualism in the system exceeding 0.5, which makes very good sense (Fig. 4). If dispersal is costly, then there is no incentive for non-mutualists to pay that high cost when they have a better than random chance of finding a mutualist nearby. The selective feedback between traits and the resulting sorting of traits into suites can potentially create distinct and complex polymorphisms which could lead to the canalization of life history traits into holistic life history strategies. For instance, the tradeoff between longevity and reproductive rate would be another life history character that would be expected to sort with mutualism and dispersal. As long as there is some spatial heritability of the mutualism trait, increasing longevity would hypothetically tend to promote mutualism by increasing the fidelity of good interaction partner matches. Adding this tradeoff to the current work would be a promising future direction, particularly considering that similar models have found that the evolution of long dispersal sorts with increasing longevity, while decreasing longevity associated with short dispersal (Dytham and Travis 2006). Since other work has shown that increasing longevity can foster mutualism, it would be interesting to see how the conflict between the selective forces for longevity and dispersal play out in the context of the evolution and maintenance of mutualism. The complex selective feedback between interacting life history traits can have important implications for many problems in both evolution and ecology.
Acknowledgements – I thank J. Bever, T. Platt and the Bever/Schultz lab group for comments on this article. I acknowledge support from NSF grant no. DEB – 0919434.
447
References Axelrod, R. and Hamilton, W. D. 1981. The evolution of cooperation. – Science 211: 1390–1396. Bever, J. D. et al. 2009. Preferential allocation to beneficial symbiont with spatial structure maintains mycorrhizal mutualism. – Ecol. Lett. 12: 13–21. Boucher, D. H. et al. 1982. The ecology of mutualism. – Annu. Rev. Ecol. Syst. 13: 315–347. Briggs, C. J. and Hoopes, M. F. 2004. Stabilizing effects in spatial parasitoid–host and predator–prey models: a review. – Theor. Popul. Biol. 65: 299–315. Brooker, R. W. et al. 2007. Modelling species’ range shifts in a changing climate: the impacts of biotic interactions, dispersal distance and the rate of climate change. – J. Theor. Biol. 245: 59–65. Callaway, R. M. et al. 2002. Positive interactions among alpine plants increase with stress. – Nature 417: 844–848. Doebeli, M. and Knowlton, N. 1998. The evolution of interspecific mutualisms. – Proc. Natl Acad. Sci. USA 95: 8676–8680. Dugatkin, L. A. 1997. Cooperation among animals: an evolutionary perspective. – Oxford Univ. Press. Dytham, C. and Travis, J. M. J. 2006. Evolving dispersal and age at death. – Oikos 113: 530–538. Frank, S. A. 1994. Genetics of mutualism: the evolution of altruism between species. – J. Theor. Biol. 170: 393–400. Gadgil, M. 1971. Dispersal - population consequences and evolution. – Ecology 52: 253–261. Hamilton, W. D. and May, R. 1977. Dispersal in stable habitats. – Nature 269: 578–581. Hanski, I. 2008. Spatial patterns of coexistence of competing species in patchy habitat. – Theor. Ecol. 1: 29–43. Hauert, C. and Doebeli, M. 2004. Spatial structure often inhibits the evolution of cooperation in the snowdrift game. – Nature 428: 643–646. Huffaker, C. B. 1958. Experimental studies on predation: dispersion factors and predator–prey oscillations. – Hilgardia 27: 343–383. Killingback, T. et al. 1999. Variable investment, the continuous prisoner’s dilemma, and the origin of cooperation. – Proc. R. Soc. B 266: 1723–1728.
448
Koella, J. C. 2000. The spatial spread of altruism versus the evolutionary response of egoists. – Proc. R. Soc. B 267: 1979–1985. Le Galliard, J. et al. 2005. Adaptive evolution of social traits: origin, trajectories and correlation of altruism and mobility. – Am. Nat. 165: 206–224. Lion, S. and van Baalen, M. 2008. Self-structuring in spatial evolutionary ecology. – Ecol. Lett. 11: 277–295. Lord, J. M. and Westoby, M. 2006. Accessory costs of seed production. – Oecologia. 150: 310–317. Luce, R. D. and Raiffa, H. 1957. Games and decisions: introduction and critical survey. – Wiley. MacArthur, R. H. 1958. Population ecology of some warblers of northeastern coniferous forests. – Ecology 39: 599–619. Marsaglia, G. and Tsang, W. W. 2000. The ziggurat method for generating random variables. – J. Stat. Software 5: 1–7. Nowak, M. A. and May, R. M. 1992. Evolutionary games and spatial chaos. – Nature 359: 826–829. Platt, T. G. and Bever, J. D. 2009. Kin competition and the evolution of cooperation. – Trends Ecol. Evol. 24: 370–377. Sicardi, E. A. et al. 2009. Random mobility and spatial structure often enhance cooperation. – J. Theor. Biol. 256: 240–246. Taylor, P. D. 1992. Altruism in viscous populations - an inclusive fitness model. – Evol. Ecol. 6: 352–356. Taylor, P. D. and Irwin, A. 2000. Overlapping generations can promote altruistic behavior. – Evolution 54: 1135–1141. Travis, J. M. J. et al. 2005. The interplay of positive and negative species interaction across an environmental gradient: insights from an individual-based simulation model. – Biol. Lett. 1: 5–8. Travis, J. M. J. et al. 2006. The distribution of positive and negative species interaction across environmental gradients on a duallattice model. – J. Theor. Biol. 241: 896–902. Trivers, R. L. 1971. The evolution of reciprocal altruism. – Q. Rev. Biol. 46: 35–57. van Baalen, M. and Rand, D. A. 1998. The unit of selection in viscous populations and the evolution of altruism. – J. Theor. Biol. 193: 631–648. Wilson, D. S. et al. 1992. Can altruism evolve in purely viscous populations? – Evol. Ecol. 6: 331–341. Yamamura, N. et al. 2004. Evolution of mutualism through spatial effects. – J. Theor. Biol. 226: 421–428.