Semi-automatic Coastline Extraction Method Using Synthetic Aperture Radar Images Heein Yang*, Dal-Guen Lee**, Tu-Hwan Kim**, Josaphat Tetuko Sri Sumantyo***, Jae-Hyun Kim*, *Department of Electrical Engineering, Ajou University, Won-Cheon Hall 331, San5 Wonchun-Dong Youngtong-Gu Suwon, Korea 443-749 **Department of Space Electrical and Information Engineering, Ajou University, Pal-Dal Hall 902, San5 Wonchun-Dong Youngtong-Gu Suwon, Korea 443-749 ***Center for Environmental Remote Sensing, Chiba University, 1-33 Yayoi, Inage, Chiba 263-8522 Japan
[email protected],
[email protected],
[email protected],
[email protected],
[email protected]
Abstract— Coastline is the boundary that discriminates the land and sea area. Originally, to utilize the coastline information, optical images from air-borne or space-borne systems are used. Due to manual interpretation from optical images, conventional coastline extraction method has several error. This paper proposes semi-automatic coastline extraction method using Synthetic Aperture Radar (SAR) images to reduce these errors. SAR is a platform on-board active sensor which can observe Earth day and night regardless of the weather condition. SAR provides high-resolution images for variety of applications in remote sensing field such as climate change research, surveillance imaging, geoscience, and etc. Using the phase information in SAR image data, we detect and measure the coherence between land and sea area, finally get the coastline information. Keywords— Interferometry, Synthetic Aperture Radar, Coastline extraction, Remote sensing, SAR image
I. INTRODUCTION Synthetic Aperture Radar (SAR) is an active sensor that uses microwave to detect the target from remote area. It usually loaded on a moving platform such as satellite, aerial vehicle, and UAV and acquires the image of target while moving through its flight path. SAR sensor first transmits the microwave to the target on ground and receives the back scattered wave from target. Received pulse then transformed into single look complex (SLC) image which is grey-scale ordinary SAR image. By using microwave with its wavelength is 1 – 1000mm, SAR sensor can be operated regardless of the weather condition. Furthermore, it provides high-resolution two-dimensional images independent from daylight and cloud coverage. Due to its property, SAR is recognized as a powerful surveillance system. Based on that SAR offers high-resolution images of target, this paper proposes the coastline extraction algorithm using SAR images. Coastline denotes the boundary that discriminates the land and sea area. Also coastline is, so to speak, the most information for country to determine the territory and important to make an integrated coastal area management plan. Conventional coastline extraction method
ISBN 978-89-968650-2-5
uses optical images from aerial vehicles or satellites from remote area and due to the wave length of visible light is short to penetrate the clouds of fogs near coastal area, detecting the coastline whenever it needed is hard. The most problems of conventional coastline extraction method would be the error occurred from manual interpretation of optical images, the property of optical images that is dependent to weather conditions, and high involvement of experts (cartographers) to extract the coastline information. Semi-automatic coastline extraction method proposed in this paper would reduce the time spent on conventional coastline extraction method. The object of this paper is to extract the coastline of interest from SAR images to increase the efficiency in the sense of time and precision. Interferometry SAR (InSAR) or SAR interferometry (SARIF) method is introduced to compare the coherence information between images acquired from SAR sensor. When the coherence information are compared between land and sea area, since the land-area is highly stationary as opposed to sea area, coherence information derived from SAR interferometry can determine the coastline. In Section II, the previous works from conventional coastline extraction method and other papers using SAR images to extract coastline will be introduced. Section III, the basic idea of SAR data acquisition and main idea of this paper, interferometry technique, and the flow of proposed coastline extraction method will be introduced. Finally, Section IV will draw the conclusion of this paper. II. PREVIOUS WORK The conventional coastline extraction was done with highresolution optical images and performed for cartographic applications [2]. It usually takes a lot of time to extract the information from coastline. Moreover, coastline changes frequently due to the natural events such as tidal waves, typhoons, and etc., therefore, semi real-time coastline extraction method is required when needed. Papers [2] and [3] use InSAR technique that uses two or more SAR images to acquire coherence image. Due to SAR images contain heavy textural information from the target in
678
February 16~19, 2014 ICACT2014
interest and provide high-resolution applications on SAR images are available.
images,
various
A. Conventional Extraction method The simplified flow of conventional coastline extraction method can be defined as follow. First, appropriate images are needed to be acquired. Here, the term appropriate means clear, cloud-free, and high-resolution images. After the image acquisition, it is processed with specific working tools. Then cartographers interpret the images. To extract the coastline with conventional methods, highresolution aerial images are used. The aerial image denotes a visualized image from optical sensor. Usually, to get the highresolution and appropriate image, weather conditions need to be considered such as clouds because when the weather condition is not good, the optical sensor cannot penetrate the clouds and so on. Due to the wavelength of visible light that cannot be operated in night time and bad weather, the optical sensor hardly deal with a prompt response to the change in coast area. Furthermore, it requires high time cost and involvement with experts are needed. Due to the manual interpretation of processing, the final products of the coastline extraction are easily affected by several errors. B. Coastline Extraction Using SAR images The edge detection algorithm using wavelet transform on SAR images are introduced in [8]. It uses single SAR image to measure coastline in interest. Usually, as the sea area in SAR images are represented as black because the back-scattering coefficient is much lower than land, it discriminates the sea and land area using wavelet transform. This simple and fully automatic algorithm can enhance the time cost on extracting compared to conventional method. However, speckle noise on SAR images make ambiguity when segmenting the boundary of coastline. InSAR technique using coherence information for various applications is well defined in [1] and [9]. With this technique, [12] introduces the method that compares the coherence between acquired images from slightly different positions and time. This paper highlights the coherence information in land area hardly change when there are no land deformations. Though this method enhance the resolution of boundary, it also effected by speckle noise on image. III. METHODOLOGY The coastline extraction method proposed in this paper is done with InSAR processing that can express the coherence information between two or more images. InSAR is an imaging technique for measuring the topography of a surface, its changes over time, and other changes in the detailed characteristics of the surface [6]. This technique overlaps interferometry map on the SLC image to analyse the coherence information. We compare two images from same area, Pyeong-yang, North Korea, with satellite ALOS PALSAR. Comparing two images, if there is no or little change on target area, the value of coherence level
ISBN 978-89-968650-2-5
will be high which means there are no or little change on the target. On the other hand, in the case of coastline due to the dramatic changes in coast area, the coherence level will be lower than land area. We assume that there is no big land deformation between two images. TABLE 1. SAR IMAGES FOR THE EXTRACTION OF THE COASTLINE
Master Slave
Satellite ALOS PALSAR ALOS PALSAR
Date of acquisition 13 October 2009 16 October 2010
Baseline 2207.7m 2207.7m
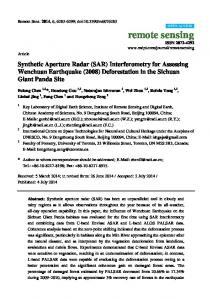
Figure 1. SAR images from ALOS PALSAR
A. Dataset The interferometry zone of study is a coast zone of PyeongYang, North Korea. To extract the coastline from the remote sensed images, raw SAR data from satellite ALOS PALSAR were used. To process the raw SAR data, ENVI SARscape, the processing tool is used. SAR images are acquired by ALOS PALSAR in October 2009 and 2010 which have a spatial resolution of 10 x 10 m. Table. 1 shows the information of the images. B. SAR Data Acquisition SAR is operated with moving on-board platform (e.g. satellites, Unmanned Aerial Vehicles, airplanes, and space shuttles). As it flies along its path (azimuth direction), having equipped its own energy source, it transmits the microwave signal to the target and receives the back-scattered wave successively. Due to the wavelength of microwave relatively longer than visible light, it can be operated at any time regardless of weather conditions. The chirp pulse is used for transmit signal and the backscattered waves are stored in storage bin. Each back-scattered wave contains textural information and is consisted of real and imaginary part of complex data: each data represents ‘I’ (inphase / wave amplitude / intensity / cosine component) and ‘Q’ (quadrature / phase / sine component) data respectively. With 2-D FFT processing, SAR image processor generates the complex radar image (SLC; Single Look Complex). The first requirement to process the interferometry is the availability of two SAR images in complex form. Two SAR images are presented in Figure. 1 (left: master image, right: slave image).
679
February 16~19, 2014 ICACT2014
Master Master image image (SLC) (SLC)
B
Baseline Baseline estimation estimation
DEM DEM generation generation
Interferometry Interferometry generation generation
Median filtering
Edge Edge function function (MATLAB) (MATLAB)
Coastline Coastline image image
Slave Slave image image (SLC) (SLC)
r0 i
Coherence Coherence generation generation
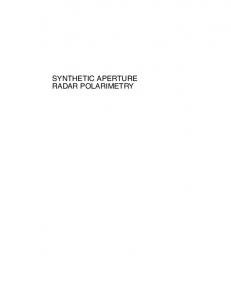
Figure 3. InSAR processing Diagram
r
can sort the jumbled phase out. Slant range
h
r0 that indicates
the range between the target and sensor and baselines is
The one-way range difference r is proportional to the height difference h and B . This proportionality can be
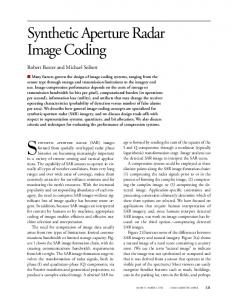
Figure 2. Geometry of SAR interferometry
C. Interferometry SAR sensor transmits and receives microwave signal to detect and measure the target in interest. The signal received from the target contains the information of the target. By applying correlation process to the received data and the reference data (transmit signal), the textural information of target can be extracted. The textural information in each pixel has complex form and this information can be divided into two parts, one is I data and the other is Q data. The I data in each pixel represents the ground reflectivity to microwave and we can visualize the complex radar image with this information. Simply, the interferometric phase is another means of measuring the relative distance. To make the interferogram, first, two images are needed to be aligned which called coregistration. This step is done to maximize the crosscorrelation. Second step is to multiply the images with convolution operator. The main idea in this paper is using interferometry to show the coherence information. SAR interferometry (InSAR) is a well-established remote sensing technique that enables the highly accurate measurement of important geophysical parameters such as surface topography, ground deformation and subsidence as well as glacier movements [1]. This technique used that radar images contain the phase information in its own pixel. The raw SAR data are first processed to SLC image which is grey-scale focused image of back scattered echoes. D. Geometry of SAR interferometry The key idea of interferometry is to compare the phase information of each pixel. The phase of radar signal is the number of cycles of oscillation that the wave executes between the radar and the surface and back again. Actually the collection of random path lengths jumbles the phase of the echo. As the single SAR image cannot utilize the phase information, two images are acquired from slightly different positions as depicted in Figure. 2 because only interferometry
ISBN 978-89-968650-2-5
B .
expressed as [1]
r where
i
B h, r0 sin(i )
(1)
is the incident angle. Here, the phase difference
can be expressed as
m
2
r ,
(2)
where is the wavelength of microwave. From the equation (2) we can understand that a change in the surface height by h causes a change in the range difference by r . It means that if there is no land deformation the phase difference is 0, then the coherence between two images is higher than the place where the land deformation occurs frequently. When the coherence values of each pixel are compared, E. InSAR Processing Flow Interferometry, as it is, means a technique that extracts the information of waves. From the SAR image data in each pixel, we use the phase information (Q data) in radar images. The key idea of interferometry is to compare the phase information of each pixel. To utilize the interferometry on radar complex images, two or more complex radar images that have been acquired form slightly different positions or at different times are needed. Then, by comparing the phase information from the images, we can visualize the InSAR image. The InSAR processing diagram is shown in Figure. 3. The diagram in Figure. 3 depicts the flow chart of InSAR processing. First, a pair of SLC images are aligned to estimate the baseline. This process is done to maximize the crosscorrelation between two images. To generate the interferometry map, Digital Elevation Model (DEM) needs to be generated. The image of DEM is illustrated in Figure. 4. This DEM model will be the reference height information on the image. By combining a pair of SLC images and DEM
680
February 16~19, 2014 ICACT2014
Second, done with computer to evaluate the coastline, the errors occurred from manual interpretation can be reduced. Also, the time cost spent on conventional method reduced. Still the resolution of SAR sensor is worse than optical sensor, as the technology improves, the performance of this method will be enhanced. ACKNOWLEDGMENT This research was supported by NSL(National Space Lab) program through the National Research Foundation of Korea funded by the Ministry of Education, Science and Technology (2011-0030866). REFERENCES [1]
[2] Figure 4. DEM image of the data [3] [4] [5]
[6]
Figure 5. Extracted coastline from the interferometry image
[7]
image, Interferometry map can be made. After this process, we get the coherence image from interferometry map. This image shows the coherence between master and salve images. This coherence image indicates the phase difference value on image. Like land area where there is little change during the time baseline, the coherence level will be high. However, due to the tidal movement, water level change, and such kinds of frequent natural events, the coherence level will show up as dark image. Interferometry and coherence generation processing step can discriminate the boundary of sea area, and to reduce the speckle noise on SAR image, the median filtering process is applied. Finally, to extract the coastline from the image, edge function in MATLAB is used. Figure. 5 is the final result of coastline. The red line on Figure. 5 indicates extracted coastline from the two radar complex images.
[8]
[9]
[10]
[11] [12]
A. Moreira, P. P. Iraola, M. Younis, G. Krieger, I. Hajnsek, and K. P. Papathanassiou, “A tutorial on synthetic aperture radar”, IEEE Geoscience and Remote Sensing Magazine, 1st ed., Apr. 2013. S. Dellepiane, R. De Laurentiis, F. Giordano, “Coastline extraction from SAR images and a method for evaluation of the coastline precision”, Pattern Recognition Letters, vol. 25, pp. 1461-1470, Aug. 2004. A. Hein, Processing of SAR data: fundamentals, signal processing, interferometry, 1st ed., Berlin, Germany: Springer, 2010. J. Lee, I. Jurkevich, “Coastline Detection and Tracing in SAR Images”, IEEE Trans. Geosc. Rem. Sens., vol. 28, No. 4, pp. 662-668. H.J. Kim, M. Lee, “Analysis on Korea Coastal Pollution Response Map”, The Korean Cartographic Association Journal, vol. 9, pp 39-44, 2009. H. Maitre, Processing of Synthetic Aperture Radar Images, 1st ed., New Jersey, US: Wiley. 2001. D. Massonnet, J. C. Souyris, Imaging with Synthetic Aperture Radar, 1st ed., NW, US: EPFL Press, 2008. M. T. Alonso, J. J. Mallorqui, “Edge Enhancement Algorithm Based on the Wavelet Transform for Automatic Edge Detection in SAR Images”, IEEE Transactions on Geoscience and Remote Sensing, vol. 49, No. 1, pp. 222-235, Jan. 2011. C. Colesanti, J. Wasowski, “Investigating landslides with space-borne Synthetic Aperture Radar (SAR) interferometry”, Engineering Geology, vol. 88, pp. 173-199, Sep. 2006. D. Sandwell, R. Mellors, X. Tong, M. Wei, P. Wessel, “GMTSAR: An InSAR Processing System Based on Generic Mapping Tools”, Scripps Institution of Oceanography Technical Report, pp. 14-19, May. 2011. I. G. Cumming, F. H. Wong, Digital Processing of Synthetic Aperture Radar Data, 1st ed., MA, US, Artech House, 2005. M. Schwabisch, S. Lehener, N. Winkel, “Coastline Extraction Using ERS SAR Interferometry”, Proc. 3rd Symp on Space at the service of our Environment, vol. 3, pp. 1049-1053, May. 1997.
IV. CONCLUSIONS Coastline information is important for land and sea environmental management, military use, terrestrial definition, coastal pollution response, and etc. Conventional coastline extraction method done by manual interpretation with optical images has several errors. Moreover, considering the availability to get clear optical image is not good, this paper proposed the semi-automatic coastline extraction method using SAR images. The contribution of this coastline extraction method is listed below. First, as SAR sensor can acquire high-resolution and weather condition-free images anytime, appropriate response and measurement when the sea climate has natural events can be done with proposed method.
ISBN 978-89-968650-2-5
681
February 16~19, 2014 ICACT2014