RESEARCH ARTICLE
Short-Term Fluctuations in Air Pollution and Asthma in Scania, Sweden. Is the Association Modified by Long-Term Concentrations? Tahir Taj1*, Emilie Stroh1, Daniel Oudin Åstro¨m2,3, Kristina Jakobsson1, Anna Oudin1,3 1 Department of Occupational and Environmental Medicine, Lund University, Lund, Sweden, 2 Centre for Primary Health Care Research, Department of Clinical Science, Malmo¨, Lund University, Lund, Sweden, 3 Department of Occupational and Environmental Medicine, Umeå University, Umeå, Sweden
a11111
*
[email protected]
Abstract Background and aims OPEN ACCESS Citation: Taj T, Stroh E, Åstro¨m DO, Jakobsson K, Oudin A (2016) Short-Term Fluctuations in Air Pollution and Asthma in Scania, Sweden. Is the Association Modified by Long-Term Concentrations? PLoS ONE 11(11): e0166614. doi:10.1371/journal.pone.0166614 Editor: Alexander Larcombe, Telethon Institute for Child Health Research, AUSTRALIA Received: June 7, 2016 Accepted: November 1, 2016 Published: November 18, 2016 Copyright: © 2016 Taj et al. This is an open access article distributed under the terms of the Creative Commons Attribution License, which permits unrestricted use, distribution, and reproduction in any medium, provided the original author and source are credited. Data Availability Statement: Study data of both health out and air pollution is uploaded on Open Science Framework database and can be access using following reference. Taj, Tahir. 2016. “Asthma Study.” Open Science Framework. October 6. osf.io/kescv. Funding: The authors would like to thank FORMAS, The Swedish Research Council for Environment, Agricultural Sciences and Spatial Planning and the Faculty of Medicine, Lund University, Sweden for funding the research project. The funders had no role in study design, data collection and analysis,
Asthma is one of the most common respiratory diseases in the world. Research has shown that temporal increases in air pollution concentrations can aggravate asthma symptoms. The aim of this study was to assess whether individuals living in areas with higher air pollution concentrations responded differently to short-term temporal exposure to air pollution than those living in lower air pollution areas.
Method The study was designed as a case-crossover study in Scania, Sweden. Outcome data was visits to primary health care clinics with asthma as the main complaint during the years 2007 to 2010. Nitrogen dioxide levels were obtained from 21 different air pollution monitoring stations. Short-term exposure was defined as the average concentration four days prior to the visit. Data was pooled for areas above and below a two-year average NO2 concentration of 10 μg/m3, dispersion modelled with an emission database.
Results The short-term association between NO2 and asthma visits seemed stronger in areas with NO2 levels below 10 μg/m3, with an odds ratio (OR) of 1.15 (95% confidence interval (CI): 1.08–1.23) associated with a 10 μg/m3 increase in NO2 compared to areas above 10 μg/m3 NO2 levels, where corresponding OR of 1.09 (95% CI: 1.02–1.17). However, this difference was not statistically significant. (p = 0.13)
Conclusions The study provided some evidence, although not statistically significant, that short-term associations between air pollution and asthma may depend on background air pollution levels. However, we cannot rule out that the association is due to other spatially dependent factors in Scania. The study should be reproduced in other study areas.
PLOS ONE | DOI:10.1371/journal.pone.0166614 November 18, 2016
1 / 16
Short-Term Fluctuations in Air Pollution and Asthma Association Modified by Long-Term Concentration
decision to publish, or preparation of the manuscript. Competing Interests: The authors have declared that no competing interests exist.
Introduction Asthma is one of the most common chronic diseases among adolescents and middle-aged adults, and has become a major public health problem worldwide over the last few decades [1]. The prevalence of asthma in Sweden has stabilized during the last few decades, but is still one of the main public health concerns [2]. In a large population-based study in Sweden, the prevalence of physician diagnosed asthma was 8.3% Of these, 70% were actively using asthma medication for symptom control [3]. A recent multicentre European study has shown that people growing up in rural areas close to livestock had a significantly lower prevalence of asthma compared to those growing up in urban areas [4]. Studies from Africa [5] and South America [6] have also reported similar findings. The main explanation for this difference is likely to be that the evolution of the Western lifestyle has resulted in relatively limited exposure to infectious agents during childhood [7], which expedite atopy by affecting the overall array of commensals and pathogens [8]. Another major difference between urban and rural areas, in terms of asthma risk factors, are air pollution concentrations. Associations between air pollution and asthma are fairly well studied; air pollutants trigger inflammatory response and can act as strong bronchoconstrictors, and thereby exacerbate asthma symptoms [9, 10]. Air pollution levels are associated with increased health care visits due to asthma [11], for both emergency care and hospital admission [11] as well as for antiasthmatic prescription [12]. However, it is more uncertain whether long-term exposure to air pollution is a cause of incident asthma [13–17]. Studies combining short-term and long-term exposure to air pollution are almost entirely lacking. A combined short-term and long-term approach is necessary to investigate if the effect of exposure to elevated levels of air pollutants shortly before an episode of exacerbation of respiratory problems is also dependent on long-term (several years) exposure levels [18]. Indeed, it may be that the burden of asthma exacerbations attributable to air pollution relates not to the triggering per se, but to air pollution increasing the pool of subjects with chronic obstructive diseases [19]. There is therefore a need to understand vulnerability to short-time variations in pollutant levels with respect to long-term exposure levels. The aim of this study was to assess whether individuals living in areas with higher long-term air pollution levels respond differently to a short-term increase in air pollution concentrations than those living in areas with lower long-term air pollution concentrations. The study was performed in an area where pollution levels generally were below or at current air quality guideline levels.
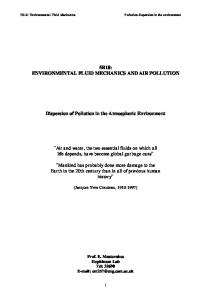
Methodology Study area and population The study was performed in the county Scania, Sweden “Fig 1”. Scania is the southernmost county of Sweden and comprises 33 municipalities with a total population of about 1.25 million people. The population density is highest on the west coast, with its three main cities (Malmo¨, Helsingborg and Lund).
Data Health care registry. Primary health care data was obtained from the Scania health care register database. In Scania, health care registers, along with data relating to inpatient and emergency visits, also include records of primary health care visits. Primary health care records from 2007 to 2010 were extracted from the main dataset using ICD 10 codes for asthma illness (J45 codes) and a Swedish translation of ICD 10 codes (J45-p).
PLOS ONE | DOI:10.1371/journal.pone.0166614 November 18, 2016
2 / 16
Short-Term Fluctuations in Air Pollution and Asthma Association Modified by Long-Term Concentration
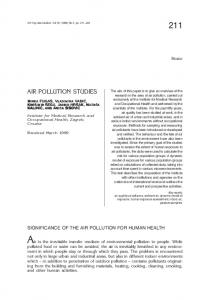
Fig 1. Study area Scania population density map. doi:10.1371/journal.pone.0166614.g001
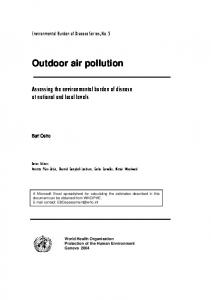
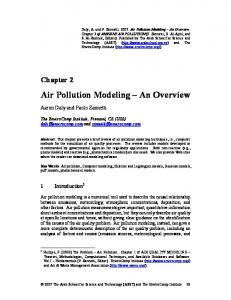
A total of 20,909 first asthma visits during the study period for individuals living in Scania were extracted for 123 primary health care centres (PHCCs). It is important to note that the outcome used was thus not necessarily the first ever asthma visit, but the first asthma visit during the study period. There were nine PHCCs with fewer than 30 visits (a total of 267 visits) that were excluded from the analysis “Fig 2” due to lack of statistical power. Air pollution monitoring stations and dispersion model data. For this study, nitrogen dioxide (NO2) was used as a proxy for air pollution exposure, as a number of studies have shown that NO2 is a good indicator of traffic-related air pollution [20–22]. We had access to hourly values from 21 air pollution monitoring stations in different parts of Scania “Fig 3”. For
PLOS ONE | DOI:10.1371/journal.pone.0166614 November 18, 2016
3 / 16
Short-Term Fluctuations in Air Pollution and Asthma Association Modified by Long-Term Concentration
Fig 2. Dispersion model NO2 levels and sites of air pollution monitoring stations. doi:10.1371/journal.pone.0166614.g002
all monitoring stations, geographical coordinates were obtained. We used only data from urban background air pollution monitoring stations to assign short-term air pollution exposure. NO2 levels for each PHCC were assigned based on proximity to the air pollution monitoring station (ranked based on distance from the clinic). PHCCs with no air pollution station within a 20 km radius were excluded from the study (N = 22) (excluding 6,384 asthma visits). We defined the mean air pollution concentration for each PHCs as the (arithmetic) mean concentration for the exposure period for the closest air pollution monitor. We defined the global mean as the (arithmetic) mean concentration from all air pollution monitoring stations in Scania for the exposure time period. Short-term air pollution exposure was defined as the average NO2 level during the same day as the PHCC visit as well as three days prior to the visit. A GIS-based dispersion model
PLOS ONE | DOI:10.1371/journal.pone.0166614 November 18, 2016
4 / 16
Short-Term Fluctuations in Air Pollution and Asthma Association Modified by Long-Term Concentration
Fig 3. Flow chart showing final sample selection steps. doi:10.1371/journal.pone.0166614.g003
together with an emission database was used to model long-term concentrations of NO2 at the PHCC [23]. Long-term NO2 exposure was defined as the average NO2 level at the PHCC two years prior to the visit.
Statistical analysis Study design. A time stratified case-crossover study design was used [24]. This design is used extensively in environmental studies to analyse the short-term effects of environmental exposure such as air pollutants [25] and temperature [26, 27] on health. This study design compares the exposure prior to a health event with control periods that can be either prior to or after the event. The same individual acts as his or her own control within a short time span, which is why this design adjusts by design for non-time varying confounders at individual level such as gender, education and socioeconomic factors [28]. For each visit, four control periods matched by day of the week were calculated, two prior to the visit and two after, using the same air pollution monitoring station. The total number of first asthma visits selected for final analysis was 13,880 at 88 PHCCs. Detailed descriptions of first visit selection are explained in “Fig 2”.
PLOS ONE | DOI:10.1371/journal.pone.0166614 November 18, 2016
5 / 16
Short-Term Fluctuations in Air Pollution and Asthma Association Modified by Long-Term Concentration
Model 1 was unadjusted with only NO2 as a covariate, model 2 was adjusted for temperature, Humidity and rainfall with smooth functions (natural cubic splines) with 3 degrees of freedom. PM10 was additionally adjusted for in model 3, O3 in model 4 and SO2 in model 5. Model checks were performed using residual deviance, i.e. plotting residuals versus fitted values and checking R2 and calculating AIC. Furthermore, sensitivity analysis was performed using the mean pollutant level for each PHCC instead of the global mean and when not excluding data based on number of visits and gender. All PHCCs were grouped in to two categories of NO2, above and below 10 μg/m3 using long term air pollution exposure i.e two year prior to visit. We also calculated a relative risk ratio between the exposure groups and evaluated the statistical significance of the derived Zscore and corresponding p-value [29]. PostgreSQL 9.1.3 relational database [30] was used for identifying the first asthma visit and calculating short- and long-term NO2 levels for each visit. Data analyses were performed with R version 3.2[31].
Ethics statement Our request for primary health care data was granted after formal scrutiny at the Region Skånes Health Care Databases. In accordance with Swedish law and regulations, we did not seek permission at the Regional Ethical Board at Lund University, since the data granted to us had no personal identification numbers and very limited individual information. It was impossible to identify any individual from our data.
Results The total number of first asthma visits during the study period was 13,880 at 88 PHCC. The mean age of the patients was 46 years (SD: 24), and 7,161 (56.3%) were female. The mean daily first asthma visits for each PHCC ranged from 3 to 319. Descriptive data on daily weather and air pollution levels is given in Table 1. Long-term NO2 levels at PHCCs towards the west coast were higher compared to the east coast “Fig 3”. [In S1 Table and S2 Table, the correlations between pollutants and climate data are reported.] Tables 2 and 3 show pooled unadjusted and adjusted odds ratios for PHCC above and below 10NO2 μg/m3. Odds ratios for each PHCC are plotted in “Figs 4 and 5” and given in Table 4 and also in “S1 Fig and S2 Fig”. A pooled odds ratio adjusting for temperature, humidity, rainfall and other pollutants was calculated for PHCCs with long-term NO2 levels above and below 10 μg/m3. Tables 2 and 3 show detailed steps of the model for pooled analysis. The pooled odds ratios for PHCCs Table 1. Descriptive data on daily weather, air pollution in Scania, Sweden, 2007–2010. Variable
Minimum
25%
Median
75%
Maximum
Mean ± SD
PM10 μg/m3
4.1
12.7
15.6
19.8
46.4
PM2.5 μg/m3
2.9
7.6
9.6
13.0
57.0
10.9 ± 5.5
NO2 μg/m3
0.7
9.7
14.4
60.6
14.3 ± 8.1
O3 μg/m3
20.7
46.3
55.9
65.1
93.2
55.3 ± 13.1
SO2 μg/m3
1.0
2.1
2.6
3.2
6.8
2.7 ± 0.9
19.2
16.7 ± 6.2
Temperature ˚C
-7.0
4.0
8.3
14.1
25.3
8.8 ± 6.5
Humidity %
46.1
67.4
76.0
82.3
94.0
74.2 ± 10.0
Rain mm
0.0
0.0
0.7
2.5
27.4
1.5 ± 2.8
1
9
13
17
38
13 ± 6.6
Asthma visits doi:10.1371/journal.pone.0166614.t001
PLOS ONE | DOI:10.1371/journal.pone.0166614 November 18, 2016
6 / 16
Short-Term Fluctuations in Air Pollution and Asthma Association Modified by Long-Term Concentration
Table 2. Pooled odds ratios (ORs)for Asthma visit with their 95% confidence intervals (CIs) for areas with NO2 below 10 μg/m3. OR
95% CI
P value
Model 1 NO2 only
1.15
1.08–1.23