Research
Short-term plasticity of the visuomotor map during grasping movements in humans Daniel Säfström1 and Benoni B. Edin Physiology Section, Department of Integrative Medical Biology, Umea˚ University, S-901 87 Umea˚, Sweden During visually guided grasping movements, visual information is transformed into motor commands. This transformation is known as the “visuomotor map.” To investigate limitations in the short-term plasticity of the visuomotor map in normal humans, we studied the maximum grip aperture (MGA) during the reaching phase while subjects grasped objects of various sizes. The objects seen and the objects grasped were physically never the same. When a discrepancy had been introduced between the size of the visual and the grasped objects, and the subjects were fully adapted to it, they all readily interpolated and extrapolated the MGA to objects not included in training trials. In contrast, when the subjects were exposed to discrepancies that required a slope change in the visuomotor map, they were unable to adapt adequately. They instead retained a subject-specific slope of the relationship between the visual size and MGA. We conclude from these results that during reaching for grasping, normal subjects are unable to abandon a straight linear function determining the relationship between visual object size and MGA. Moreover, the plasticity of the visuomotor map is, at least in short term, constrained to allow only offset changes, that is, only “rigid shifts” are possible between the visual and motor coordinate systems.
The processes whereby sensory information is used to generate motor commands are known as “sensorimotor transformations.” Typically, they can be formalized in terms of a transformation between different coordinate systems, for instance, the “visuomotor map” transforms information from visual to motor coordinates (Pouget and Snyder 2000). Both long- and short-term plasticity of the visuomotor map has been amply demonstrated, most commonly using optical prisms that distort the visual field (cf. Welch 1978). In this study we have investigated the nature of the “constraints” that may limit the short-term plasticity of the visuomotor map, using adaptation to sensory discrepancies during grasping movements as an experimental paradigm (Säfström and Edin 2004). It has previously been demonstrated that the maximum amplitude of grip aperture during reaching for grasping covaries with object size and that the relationship between object size and the maximum grip aperture is approximately linear (Jeannerod 1984; Marteniuk et al. 1990). The visuomotor map (f) determines the relation between visual coordinates (visual size of object, VO) and motor coordinates (maximum grip aperture, MGA) (Fig. 1A), that is, MGA = f(VO). Since the relationship is linear, it can be expressed as MGA = a + b · VO,
(1)
where a represents the “offset” and b represents the “slope” of the relationship. This visuomotor transformation depends on numerous factors. For instance, increased movement speed (Wing et al. 1986) and reduced lighting (Wing et al. 1986; Jakobson and Goodale 1991) affect the execution of the grasping movement and make the MGA larger, which is usually reflected as an increase in the offset (a in equation 1) and a decrease of the slope (b in equation 1). This strategy compensates for increased end-point variability of the digits during the grasp. In the present study, factors known to alter the end-point variability during execution of the grasp 1
Corresponding author. E-mail
[email protected]; fax 46 90 7866683. Article and publication are at http://www.learnmem.org/cgi/doi/10.1101/ lm.83005.
were held constant (movement speed, lighting conditions, etc.) so that any change in the visuomotor map could be attributed to sensorimotor adaptation that occurred as a result of discrepancies between visual and haptic feedback about object size (Gentilucci et al. 1995; Säfström and Edin 2004). There are no a priori limitations on possible changes in the visuomotor map: any visual coordinate could in principle be mapped onto any motor coordinate. Yet, it seems reasonable to expect constraints with respect to what maps can actually be learned: the more constraints, the less flexible is the visuomotor map. Given that the visuomotor map can be approximated by a linear mathematical function (equation 1), and the finding that the offset parameter (a in equation 1) can be modified as a result of sensorimotor adaptation (Säfström and Edin 2004), three different hypotheses about the flexibility of the visuomotor map seem to encapsulate all possible levels of constraints (Fig. 1B). These hypotheses are analogous to those proposed by Bedford (1989), who studied adaptation during pointing movements.
Minimum constraint hypothesis: Subjects can abandon the linear relationship between visual object size and MGA If individual pairs of visual and motor coordinates are independently associated by learning, almost any visuomotor map would be possible to learn with sufficient practice. Traditionally, sensory recalibration has been compared with Pavlovian and instrumental conditioning, suggesting that individual pairs of visual and motor coordinates is the correct level of analysis (Epstein 1975). This possibility has never been tested during grasping movements. The hypothesis implies that the observed normal linear relation can be replaced by any nonlinear function or that new visuomotor maps may require individual associations between pairs of visual and motor coordinates.
Maximum constraint hypothesis: Subjects can only modify the offset parameter (a in equation 1) We have already demonstrated in a previous study that subjects can modify the offset parameter, a (Säfström and Edin 2004). The
12:67–74 ©2005 by Cold Spring Harbor Laboratory Press ISSN 1072-0502/05; www.learnmem.org
Learning & Memory www.learnmem.org
67
Säfström and Edin
Medium constraint hypothesis: Subjects can modify both the offset and slope parameters (a and b, respectively, in equation 1)
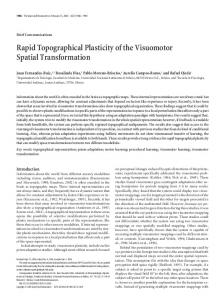
Figure 1. (A) During execution of normal grasping movements, the visuomotor map (f) determines the relation between visual coordinates (VO) and motor coordinates (MGA). This relation is assumed to be continually monitored by feedback. When a discrepancy occurs between visual and motor coordinate systems, this conflict can be resolved by means of adaptation, which implies that the visuomotor map is updated to reflect the new relation between visual and motor coordinates. (B) The normal, unmanipulated, visuomotor map is represented by the thick solid line. The dotted curved line is an example of what the visuomotor map may look like if the linear relationship is abandoned (minimum constraint hypothesis). The thin solid line represents a change in the offset parameter in the visuomotor map (maximum constraint hypothesis), and the striped line represents a change in both the offset and the slope parameter (medium constraint hypothesis). (C) A transparent mirror divided the experimental apparatus into two compartments, one with a bar visible to the subject (visible object), and one with an invisible bar that could be reached by the subject’s right hand (haptic object). The haptic object was painted black and never illuminated. (D) Two single sample trajectories of the tip of the index finger and the thumb when a subject reached for a 50-mm haptic object. Both trajectories depict interpolation “test trials,” one during the increased-size condition (dashed line) and the other during the decreased-size condition (thick solid line). The thin solid line indicates the maximum grip aperture for that particular trial. (E) The upper part of the picture shows the x/y coordinates for the reflex markers as a function of time, and the lower part shows how the MGA was determined in the data files (same trial as the thick solid line in D).
possibility that a is the only parameter that can be changed implies that only “rigid shifts” are possible between the visual and motor coordinate systems (i.e., that the visuomotor map can be modified only by changing the relation between visual and motor coordinates an equal amount within the entire workspace).
68
Learning & Memory www.learnmem.org
An alternative hypothesis, intermediate to (1) and (2), is that the linear relation cannot be abandoned, but that both the offset and the slope can be modified. As opposed to the first hypothesis, this hypothesis implies an inherent linear constraint limiting the flexibility of possible visuomotor maps, but, as opposed to the second hypothesis, both rigid shifts and a “rescaling” may occur between the coordinate systems. This intermediate hypothesis seems plausible if the central nervous system (CNS), for instance, uses a “correlator” that simply attempts to find the best-fitting linear relation between visual and motor coordinate systems (Held 1961). These three hypotheses were tested in two experiments (Fig. 2). In the first experiment we investigated if individual pairs of visual and motor coordinates are associated by learning (as stated by the minimum constraint hypothesis) or if there is a linear constraint when changing the visuomotor map (as stated by the maximum and medium constraint hypotheses). Subjects first made “training trials” to learn new mappings (a new relation) between isolated pairs of visual and motor coordinates. During subsequent “test trials,” we investigated the subjects’ performance when they encountered objects of sizes that did not appear during the training trials. If new mappings were generalized to visual objects of a size intermediate to the sizes of visual objects presented during training, the subjects would be able to “interpolate” in the visuomotor map. Similarly, they would be able to “extrapolate” if new mappings were generalized to visual objects larger or smaller than those presented during training. If the subjects were able to both interpolate and extrapolate, we would conclude that the subjects entertained a continuous function that transforms visual size into a particular grip aperture size. In contrast, if they failed to interpolate and extrapolate, we would conclude that adaptation was specific for the trained visuomotor coordinates. In the second experiment we investigated if only offset changes are possible between the visual and motor coordinate systems (as stated by the maximum constraint hypothesis) or if a higher degree of flexibility is possible (as stated by the minimum and medium constraint hypotheses). Subjects were trained on new mappings that did not correspond to just a change in the offset. In order to learn these mappings, subjects either had to make individual associations between pairs of visual and motor coordinates (i.e., according to the minimum constraint hypothesis) or they had to make a slope change in the visuomotor map (according to the medium constraint hypothesis). Thus, in the first experiment the maximum and medium constraint hypotheses were contrasted against the minimum constraint hypothesis, and in the second experiment the maximum constraint hypothesis was contrasted against the minimum and medium constraint hypotheses. Consequently, if one (and only one) of the proposed hypotheses is correct, then the two experiments in combination would be sufficient to decisively determine which one of them it is.
Results Experiment 1 General grasping behavior during the equal-size condition As expected, all subjects adjusted their maximum grip aperture to the visual size of the object during the reaching phase of the grasping movement (Fig. 3A). The relation was nearly linear for the range of object sizes presented during the first 10 trials of the
Plasticity of the visuomotor map in humans
experimental series (35–65 mm), with a subject-specific slope (across all subjects, 0.85 Ⳳ 0.14, mean Ⳳ SD) and offset (28.6 Ⳳ 11.0).
Predictions
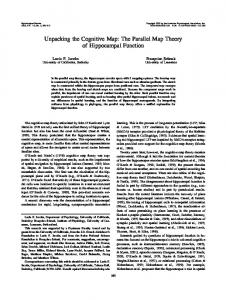
Figure 2. (A) All series in Experiment 1 started with 10 trials with equal visual and haptic object sizes of 35, 42.5, 50, 57.5, and 65 mm in an unpredictable order. Haptic and visual objects are drawn to scale and are represented by filled and open rectangles, respectively. During the following 20 training trials only one visual object (50 mm) was used in the extrapolation series and two visual objects (35 and 65 mm) in the interpolation series. The corresponding haptic object was either 15 mm larger (increased-size condition) or smaller (decreased-size condition) than the visual object (dashed lines close to haptic objects indicates the size of the visual object in the same trials). During the subsequent 30 trials every fifth trial was a test trial in which visual objects of sizes 35, 42.5, 57.5, or 65 mm were presented during the extrapolation series, and visual objects of sizes 42.5, 50, or 57.5 mm during the interpolation series. During these test trials, the visual and the haptic objects were always of equal sizes. (B) The series in Experiment 2 started with 10 trials of equal visual and haptic object size, 35 or 65 mm. In two comparison conditions, the haptic objects then became either 7.5 mm larger (increased-size condition) or smaller (decreased-size condition) than the visual objects. In two test conditions, the subjects were exposed to a “slope change” of the coordinate systems. In the clockwise slope change condition, the 35-mm visual object was associated with a larger haptic object (42.5 mm) and the 65 mm visual object was associated with a smaller haptic object (57.5 mm). In the counterclockwise slope change condition, the 35-mm visual object was associated with a smaller haptic object (27.5 mm) and the 65 mm visual object was associated with a larger haptic object (72.5 mm). In both Experiments 1 (A) and 2 (B), all analyses of the “equal-size condition” were made on the first 10 trials in each series. The first 20 trials of exposure to a size discrepancy were considered as training trials in which subjects were not fully adapted to the size discrepancy, and these trials were excluded from all analyses. During the following 30 trials the subjects were considered to be “fully adapted,” and these trials were included in the analyses. All series ended with 16 trials with equal visual and haptic object size to allow the subjects to readapt to the equal-size condition; these trials were excluded from the analyses. The upper and the lower insets illustrate “offset changes” and “slope changes,” respectively, of the visuomotor map.
At the 11th trial in each series, the haptic object became either 15 mm larger (increased-size condition) or 15 mm smaller (decreased-size condition) than the visual object (cf. Fig. 2A). The fully adapted behavior for the training coordinates during the increased- and decreased-size conditions averaged across subjects is illustrated in Figure 3B. The adapted values for visual objects 35 and 65 mm (circles) were retrieved from the interpolation series and the values for visual object size 50 mm (squares) from the extrapolation series. The maximum and the medium constraint hypotheses both imply that subjects in this situation should be able to perform linear interpolation and extrapolation in the visuomotor map. Accordingly, the predicted relation between MGA and visual object size during the test trials was given by linear regression equations calculated from the fully adapted relationship during the training trials. These functions and 99% confidence intervals are depicted in Figure 3B as the “decreased-size condition” (MGA = 27.1 + 0.78 · VO) and the “increased-size condition” (MGA = 39.0 + 0.81 · VO), respectively. In contrast, the minimum constraint hypothesis implies that training on isolated pairs of visual and motor coordinates induce new mappings only on these coordinates, yielding poor extrapolation and interpolation capabilities. For visual objects not encountered during training, subjects thus were expected to maintain the same relationship between visual object size and MGA as before training, that is, as during the first 10 trials of each series. Accordingly, the behavior according to the minimum constraint hypothesis could be predicted based on a linear regression analysis of the first 10 trials; this linear regression equation (MGA = 28.6 + 0.85 · VO), and its 99% confidence intervals are depicted as “equal-size condition” in Figure 3B.
Actual mappings between visual and motor coordinates on the test trials Figure 4 illustrates the predictions and the actual values for the test trials. The minimum constraint hypothesis obviously failed to predict the observed behavior: There was a highly significant difference between the three conditions both during interpolation (Fig. 4A) (F(2,14) = 239.2, p < 0.00001) and extrapolation (Fig. 4B) (F(2,14) = 68.11, p < 0.00001). There was no significant interaction between the three conditions and size of visual object, neither during interpolation (F(4,28) = 0.401) nor extrapolation (F(6,42) = 1.263). To further explore this issue, four different linear regression equations were calculated from the actual results during test trials. There was no significant difference between the offset values in these regressions and those predicted by the medium and maximum constraint hypotheses (F (2,14) = 2.37, p = 0.13, for the decreased-size condition; and F(2,14) = 0.86, p = 0.44, for the increased-size condition). The observed values were therefore not significantly different from those expected given the maximum and the medium constraint hypotheses. Thus, the subjects seemed to entertain a linear function that allowed them to adjust their MGA by means of interpolation and extrapolation. When questioned after the experiment, only three of the eight subjects were able to report that size discrepancies between the seen and the grasped objects had occurred.
Experiment 2 Grasping behavior during the equal-, increased-, and decreased-size conditions All subjects in Experiment 2 also adjusted their maximum grip aperture to the visual size of the object during the reaching phase
Learning & Memory www.learnmem.org
69
Säfström and Edin
that the magnitude and direction of any offset changes are unimportant for the evaluation of the hypothesis). The 99% confidence intervals for this prediction are depicted as the shaded area in Figure 5C (with the maximum constraint hypothesis, the same prediction applies to both clockwise and counterclockwise slope change).
Actual mappings between visual and motor coordinates in the testing series
Figure 3. (A) Grasping behavior of individual subjects during the first 10 trials in Experiment 1 (thin lines). The heavy solid line represents the mean across all eight subjects. The dashed line at lower right represents the 1:1 relation between MGA and object size. (B) Data from the fully adapted behavior (averaged across subjects) for the training coordinates during the increased- and decreased-size condition was used to calculate the corresponding regression lines (the gray areas represent 99% confidence intervals). The values for visual objects 35 and 65 mm (circles) were retrieved from the interpolation series and the values for visual object size 50 mm (squares) from the extrapolation series. The regressions for the increased-size and decreased-size conditions represent the predicted behavior given the maximum and medium constraint hypotheses when subjects were adapted to the respective condition and requested to interpolate or extrapolate. Similarly, the regressions for the first 10 trials (equal-size condition) represent the predicted behavior given the minimum constraint hypothesis when the subjects were requested to interpolate or extrapolate.
of the grasping movement. The linear regression equation calculated from the first 10 trials (equal-size condition) was MGA = 38.1 + 0.67 · VO. In the comparison series, at the 11th trial, the haptic object became either 7.5 mm larger (increasedsize condition) or 7.5 mm smaller (decreased-size condition) than the visual object (cf. Fig. 2B). Linear regression equations for the fully adapted behavior were calculated for the decreased-size and the increased-size conditions and were MGA = 37.4 + 0.64 · VO and MGA = 43.0 + 0.68 · VO, respectively. The linear functions for the equal-, decreased-, and increased-size conditions are depicted with dashed lines in Figure 5. Importantly noted, the estimated slopes for the three conditions were statistically similar (F(2,14) = 1.36, p = 0.29).
Predictions The minimum and the medium constraint hypotheses both imply that the offset and the slope parameter can be modified (cf. equation 1). Accordingly, the predictions made from the minimum and the medium constraint hypotheses were calculated by making a regression between the individual pair of visual and motor coordinates in the increased-size condition and the individual pair of visual and motor coordinates in the decreased-size condition that corresponds to that combination of pairs presented during the testing conditions. The 99% confidence intervals for these predictions are depicted as shaded areas in Figure 5A (change in slope that corresponds to a clockwise rotation) and Figure 5B (counterclockwise slope change). In contrast, the maximum constraint hypothesis implies that the offset parameter (a in equation 1) but not the slope (b in equation 1) can be modified. Given that this hypothesis predicts the slope but does not allow an exact prediction of the offset, a reasonable approach seemed to be to average the MGA in the decreased-size condition and the increased-size condition for each visual object size (note
70
Learning & Memory www.learnmem.org
Figure 5 illustrates the predictions and the actual behavior averaged across subjects during test trials. There was a significant main effect when comparing the two actual slopes and the three predicted slopes (F(4,28) = 27.57, p < 0.00001). The minimum and the medium constraint hypotheses obviously failed to predict the subjects’ behavior (Fig. 5A,B). A post hoc comparison of the slopes revealed a significant difference between the prediction and the actual slope both during clockwise and counterclockwise slope change (Fig 5A,B) (p < 0.005 in both cases). In contrast, the actual slopes were compatible with the maximum constraint hypothesis (Fig. 5C). There was no significant difference between the slope predicted from the maximum constraint hypothesis and the actual slope during the clockwise or the counterclockwise slope change (p > 0.97 in both cases). Humans thus appear to be able to make offset changes (“rigid shifts”) but not slope changes in the visuomotor maps during grasping movements. Only one of the eight subjects had sometimes noticed a difference in size between the seen and the grasped objects.
Discussion We have investigated limitations in the short-term plasticity of the visuomotor map during grasping movements. In the experiments we changed the relationship between the visual size and the actual size of the grasped objects while keeping constant all other factors known to affect the visuomotor map, such as lighting conditions (Wing et al. 1986; Jakobson and Goodale 1991) and movement speed (Wing et al. 1986). In the first experiment, we demonstrated that subjects linearly interpolated and extrapolated in the visuomotor map (Fig. 4). That is, they behaved as if they used a linear function that transformed visual size into a particular grip aperture size. In the second experiment, we demonstrated that subjects maintain a specific slope even when a complete adaptation to the objects presented would require a change in the slope of the visuomotor map (Fig. 5). These results were incompatible with both the minimum and the medium constraint hypotheses but compatible with the maximum constraint hypothesis. We therefore conclude that the short-term plasticity of the visuomotor map during grasping movements is constrained in accordance with the maximum constraint hypothesis: Subjects can only modify the offset parameter (a in equation 1) of the visuomotor map, that is, only rigid shifts are possible between the visual and motor coordinate systems.
Experimental paradigm and predictions Our experimental paradigm was used to examine the constraints that limit the plasticity of the “sensorimotor transformation,” which in this study has been given the more specific denotation “visuomotor map.” As such, the concept “visuomotor map” refers to the function, f, which transforms information about object size in visual coordinates (VO) into motor coordinates (MGA). “Visual coordinates” refers to the different values of object size depicted on the abscissas in Figures 3–5. “Motor coordinates” refer to the different values of the maximum grip aperture depicted on the ordinates in the same figures. Our conceptual framework implicates that changes in f represent changes in the mapping between visual and motor coordinates. In our experi-
Plasticity of the visuomotor map in humans
Subjects made 50 trials during exposure to a size discrepancy in the experimental series (Fig. 2). Previous studies have demonstrated that it takes