Simulating the effect of cochlear-implant electrode insertion depth on speech understanding Michael F. Dormana) Department of Speech and Hearing Science, Arizona State University, Tempe, Arizona 85287-0102 and University of Utah Health Sciences Center, Salt Lake City, Utah 84132
Philipos C. Loizoub) Department of Applied Sciences, University of Arkansas at Little Rock, Little Rock, Arkansas 72204-1099
Dawne Rainey Arizona State University, Tempe, Arizona 85287-0102
~Received 29 October 1996; revised 17 June 1997; accepted 1 July 1997! Normally hearing listeners were presented with vowels, consonants, and sentences for identification through an acoustic simulation of a five-channel cochlear implant with electrodes separated by 4 mm ~as in the Ineraid implant!. The aim of the experiment was to simulate the effect of depth of electrode insertion on identification accuracy. Insertion depth was simulated by outputing sine waves from each channel of the processor at a frequency determined by the cochlear place of electrodes inserted 22–25 mm into the cochlea. The results indicate that simulated insertion depth had a significant effect on performance. Performance at 22- and 23-mm simulated insertion depths was always poorer than normal, and performance at 25-mm simulated insertion depth was, most generally, the same as normal. It is inferred from these results that, if insertion depth could be unconfounded from other coexisting factors in implant patients, then insertion depth would be found to affect speech identification performance significantly. © 1997 Acoustical Society of America. @S0001-4966~97!02511-3# PACS numbers: 43.71.Es, 43.71.Ky, 43.64.Me, 43.66.Ts @WS#
INTRODUCTION
Electrode arrays for cochlear implants are usually inserted 22–30 mm into the cochlea. The depth of insertion should make a difference in performance on tests of speech understanding. To see why, consider the case of an electrode array inserted approximately 27 mm into the cochlea. The most apical electrode will lie near the 350-Hz place and in, for example, an eight-channel prosthesis with logarithmic spacing of filters, the center of the first filter will be at 350 Hz. In this case, stimulation is delivered to the appropriate place in the cochlea. Consider, now, the case of an electrode array inserted only 22 mm into the cochlea. In this instance, the output of the first filter band is delivered to an electrode resting near the 800-Hz place in the cochlea. The mismatch between analysis frequency and stimulation frequency should make speech difficult to understand, since the phonetic segment characterized by energy at 350 Hz is different from the segment characterized by energy at 800 Hz. Although we suppose that speech understanding will be best in a situation in which the stimulation from a filter band is directed to the ‘‘correct’’ place in the cochlea, clinical data do not provide overwhelming support for this position. Some patients with shallow insertions perform as well as patients with deep insertions ~see, for example, Kileny et al., 1992!. Of course, in a clinical population the effect of electrode depth can not be assessed independently of coexisting conditions. For example, by chance a patient who has a deep a!
Electronic mail:
[email protected] Electronic mail:
[email protected]
b!
2993
insertion may not have stimulatable neural elements near the electrodes, while a patient with a short insertion may have neural elements near each electrode. By testing normally hearing listeners it is possible to simulate the effects of insertion depth on speech understanding without encountering the confounds inherent in the use of implant patients as subjects. In the present experiment with normally hearing listeners, signals were first processed in the manner of a five-channel signal-processor for cochlear implants, for example, as in the Med El processor, and were then output as the sum of sine waves centered in the middle of each analysis band. Although no acoustic processing strategy can provide stimulation exactly like that experienced by an implant patient, because we cannot simulate the largely unknown dynamics of current spread in the cochlea, simulations like the one used here provide a starting point for trying to understand speech perception by means of cochlear implants ~see, for example, Shannon et al., 1995!. For the baseline condition, the center frequency of the analysis band and the output signals for vowel, consonant, and sentence test materials matched exactly. In other conditions, the output signals were upshifted in frequency to simulate the effects of five electrodes spaced 4 mm apart inserted 22, 23, 24, and 25 mm into the cochlea. A 4-mm separation among electrodes was chosen because the implant patients with which we have the most experience use a 4-mm separation. To simulate a 22-mm insertion into the cochlea, the output of the first ~418Hz! filter band was delivered as an 831-Hz signal. The output of the second ~748-Hz! filter was delivered at 1567 Hz. The outputs of the third ~1.33 kHz!, fourth ~2.39 kHz!, and
J. Acoust. Soc. Am. 102 (5), Pt. 1, November 1997 0001-4966/97/102(5)/2993/4/$10.00 © 1997 Acoustical Society of America
2993
fifth ~4.28 kHz! filters were delivered as sine waves at 2.84, 5.06, and 8.92 kHz, respectively. Greenwood’s ~1990! frequency-to-place equations were used to determine the sine wave output frequencies which simulated different electrode depths.1 The aim of the experiment was to determine the simulated insertion depths, or differences between analysis frequency and output frequency, which would allow ‘‘normal’’ speech understanding for a five-channel prosthesis. I. METHOD
TABLE I. Analysis filter center-frequency, output frequencies, and differences between analysis and output frequencies for simulations of electrode insertion depths of 22, 23, 24, and 25 mm. Entries are rounded to nearest whole number. Depth522 mm Analysis freq. ~f1! Output freq. ~f2! channel channel channel channel channel
1 2 3 4 5
A. Subjects
The subjects were female graduate and undergraduate students at Arizona State University who passed a hearing screening test at octave frequencies from 0.5–8 kHz. The subjects were paid for participation in the experiment. Nine subjects listened to the tests of sentence intelligibility. Five of the nine also listened to tests of consonant and vowel intelligibility. The subjects were included solely on the basis of availability for testing. All of the subjects had 12–15 h of experience listening to speech reconstructed as the sum of sine waves before participating in the experiment. B. Stimuli
The test material included sentences, consonants in ‘‘vCv’’ environment, and vowels in ‘‘hVd’’ environment. The sentence material was from the H.I.N.T. test, presented without competing noise ~Nilsson et al., 1994!. Examples of sentences in this test are, ‘‘They met some friends at dinner,’’ and ‘‘Yesterday he lost his hat.’’ A different set of ten sentences was used for each simulated insertion depth condition. The consonant test was the Iowa consonant test—16 consonants in /aCa/ environment spoken by a single male speaker ~Tyler et al., 1989!. The stimuli were grouped into five blocks with each stimulus appearing once in a block. Stimulus order within each block was randomized. The vowel material consisted of the vowels in the words ‘‘heed, hid, hayed, head, had, hod, hud, hood, hoed, who’d, heard.’’ Each word was produced once by three men, three women, and three girls. The stimuli were drawn from a set used by Hillenbrand et al. ~1995!. The stimuli were presented in a completely randomized test sequence. C. Signal processing
The sine-wave processor was implemented as follows. The signal was first preemphasized using a first-order FIR filter, and then bandpassed into five logarithmic frequency bands using sixth-order Butterworth filters. ~A five-channel processor was simulated so that when the output frequencies were upshifted to simulate shallow insertions, the highest frequency would be under 10 kHz and would be within the frequency response of our Sennheiser HMD 410 headphones.! The center frequencies of the bands were at 418 Hz, 748 Hz, 1.33 kHz, 2.39 kHz, and 4.28 kHz. The envelope of the signal was extracted by full-wave rectification and lowpass filtering ~second-order Butterworth! with a 400-Hz cutoff frequency. Sinusoids were generated with amplitudes equal to the rms energy of the envelopes ~computed every 4 2994
J. Acoust. Soc. Am., Vol. 102, No. 5, Pt. 1, November 1997
418 748 1339 2396 4287
831 1567 2844 5065 8924
Depth523 mm Analysis freq. ~f1! Output freq. ~f2! channel channel channel channel channel
1 2 3 4 5
418 748 1339 2396 4287
703 1343 2456 4390 7751
Depth524 mm Analysis freq. ~f1! Output freq. ~f2! channel channel channel channel channel
1 2 3 4 5
418 748 1339 2396 4287
591 1148 2118 3802 6730
Depth525 mm Analysis freq. ~f1! Output freq. ~f2! channel channel channel channel channel
1 2 3 4 5
418 748 1339 2396 4287
493 979 1823 3290 5840
f22f1
log ~f2/f1!
413 819 1505 2669 4637
0.30 0.32 0.33 0.33 0.32
f22f1
log ~f2/f1!
285 595 1117 1994 3464
0.23 0.25 0.26 0.26 0.26
f22f1
log ~f2/f1!
173 400 779 1406 2443
0.15 0.19 0.20 0.20 0.20
f22f1
log ~f2/f1!
75 231 484 894 1553
0.07 0.12 0.13 0.14 0.13
msec! and frequencies equal to the center frequencies of the bandpass filters. The sinusoids from each band were summed and presented to the listeners at a comfortable level. To simulate the 25-mm insertion depth, sine waves were output at 493, 978, 1823, 3290, and 5840 Hz. To simulate the 24-mm insertion depth, sine waves were output at 590, 1148, 2117, 3802, and 6729 Hz. To simulate the 23-mm insertion depth, sine waves were output at 703, 1343, 2456, 4390, and 7751 Hz. To simulate the 22-mm insertion depth, sine waves were output at 831, 1567, 2844, 5065, and 8924 Hz. The differences in analysis frequency and output frequency for each channel and for each simulated insertion depth are shown in Table I. D. Procedure
The simulated insertion depth conditions were run in the order: Normal, 25, 24, 23, and 22 mm. This order was chosen to maximize the experience of the subjects before they were tested with the most difficult material. The tests were run in the order sentences, consonants, and vowels. This order was chosen to maximize the experience of the subjects before they were tested with the difficult task of multitalker vowel identification ~see Dorman et al., in press, for the results of other simulations with normally hearing subjects!. Practice for the sentence material consisted of the presentaDorman et al.: Simulating the effect of cochlear implant
2994
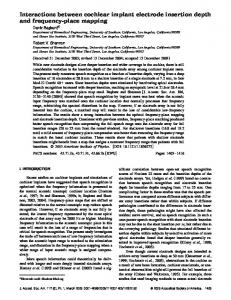
FIG. 1. Test scores as a function of simulated insertion depth. Error bars indicate 61 standard deviation. ‘‘Normal’’ refers to a condition in which the center frequencies of the analysis bands and the output frequencies were identical.
tion of one list of ten sentences with concurrent visual display of the material for each simulation of insertion depth. Practice for the vowel and consonant tests consisted of two runs through the stimulus list with visual indication of item identity. In addition, the subjects were presented with one randomized set of stimuli with feedback of correct answers. Practice was given for each simulation of insertion depth. All of the test materials were stored on computer disk and were output via custom software routines using MATLAB ~Mathworks, Inc.! software and a 16-bit D/A converter. The signal level was approximately 72 dB re: peak vowel amplitude. The subjects were tested in a sound attenuated room. Responses were collected with custom software using a computer display of response alternatives and a mouse as a response key. For the vowel and consonant material, the subjects were allowed to use a ‘‘repeat’’ key as many times as they wished. For the tests of word intelligibility in sentences, the subjects were presented a sentence once, and were instructed to repeat as many of the words as they could. Each word in the sentence was scored. II. RESULTS
The results are shown in Fig. 1~a!–~d!. A repeated measures analysis of variance for the sentence material indicated a significant effect for simulated insertion depth ~F @ 4,32# 2995
J. Acoust. Soc. Am., Vol. 102, No. 5, Pt. 1, November 1997
561.34, p,0.0001!. Post hoc tests according to Scheffe (alpha50.05) indicated that the mean scores for the normal and 25-mm conditions ~98% correct and 93% correct, respectively! did not differ. Both scores were significantly different from the 22-, 23-, and 24-mm conditions. A repeated measures analysis of variance for the Iowa consonants indicated a significant effect for simulated insertion depth ~F @ 4,16# 516.77, p,0.0001!. Post hoc tests according to Scheffe (alpha50.05) indicated that the mean scores for the normal, 25-, and 24-mm conditions ~94% correct, 90% correct, and 86% correct, respectively! did not differ. The scores were significantly different from the 22and 23-mm conditions. A repeated measures analysis of variance for the feature ‘‘place of articulation,’’ scored for percent information received ~Miller and Nicely, 1955!, indicated a significant main effect for simulated insertion depth (F @ 4,16# 515.81, p,0.0001!. Post hoc tests according to Scheffe (alpha50.05) indicated that the mean scores for the normal and 25-mm conditions ~83% correct and 75% correct, respectively! did not differ. Both scores were significantly different from the 22-, 23-, and 24-mm conditions. A repeated measures analysis of variance for the multitalker vowel material indicated a significant main effect for simulated insertion depth ~F @ 4,16# 5123.76, p,0.0001!. Post hoc tests according to Scheffe (alpha50.05) indicated Dorman et al.: Simulating the effect of cochlear implant
2995
that the mean scores for the normal condition differed from all other conditions. III. DISCUSSION
There was a significant effect of simulated insertion depth for all test materials. We infer from this outcome that the depth of electrode insertion should make a difference in the speech perception abilities of cochlear implant patients. Performance in the 22- and 23-mm conditions differed significantly from the normal condition for all test materials. Thus relatively shallow insertions should result in relatively poor speech understanding when all other factors are held equal. For two of the three tests, including the test of sentence identification, performance in the 25-mm condition did not differ from that in the normal condition. This outcome can be rationalized by noting that the output frequencies in the 25-mm condition were within, or were just slightly beyond the edge, of the 23-dB point of the analysis filters. It may be the case that as long as the output frequencies are within the bandwidth of the analysis filters, differences between analysis filter center frequency and output frequency will not alter identification performance. At all events, insertions of 25 mm should be sufficient to allow the level of speech understanding which may be achieved with deeper insertions. Of course, this conclusion applies only to the electrode configuration we have simulated, i.e., the Ineraid electrode array with 5 electrodes at 4-mm intervals. Simulations of other electrode configurations may also be of interest. In implant patients the effect of insertion depth may be realized in performance on two different measures. One is the time taken to reach asymptotic performance. The second is the level of asymptotic performance. Many implant patients report that for a period after the implant is activated, speech sounds ‘‘high pitched’’ or unnatural in a number of ways. Over time, patients usually report that speech sounds more ‘‘normal’’ and that speech is more intelligible, even though the parameters of stimulation have not changed. Given our results, it is possible that shallow insertion depths could be at least partially responsible for the reports of unnatural or ‘‘high pitched’’ speech at the time of processor activation and for poor initial intelligibility. ~It is not likely that patients are sufficiently sophisticated to be able to tell
2996
J. Acoust. Soc. Am., Vol. 102, No. 5, Pt. 1, November 1997
the difference between an abnormally high pitch, per se, and upshifted formant frequencies.! It is important to note that if shallow insertion depth is responsible for the percepts described in the patient reports, then patients can learn to hear through, or compensate for, the distortion in frequency representation because, over time, most patients report that speech sounds more ‘‘normal’’ and is more intelligible. Of course, insertion depth may also play a role in the level of terminal performance. Patients may be able to compensate for only distortions of a modest magnitude in the mapping of input frequency to cochlear place of stimulation. On this view, distortion in the mapping of input frequency to cochlear place of stimulation is one of many factors responsible for low levels of asymptotic performance among implant patients. ACKNOWLEDGMENT
This research was supported by Grant No. RO1000654-6 from the National Institute on Deafness and Other Communicative Disorders. 1
We used a ‘‘k’’ of 1.0 in Greenwood’s equation and assumed a membrane length of 35 mm. If a shorter membrane ~e.g., 33 mm! is assumed then the perceptual consequences of short insertion depths would be reduced.
Dorman, M., Loizou, P., and Rainey, D. ~1997!. ‘‘Speech intelligibility as a function of the number of channels of stimulation for signal processors using sine-wave and noise-band outputs,’’ J. Acoust. Soc. Am. 102, 2403–2411. Greenwood, D. ~1990!. ‘‘A cochlear frequency-position function for several species—29 years later,’’ J. Acoust. Soc. Am. 87, 2592–2605. Hillenbrand, J., Getty, L., Clark, M., and Wheeler, K. ~1995!. ‘‘Acoustic characteristics of American English vowels,’’ J. Acoust. Soc. Am. 97, 3099–3111. Kileny, P., Zimmerman-Phillips, S., Zwolan, T., and Kemink, J. ~1992!. ‘‘Effects of channel number and place of stimulation on performance with the Cochlear Corporation multichannel implant,’’ Am. J. Otolaryngol. 13~2!, 117–123. Miller, G., and Nicely, P. ~1955!. ‘‘An analysis of perceptual confusions among some English consonants,’’ J. Acoust. Soc. Am. 27, 338–346. Nilsson, M., Soli, S., and Sullivan, J. ~1994!. ‘‘Development of the Hearing in Noise Test for the measurement of speech reception thresholds in quiet and noise,’’ J. Acoust. Soc. Am. 95~2!, 1085–1099. Shannon, R., Zeng, F.-G., Kamath, V., Wygonski, J., and Ekelid, M. ~1995!. ‘‘Speech recognition with primarily temporal cues,’’ Science 270, 303– 304. Tyler, R., Preece, J., and Lowder, M. ~1987!. ‘‘The Iowa audiovisual speech perception laser videodisc,’’ Laser Videodisc and Laboratory Report, Department of Otolaryngology, Head and Neck Surgery, University of Iowa Hospital and Clinics, Iowa City, IA.
Dorman et al.: Simulating the effect of cochlear implant
2996