Hindawi Publishing Corporation Advances in Materials Science and Engineering Volume 2016, Article ID 1075452, 11 pages http://dx.doi.org/10.1155/2016/1075452
Research Article Simulation of Chloride Diffusion in Cracked Concrete with Different Crack Patterns Xiao-Yong Wang and Li-Na Zhang Department of Architectural Engineering, College of Engineering, Kangwon National University, Chuncheon-Si 200-701, Republic of Korea Correspondence should be addressed to Li-Na Zhang;
[email protected] Received 25 December 2015; Accepted 2 March 2016 Academic Editor: Yuyin Wang Copyright © 2016 X.-Y. Wang and L.-N. Zhang. This is an open access article distributed under the Creative Commons Attribution License, which permits unrestricted use, distribution, and reproduction in any medium, provided the original work is properly cited. Chloride-induced corrosion of steel rebar is one of the primary durability problems for reinforced concrete structures in marine environment. Furthermore, if the surfaces of concrete structures have cracks, additional chloride can penetrate into concrete through cracked zone. For chloride ingression into cracked concrete, former researches mainly focus on influence of crack width on chloride diffusion coefficients. Other crack characteristics, such as chloride depth, crack shape (equal-width crack or tapered crack), crack density, and spacing, are not studied in detail. To fill this gap, this paper presents a numerical procedure to simulate chloride ingression into cracked concrete with different crack geometry characteristics. Cracked concrete is divided into two parts, sound zone and cracked zone. For stress-free concrete, the diffusion coefficient of sound zone is approximately assumed to be the same as sound concrete, and the diffusion coefficient of cracked zone is expressed as a piecewise function of crack width. Twodimensional finite element method is used to determine chloride concentration. It is found that, with the increasing of crack width, crack depth, and crack amount, chloride ingression will aggravate. The analysis results generally agree with experimental results.
1. Introduction For reinforced concrete structures in marine environment, chloride-induced corrosion of steel rebar is one of the primary durability problems. On the other hand, reinforced and plain concrete structures are often subjected to various solicitations, such as thermal or moisture gradients or mechanical loads. When these solicitations exceed locally the tensile strength of the material, crack will be generated and subsequently affect the transport properties of concrete. Additional chloride can penetrate into concrete through surface cracked zone. Hence, for durability design of reinforced concrete structures, the considerations of influences of cracking on chloride ingression are necessary [1, 2]. The experimental study and theoretical modelling about chloride ingression in cracked concrete are abundant. Ismail et al. [3, 4] found that crack opening significantly affects chloride-ion diffusion along a crack in mortar. Chloride diffusion along a crack decreases with crack opening. S¸ahmaran
[5] found that for mortar specimens with flexure induced transverse crack, as the crack width was increased, the effective diffusion coefficient was also increased. A significant amount of self-healing was observed within the cracks with width below 50 um subjected to NaCl solution exposure. Besides the experimental study [3–5], some theoretical models are proposed to simulate chloride diffusion into cracked concrete. On the basis of two-phase parallel model of cracked concrete [6], Jang et al. [7] derived the equivalent diffusion coefficient of cracked concrete. Actual tapered crack is simplified as idealized parallel crack by using a crack geometry factor [7]. Park et al. [8] analyzed chloride penetration in cracked concrete with partially saturated condition using equivalent diffusion and permeation. Equivalent chloride diffusivity is analytically proposed by considering a Representative Elementary Volume (REV) model with crack. Kwon et al. [9] regressed the relationship between diffusion coefficients and crack widths and predicted service life of the cracked concrete in the probabilistic framework of Monte
2
Advances in Materials Science and Engineering
Carlo simulation. Although equivalent diffusion coefficient of cracked concrete is widely used to evaluate chloride penetration [6–8] and service life [9], equivalent diffusion coefficient method shows some disadvantages. Equivalent diffusion coefficient method is a one-dimensional simulation procedure. However, chloride penetration into cracked concrete is a two-dimensional or 3-dimensional process. Due to the influence of cracks, chloride concentration is different at the same concrete cover depth. To overcome the shortcomings of current research [6–9], this paper presents a numerical procedure to simulate chloride ingression into cracked concrete. The chloride diffusivity in cracked zone is expressed as functions of crack width. The cracked zone and sound zone of concrete are given individual diffusion coefficients. Crack geometry characteristics, such as crack width, crack depth, crack shape (parallel crack and tapered crack), and crack spacing, are considered. By using twodimensional finite element method, chloride concentration in cracked concrete is calculated. The proposed model is verified using experimental results from literature.
2. Theoretical Background about Chloride Diffusion Model 2.1. Chloride Diffusion in Sound Concrete. For saturated concrete, chloride ions ingress the concrete by ionic diffusion because of the existing concentration gradient between the exposed environment and the pore solution of the cement matrix. The movement of chloride ions in saturated concrete can be determined by Fick’s first law as follows: 𝐽𝑐 = − [𝐷𝑒 𝜔𝑒
𝜕𝐶𝑓 𝜕𝑥
𝑖 + 𝐷𝑒 𝜔𝑒
𝜕𝐶𝑓 𝜕𝑦
𝑗 + 𝐷𝑒 𝜔𝑒
𝜕𝐶𝑓 𝜕𝑧
𝑗] ,
(1)
where 𝐽𝑐 is the flux of chloride ions because of diffusion (kg/m2 ⋅s); 𝐷𝑒 is the effective diffusion coefficient (m2 /s); 𝜔𝑒 is the content of evaporable water (m3 evaporable water/m3 concrete); and 𝐶𝑓 is free chloride concentration (kg/m3 of pore solution). In saturated concrete, the chloride mass conservation can be described by using Fick’s second law as follows: 𝜕𝐶𝑡 = −∇ ⋅ 𝐽𝑐 , 𝜕𝑡
(2)
where 𝐶𝑡 denotes the total chloride concentration and 𝑡 is time (s). During the ingression process, due to chemical reactions between free chloride and anhydrous binders and hydration reaction products, partial free chloride will be chemically bound in concrete. The CSH in concrete also can physically absorb free chloride. Due to the chemical bound and physical bound, the mobile chloride concentration will decrease. The relation among total, bound, and free chloride concentrations in concrete is shown as follows: 𝐶𝑡 = 𝐶𝑏 + 𝜔𝑒 𝐶𝑓 ,
(3)
where 𝐶𝑏 denotes the concentration of bound chlorides. By substituting (3) into (2), Fick’s second law equation can be revised as follows: 𝜕𝐶𝑓 𝜕𝑡
=
𝜕𝐶𝑓 𝜕𝐶𝑓 𝜕 𝜕 (𝐷𝑎 )+ (𝐷𝑎 ) 𝜕𝑥 𝜕𝑥 𝜕𝑦 𝜕𝑦 𝜕𝐶𝑓 𝜕 + (𝐷𝑎 ), 𝜕𝑧 𝜕𝑧
𝐷𝑎 =
𝐷𝑒 1 + (1/𝜔𝑒 ) (𝜕𝐶𝑏 /𝜕𝐶𝑓 )
.
(4)
(5)
𝐷𝑎 is apparent diffusion coefficient and 𝜕𝐶𝑏 /𝜕𝐶𝑓 is the binding capacity of the concrete binder. The effective diffusion coefficient 𝐷𝑒 closely relates to capillary porosity of concrete. Due to hydration of cement, capillary porosity of concrete will decrease; effective diffusion coefficient will decrease correspondingly. Hence, effective diffusion coefficient is not a constant, but a time dependent variable. Our former research [10] proposed a kinetic model to describe the evolution of cement hydration and effective diffusion coefficient. For hardening concrete, the effective diffusion coefficient 𝐷𝑒 can be determined from capillary porosity of paste phase and aggregate contents in concrete as follows [10]: 𝐴2
𝐷𝑒 (𝑡) = 𝐴 1 ∗ (𝜙paste ) 𝜙paste =
𝜙𝑐 (𝑡) , 𝐶0 /𝜌𝑐 + 𝑊0
2 (1 − 𝑉𝑎 ) , 2 + 𝑉𝑎
(6) (7)
where 𝐴 1 and 𝐴 2 denote relation coefficients between capillary porosity and chloride diffusivity, 𝜙paste denotes the capillary porosity in cement paste, and 𝑉𝑎 denotes the volume of aggregate in concrete. 𝜙𝑐 (𝑡) is the capillary porosity of concrete which can be calculated using the hydration model [10]. Because 𝜙𝑐 (𝑡) is a time dependent variable, the reduction of chloride diffusion coefficient during immersion test period can be considered by using 𝜙𝑐 (𝑡). 𝐶0 is the mass of cement, and 𝑊0 is the mass of water in the mix proportion. 𝜌𝑐 denotes the density of the cement. The former item 𝐴 1 ∗ (𝜙paste )𝐴 2 takes into account effect of cement hydration on chloride diffusivity, and the latter item 2(1 − 𝑉𝑎 )/(2 + 𝑉𝑎 ) takes into account dilution effect of aggregate on chloride diffusivity [11–14]. On the other hand, it should be noticed that (6) does not consider the effect of gel pore on chloride diffusivity. Equation (6) is generally valid for concrete containing higher capillary pores, such as concrete with a water to binder ratio higher than 0.25. For ultra-high performance concrete (UHPC) with a water to binder ratio of about 0.20, at late ages, capillary pore is very low and chloride diffusivity will closely relate to gel pore. To calculate chloride diffusivity in UHPC, (6) should be revised to consider the effect of gel pore. At a given temperature, the relationships between free and bound chlorides can be described using chloride binding isotherms. Chloride binding isotherms relate to binder and hydration reaction components, such as the content of C3 A,
Advances in Materials Science and Engineering
3 40
supplementary cementing materials (SCMs), and pH of the pore solution. Environmental temperature surrounding the system will also influence chloride binding isotherms. Freundlich binding isotherm (nonlinear binding isotherm) is effective in describing the relation between free chloride and bound chloride at a wide concentration range [15–24]. The equation of Freundlich binding isotherm is shown as follows [15–24]: 𝐹2
𝐶𝑏 = 𝐹1 ∗ (1 − 𝜙𝑡 ) ∗ (𝐶𝑓 ) ,
(8)
where 𝐹1 and 𝐹2 denote relation coefficients between free chloride and bound chloride. The total porosity of concrete 𝜙𝑡 can be determined using hydration model shown in our former research [10].
40
Idealized crack (notch)
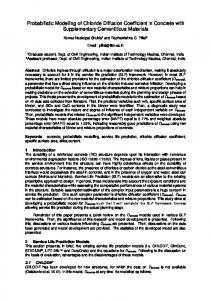
2.2. Chloride Diffusion Coefficient in Cracked Zone. Experimental study [3–5] shows that chloride diffuses in crack with a different coefficient 𝐷cr which is much larger than the coefficient in concrete matrix. 𝐷cr varied with the crack width and had no relationship with the binder materials. The relation between chloride diffusion coefficient and crack width can be described using a piecewise function as follows [15]:
Chloride ions
Figure 1: Schematic of specimens.
𝐷cr 𝐷𝑎 𝜔 < 30 𝜇m { { { = { 28.3 − 35.6 exp (−0.00835𝜔) 30 ≤ 𝜔 ≤ 120 𝜇m { { 𝐷H2 O 𝜔 > 120 𝜇m, {
(9)
where 𝜔 is crack width. As shown in (9), first, when crack width is less than 30 𝜇m (30 𝜇m is the lower limit which makes crack influence the chloride diffusion), the product of subsequent hydration and self-healing of cementitious materials will jam the crack. So the crack’s effect on chloride diffusion can be ignored; second, when crack width is higher than 30 𝜇m and less than 120 𝜇m (120 𝜇m is the upper limit which makes crack influence the chloride diffusion), the product of subsequent hydration cannot block the crack completely, so chloride diffusion will happen in the unblocked part; third, when crack width is higher than 120 𝜇m, the product of subsequent hydration cannot block the crack, so 𝐷cr is equal to chloride diffusion efficient in water 𝐷H2 O . Equation (9) is generally valid for chloride penetration into transverse crack of concrete. For considering the difference between isotropic diffusion and anisotropic diffusion, the ingression direction dependent chloride diffusivity should be used. On the other hand, for cracked zone, to accurately simulate the effect of self-healing on durability, the rehydration process of anhydrous cement should be precisely modelled. Equation (9) does not clearly model rehydration process. Equation (9) roughly assumes that the rate of rehydration is much higher than that of chloride ingression and when crack width is less than 30 𝜇m, rehydration products can fully jam the crack. 2.3. Two-Dimensional Finite Element Method to Solve Chloride Concentration. In space domain, (4) is a boundary value
problem. Using finite element procedure, (4) can be solved as follows [11–14]: [𝐻] {𝐶𝑓 } + [𝐶]
𝜕𝐶𝑓 𝜕𝑡
= {𝑃} ,
(10)
where [𝐻] is integral stiffness matrix, [𝐶] is integral mass matrix, and {𝑃} is integral source vector. The integral matrix is obtained by assembling element matrix as follows: 𝐻𝑖𝑗 = ∑ℎ𝑖𝑗𝑒 , 𝑒
𝐶𝑖𝑗 = ∑𝑐𝑖𝑗𝑒 , 𝑒
(11)
𝑃𝑖 = ∑𝑝𝑖 . 𝑒
The element stiffness matrix, element mass matrix, and element source vector can be determined using element shape function as follows: ℎ𝑖𝑗𝑒 = ∬ (
𝜕𝑁𝑖 𝜕𝑁𝑗 𝜕𝑁𝑖 𝜕𝑁𝑗 + ) 𝑑𝑥 𝑑𝑦, 𝜕𝑥 𝜕𝑥 𝜕𝑦 𝜕𝑦
𝑐𝑖𝑗𝑒 = ∬ (
1 𝑁 𝑁 ) 𝑑𝑥 𝑑𝑦, 𝐷𝑎 𝑖 𝑗
𝑝𝑖 = ∬ (
𝜕𝜃 1 𝑁 ) 𝑑𝑥 𝑑𝑦, 𝐷𝑎 𝑖 𝜕𝑡
(12)
where 𝑁𝑖 and 𝑁𝑗 are element shape function and 𝜃 is element source item.
4
Advances in Materials Science and Engineering 2.11 1.87556 1.64111 1.40667 1.17222 0.937778 0.703333 0.468889 0.234444 0
(a) Meshing of sound concrete
0.04
(b) Analysis results, contour of free chloride ion concentration at 20 weeks in sound concrete
No cracking, 8 weeks
0.04 0.035 Chloride penetration depth (m)
0.035 Chloride penetration depth (m)
No cracking, 20 weeks
0.03 0.025 0.02 0.015 0.01
0.03 0.025 0.02 0.015 0.01 0.005
0.005 0 −0.02 −0.015 −0.01 −0.005 0 0.005 0.01 Distance from crack (m)
0.015
0.02
0 −0.02 −0.015 −0.01 −0.005 0 0.005 0.01 Distance from crack (m)
Analysis results Experimental results
Analysis results Experimental results
(c) Chloride penetration depth at 8 weeks
(d) Chloride penetration depth at 20 weeks
0.015
0.02
Figure 2: Analysis of chloride penetration depth in sound concrete.
In time domain, (10) is an initial value problem. The iteration process of (10) is shown as follows [11–14]: [[𝐶] + [𝐻] 𝛼Δ𝑡] {𝐶𝑓 }𝑛+1
(13)
= [[𝐶] − [𝐻] (1 − 𝛼) Δ𝑡] {𝐶𝑓 }𝑛 + {𝑃}𝑛 Δ𝑡. Generally, the value of iteration parameter 𝛼 should be greater than 0.5 to confirm numerical stability. In this analysis, the value of 𝛼 is used as 2/3 (Galerkin method), which is unconditionally stable.
The calculation steps of proposed numerical procedure are summarized as follows: First, calculate chloride diffusivity in sound concrete (equation (6)) and chloride binding capacity (equation (8)). Second, calculate chloride diffusivity in cracked zone (equation (9)). Confirm the continuity condition between cracked zone and sound zone of concrete. Third, make finite element meshing of test specimens. Confirm the initial conditions and boundary conditions of test specimens.
Free chloride concentration (kg/m3 pore solution)
Advances in Materials Science and Engineering
5
2.5
2
1.5
1
0.5
0
0
0.005
0.01
0.015 0.02 0.025 0.03 Concrete cover depth (m)
0.035
0.04
Analysis results from Fick’s 2nd law Analysis results from two-dimensional finite element method (FEM)
Figure 3: Comparison of analysis results between Fick’s 2nd law and finite element method (FEM).
Fourth, using finite element method, calculate chloride concentration at nodes (equation (13)).
3. Verification of Proposed Model and Parameter Analysis 3.1. Concrete with Equal-Width Crack. De Schutter [16] investigated chloride ingression into concrete with different crack widths and crack depths. The size of specimen is 40 mm ∗ 40 mm ∗ 160 mm. The cracks were made as notches by means of the positioning and removal of thin copper sheets inside the specimens. The maximum crack width of artificial cracks is 0.5 mm, and the maximum crack depth of artificial cracks is 10 mm. The profile of specimens is shown in Figure 1. Mixture proportion of mortar specimen is cement : water : sand = 1 : 0.5 : 3. After 28 days of water curing, the specimens were taken out from water tank. The surfaces of specimens were coated using epoxy, except the surface containing crack. Then the specimens were immersed into 3.5% NaCl solution. The chloride penetration depths were measured with silver nitrate solution at regular times. The free chloride concentration at the color change border equals 0.15% by weight of cement [17–24]. The meshing of sound concrete is shown in Figure 2(a). Four-node isoparametric element is used to mesh the sound specimen. Two-dimensional finite element analysis is used to calculate free chloride concentration at different exposure periods. In the analysis process, the boundary condition and initial condition are shown as follows: the free chloride concentration at the penetration boundary (bottom of specimen) equals environmental chloride concentration (2.11 kg/m3 which is corresponding to 3.5% NaCl solution); the free chloride concentration at the opposite side of penetration boundary is set as 0; the initial free chloride
concentration is set as 0. The free chloride concentration at the chloride penetration is determined as 0.759 kg/m3 (corresponding to 0.15% by weight of cement [17–24]). Using experimental results of chloride penetration depth, the apparent chloride diffusion coefficient of sound concrete is calibrated as 3.3𝑒−12 m2 /s, which is in the range for concretes and mortars made with the different cementitious systems (from 1𝑒−12 to 5𝑒−11 m2 /s). The contour of free chloride concentration and chloride penetration depth at 8 weeks and 20 weeks are shown in Figure 2(b) and Figures 2(c) and 2(d), respectively. As shown in Figures 2(c) and 2(d), at the same depth, the free chloride concentration is the same. In other words, chloride penetration in sound saturated concrete is a one-dimensional diffusion process. Hence, for sound concrete, Fick’s second law can be used to determine free chloride concentration. Figure 3 shows the comparison between finite element analysis results and Fick’s second law calculation results. It can be seen that calculation results from two methods are the same. Cracked concrete can be divided into two zones, cracked zone and sound zone. For stress-free concrete, it is assumed that the chloride diffusion coefficient in sound zone is the same as that of sound concrete. The chloride diffusion coefficient in cracked zone is calculated using (9). Fournode isoparametric element is used to mesh the cracked specimen. As shown in Figure 4(a), finer meshing is used in cracked zone compared to that in sound concrete zone. The contour of free chloride concentration at 20 weeks is shown in Figure 4(b) (crack width 0.3 mm, crack depth 10 mm). As shown in Figure 4(b), for cracked concrete, the chloride penetration depths are generally symmetrical with crack. At the same depth, because chloride diffusion coefficient in cracked zone is much higher than that of sound zone, chloride concentration in cracked zone is much higher than that in sound zone. Summarily, for cracked concrete, chloride penetration is a two-dimensional diffusion process, and cracks give significant influence on chloride concentration around cracked zone. The comparison between analyzed results and experimental results is shown in Figures 4(c)–4(f). Crack width, crack depth, and exposure period are taken into account in this verification process. When crack width and crack depth increase, chloride penetration depth increases correspondingly. At initial age of immersion, cracks significantly contribute to chloride penetration depth. With the increase of immersion age, chloride penetration depth in cracked zone gradually becomes similar to that in uncracked zone. In early age, chloride penetration contour changes are of convex shape, and in late age, chloride penetration contour is horizontal straight line. 3.2. Concrete with Tapered Crack. For real reinforced concrete structures, compared with equal-width crack, tapered crack frequently occurs due to bending stress. For tapered crack, crack width is not homogeneous in cracked zone. On the surface of concrete, crack width is maximum. At the crack depth, crack width approximately equals zero. As shown in (9), for tapered crack, chloride diffusion coefficient is not constant but depends on local crack width.
6
Advances in Materials Science and Engineering 2.11 1.87556 1.64111 1.40667 1.17222 0.937778 0.703333 0.468889 0.234444 0
(b) Analysis results, contour of free chloride ion concentration in cracked concrete
0.04
0.04
0.035
0.035 Chloride penetration depth (m)
Chloride penetration depth (m)
(a) Meshing of cracked concrete with parallel crack
0.03 0.025 0.02 0.015 0.01
0.03 0.025 0.02 0.015 0.01 0.005
0.005 0 −0.02 −0.015 −0.01 −0.005
0
0.005
0.01
0.015
0 −0.02 −0.015 −0.01 −0.005 0 0.005 0.01 Distance from crack (m)
0.02
Distance from crack (m) Analysis results Experimental results
0.02
Analysis results Experimental results
(c) Crack width 0.2 mm, crack depth 5 mm, and exposure period 8 weeks
(d) Crack width 0.2 mm, crack depth 5 mm, and exposure period 20 weeks
0.04
0.04
0.035
0.035 Chloride penetration depth (m)
Chloride penetration depth (m)
0.015
0.03 0.025 0.02 0.015 0.01 0.005
0.03 0.025 0.02 0.015 0.01 0.005
0 −0.02 −0.015 −0.01 −0.005 0 0.005 0.01 Distance from crack (m)
0.015
0.02
Analysis results Experimental results (e) Crack width 0.5 mm, crack depth 10 mm, and exposure period 8 weeks
0 −0.02 −0.015 −0.01 −0.005 0 0.005 0.01 distance from crack (m)
0.015
0.02
Analysis results Experimental results (f) Crack width 0.5 mm, crack depth 10 mm, and exposure period 20 weeks
Figure 4: Analysis of chloride penetration depth in concrete with one equal-width crack.
Chloride content (%wt. of mortar)
Advances in Materials Science and Engineering
7
0.5 0.4 0.3 0.2 0.1 0
0
0.01
0.02
0.03 0.04 0.05 0.06 Distance from surface (m)
0.07
0.08
Analysis results: sound concrete Experimental results: sound concrete
0.5 0.4 0.3 0.2 0.1 0
0
0.01
0.02
0.03
0.04
0.05
0.06
0.07
0.456369
0.405661
0.354954
0.304246
0.253538
0.152123
0.101415
0.050708
0
(d) Analysis results, contour of free chloride ion concentration
Chloride content (%wt. of mortar)
Chloride content (%wt. of mortar)
(c) Meshing of concrete with tapered crack
0.202831
(b) Concrete with tapered crack
(a) Sound concrete
0.08
Distance from surface (m) Analysis results: concrete with 49 𝜇m tapered crack Experimental results: concrete with 49 𝜇m tapered crack (e) Concrete with 49 𝜇m tapered crack
0.5 0.4 0.3 0.2 0.1 0
0
0.01
0.02
0.03
0.04
0.05
0.06
0.07
0.08
Distance from surface (m) Analysis results: concrete with 103 𝜇m tapered crack Experimental results: concrete with 103 𝜇m tapered crack (f) Concrete with 103 𝜇m tapered crack
Figure 5: Analysis of chloride concentration in concrete with one tapered crack.
Experimental results about chloride ingression into concrete with tapered crack [5] are used to verify the proposed model. The specimens were mortar prisms reinforced using three layers of steel mesh reinforcement. The size of prisms was 355.6 ∗ 50.8 ∗ 76.2 mm. After 43 days of water curing, the
prisms were cracked by using four-point bending test. One single crack was made in the middle of span. By controlling the beam bending deformation, tapered cracks with different widths and depths were made. The width of crack was measured after loading. Then, the unloaded specimens were
8
Advances in Materials Science and Engineering
(a) Concrete with two parallel cracks: crack width 0.3 mm, crack depth 10 mm, and exposure period 20 weeks
0.04
2.11 1.87556
1.40667 1.17222 0.937778 0.703333 0.468889
0.035 Chloride penetration depth (m)
1.64111
(b) Meshing of concrete
0.03 0.025 0.02 0.015 0.01 0.005
0.234444
0 −0.02 −0.015 −0.01 −0.005 0 0.005 Dimension (m)
0
0.01
0.015
0.02
One crack Two cracks (c) Analysis results, contour of free chloride ion concentration in concrete with two parallel cracks
(d) Comparison of chloride penetration depth between one crack and two cracks
Figure 6: Analysis of chloride penetration in concrete with two equal-width cracks.
immersed into 3% NaCl solution for 30 days. After the immersion period, area around the cracked zone was drilled, ground, and measured for chloride. The analysis process for chloride concentration in concrete with tapered crack is shown in Figure 5. Figure 5(a) shows analysis results about chloride concentration for sound concrete. Using experimental results, the surface chloride content is calibrated as 0.45% of concrete weight, and the chloride diffusion coefficient is calibrated as 1𝑒−11 m2 /s. The boundary condition and material properties of sound concrete are used as input parameters for analyzing chloride ingression into cracked concrete. Figure 5(b) shows geometry model (tapered crack width 103 𝜇m, tapered crack depth 36.6 mm). Figure 5(c) shows the meshing of cracked concrete. Figure 5(d) shows calculated contour of chloride concentration after 30 days of immersion. Chloride concentration is higher in cracked zone than other zones. Figures 5(e) and
5(f) show analysis results of concrete with different tapered cracks. For Figure 5(e), crack width is 49 𝜇m, and crack depth is 28.1 mm; for Figure 5(f), crack width is 103 𝜇m, and crack depth is 37 mm. The analysis results generally agree with experimental results. For concrete with large crack width, 103 𝜇m, the analysis results are slightly lower than experimental result. It could be due to the residual strain and damage of unloaded concrete around cracked zone. The damage of unloaded concrete will increase the chloride diffusion coefficient and this point is not considered in the proposed model. 3.3. Parameter Analysis. For reinforced concrete structures, cracks will occur when the principle tension stress exceeds tension strength of concrete. Compared with single crack, vast cracks occur in the tension zone of structural member. Effect of crack number on chloride penetration is shown in
Advances in Materials Science and Engineering
9
A2
A1
(a) Concrete with a parallel crack
(b) Geometry model for equivalent diffusion coefficient: crack width 0.3 mm, crack depth 10 mm, and exposure period 20 weeks
2.11
0.04
1.87556
1.40667 1.17222 0.937778 0.703333 0.468889
Chloride penetration depth (m)
1.64111
0.035
0.234444 0
0.03 0.025 0.02 0.015 0.01 0.005 0 −0.02 −0.015 −0.01 −0.005 0 0.005 Dimension (m)
0.01
0.015
0.02
Analysis results from our proposed discrete crack model Analysis results from equivalent chloride ion diffusion coefficient (c) Analysis results from equivalent diffusion coefficient method
(d) Comparison of analyzed results from different methods
Figure 7: Comparison between discrete crack model and equivalent diffusion coefficient method.
Figure 6. Figure 6(a) shows geometry model. Crack width is 0.3 mm, crack depth is 10 mm, the distance between two cracks is 10 mm, and exposure period is 20 weeks. Figure 6(b) shows the meshing of cracked concrete with two equalwidth cracks. Figure 6(c) shows the analysis results about chloride concentration contour. The maximum chloride concentration occurs at the tip of crack. For the zones between two cracks, chloride concentration is lower than that at the tip of crack. As shown in Figure 6(d), concrete with two cracks shows higher penetration depth than that with single crack. It means that, with the increase of crack number or decrease of crack spacing, more chloride ions will penetrate into concrete. Figure 7 shows the comparison about calculation results between our proposed discrete crack model and equivalent diffusion coefficient method (proposed in [6–9]). Figure 7(a)
shows the geometry model (concrete with an equal-width crack in the bottom zone). As shown in Figure 7(b), based on concept of equivalent diffusion coefficient, the geometry is divided into two parts [25, 26]. The equivalent diffusion coefficients in bottom zone 𝐴 1 are calculated using twophase parallel model of cracked concrete. The diffusion coefficient in the upper sound zone 𝐴 2 is the same as sound concrete. The analyzed chloride concentration contour and chloride penetration depth are shown in Figures 7(c) and 7(d), respectively. As shown in Figure 7(d), for cracked zone, the calculation results from equivalent diffusion coefficient method and our proposed discrete crack model are similar. For other zones, equivalent diffusion coefficient method [6– 9] cannot correctly calculate the distribution of chloride concentration because this method does not consider local effect of crack. Contrastively, our proposed discrete crack
10 model is a two-dimensional finite element analysis and can describe the distribution of chloride concentration in cracked concrete.
4. Conclusions This paper presents a numerical procedure to simulate chloride ingression into cracked concrete with different crack geometry characteristics. The influences of crack width, crack depth, crack shape, and crack spacing on ingression process are considered. It is found that, with the increase of crack width, crack depth, and crack amount, chloride ingression will aggravate. By using two-dimensional finite element analysis, the proposed discrete crack model can achieve better solutions about chloride concentration in cracked concrete compared to equivalent diffusion coefficient method. This study focuses on the influence of crack geometry characteristic on chloride transport. The effect of loadings and stress on chloride diffusion coefficient are not taken into account in this study. For reinforced concrete with both structural loadings and cracks, concrete around cracked zone may be damaged due to tensional stress or propagations of fracture process zone. This damage will increase chloride diffusion coefficient of concrete around cracked zone. For evaluating the service life of reinforced concrete structures, to consider the influence of stress state on transport property of concrete, the coupled analysis among structural stress, crack propagation, and chloride transport is necessary.
Competing Interests The authors declare that they have no competing interests.
Acknowledgments This research was supported by Basic Science Research Program through the National Research Foundation of Korea (NRF) funded by the Ministry of Science, ICT & Future Planning (no. 2015R1A5A1037548).
References [1] X.-Y. Wang and H.-S. Lee, “Modeling the hydration of concrete incorporating fly ash or slag,” Cement and Concrete Research, vol. 40, no. 7, pp. 984–996, 2010. [2] X.-Y. Wang and H.-S. Lee, “Modeling of chloride diffusion in concrete containing low-calcium fly ash,” Materials Chemistry and Physics, vol. 138, no. 2-3, pp. 917–928, 2013. [3] M. Ismail, A. Toumi, R. Franc¸ois, and R. Gagn´e, “Effect of crack opening on the local diffusion of chloride in inert materials,” Cement and Concrete Research, vol. 34, no. 4, pp. 711–716, 2004. [4] M. Ismail, A. Toumi, R. Franc¸ois, and R. Gagn´e, “Effect of crack opening on the local diffusion of chloride in cracked mortar samples,” Cement and Concrete Research, vol. 38, no. 8-9, pp. 1106–1111, 2008. [5] M. S¸ahmaran, “Effect of flexure induced transverse crack and self-healing on chloride diffusivity of reinforced mortar,” Journal of Materials Science, vol. 42, no. 22, pp. 9131–9136, 2007.
Advances in Materials Science and Engineering [6] B. G´erard and J. Marchand, “Influence of cracking on the diffusion properties of cement-based materials. Part I. Influence of continuous cracks on the steady-state regime,” Cement and Concrete Research, vol. 30, no. 1, pp. 37–43, 2000. [7] S. Y. Jang, B. S. Kim, and B. H. Oh, “Effect of crack width on chloride diffusion coefficients of concrete by steady-state migration tests,” Cement and Concrete Research, vol. 41, no. 1, pp. 9–19, 2011. [8] S.-S. Park, S.-J. Kwon, and S. H. Jung, “Analysis technique for chloride penetration in cracked concrete using equivalent diffusion and permeation,” Construction and Building Materials, vol. 29, pp. 183–192, 2012. [9] S. J. Kwon, U. J. Na, S. S. Park, and S. H. Jung, “Service life prediction of concrete wharves with early-aged crack: probabilistic approach for chloride diffusion,” Structural Safety, vol. 31, no. 1, pp. 75–83, 2009. [10] W.-J. Fan and X.-Y. Wang, “Prediction of chloride penetration into hardening concrete,” Advances in Materials Science and Engineering, vol. 2015, Article ID 616980, 8 pages, 2015. [11] X.-Y. Wang, “Simulation of temperature rises in hardening portland cement concrete and fly ash blended concrete,” Magazine of Concrete Research, vol. 65, no. 15, pp. 930–941, 2013. [12] X.-Y. Wang, “Properties prediction of ultra high performance concrete using blended cement hydration model,” Construction and Building Materials, vol. 64, pp. 1–10, 2014. [13] X.-Y. Wang, “Evaluation of compressive strength of hardening silica fume blended concrete,” Journal of Materials Science, vol. 48, no. 17, pp. 5953–5961, 2013. [14] X.-Y. Wang, “Effect of fly ash on properties evolution of cement based materials,” Construction and Building Materials, vol. 69, pp. 32–40, 2014. [15] W. L. Jin, Y. D. Yan, and H. L. Wang, “Chloride diffusion in the cracked concrete,” in Fracture Mechanics of Concrete and Concrete Structures—Assessment, Durability, Monitoring and Retrofitting of Concrete Structures, B.-H. Oh, Ed., Korea Concrete Institute, Seoul, South Korea, 2010. [16] G. De Schutter, “Quantification of the influence of cracks in concrete structures on carbonation and chloride penetration,” Magazine of Concrete Research, vol. 51, no. 6, pp. 427–435, 1999. [17] K. Maekawa, T. Ishida, and T. Kishi, Multi-Scale Modeling of Structural Concrete, Taylor & Francis, London, UK, 2009. [18] K. Maekawa, R. Chaube, and T. Kishi, Modeling of Concrete Performance: Hydration, Microstructure Formation and Mass Transport, Routledge, London, UK, 1998. [19] I.-S. Yoon, “Chloride penetration through cracks in highperformance concrete and surface treatment system for crack healing,” Advances in Materials Science and Engineering, vol. 2012, Article ID 294571, 8 pages, 2012. [20] N. Otsuki, S. Nagataki, and K. Nakashita, “Evaluation of the AgNO3 solution spray method for measurement of chloride penetration into hardened cementitious matrix materials,” Construction and Building Materials, vol. 7, no. 4, pp. 195–201, 1993. [21] F. He, C. Shi, Q. Yuan, C. Chen, and K. Zheng, “AgNO3 -based colorimetric methods for measurement of chloride penetration in concrete,” Construction and Building Materials, vol. 26, no. 1, pp. 1–8, 2012. [22] Nordtest Method, “Concrete, mortar and cement-based repair materials: chloride migration coefficient from non-steady-state migration experiments,” NT Build 492, Nordtest, Espoo, Finland, 1999.
Advances in Materials Science and Engineering [23] C. Arya and J. B. Newman, “An assessment of four methods of determining the free chloride content of concrete,” Materials and Structures, vol. 23, no. 5, pp. 319–330, 1990. [24] C. Arya, N. R. Buenfeld, and J. B. Newman, “Assessment of simple methods of determining the free chloride ion content of cement paste,” Cement and Concrete Research, vol. 17, no. 6, pp. 907–918, 1987. [25] S. J. Kwon and U. J. Na, “Prediction of durability for RC columns with crack and joint under carbonation based on probabilistic approach,” International Journal of Concrete Structures and Materials, vol. 5, no. 1, pp. 11–18, 2011. [26] S. J. Kwon, H. W. Song, and K. J. Byun, “Durability design for cracked concrete structures exposed to carbonation using stochastic approach,” Journal of the Korean Society of Civil Engineers, vol. 25, pp. 741–750, 2005.
11
Journal of
Nanotechnology Hindawi Publishing Corporation http://www.hindawi.com
Volume 2014
International Journal of
International Journal of
Corrosion Hindawi Publishing Corporation http://www.hindawi.com
Polymer Science Volume 2014
Hindawi Publishing Corporation http://www.hindawi.com
Volume 2014
Smart Materials Research Hindawi Publishing Corporation http://www.hindawi.com
Journal of
Composites Volume 2014
Hindawi Publishing Corporation http://www.hindawi.com
Volume 2014
Journal of
Metallurgy
BioMed Research International Hindawi Publishing Corporation http://www.hindawi.com
Volume 2014
Nanomaterials
Hindawi Publishing Corporation http://www.hindawi.com
Volume 2014
Submit your manuscripts at http://www.hindawi.com Journal of
Materials Hindawi Publishing Corporation http://www.hindawi.com
Volume 2014
Journal of
Nanoparticles Hindawi Publishing Corporation http://www.hindawi.com
Volume 2014
Nanomaterials Journal of
Advances in
Materials Science and Engineering Hindawi Publishing Corporation http://www.hindawi.com
Volume 2014
Journal of
Hindawi Publishing Corporation http://www.hindawi.com
Volume 2014
Journal of
Nanoscience Hindawi Publishing Corporation http://www.hindawi.com
Scientifica
Hindawi Publishing Corporation http://www.hindawi.com
Volume 2014
Journal of
Coatings Volume 2014
Hindawi Publishing Corporation http://www.hindawi.com
Crystallography Volume 2014
Hindawi Publishing Corporation http://www.hindawi.com
Volume 2014
The Scientific World Journal Hindawi Publishing Corporation http://www.hindawi.com
Volume 2014
Hindawi Publishing Corporation http://www.hindawi.com
Volume 2014
Journal of
Journal of
Textiles
Ceramics Hindawi Publishing Corporation http://www.hindawi.com
International Journal of
Biomaterials
Volume 2014
Hindawi Publishing Corporation http://www.hindawi.com
Volume 2014