PROCEEDINGS, 42nd Workshop on Geothermal Reservoir Engineering Stanford University, Stanford, California, February 13-15, 2017 SGP-TR-212
Simulations of Carbon Dioxide Injection, Seismic Monitoring, and Well Logging for Enhanced Characterization of Faults in Geothermal Systems Andrea Borgia1, Curtis M. Oldenburg1, Rui Zhang2, Yoojin Jung1, Kyung Jae Lee1, Christine Doughty1, Thomas M. Daley1, Bilgin Altundas3, Nikita Chugunov3, T.S. Ramakrishnan3 1
Energy Geosciences Division 74-316C, Lawrence Berkeley National Laboratory, Berkeley, CA 94720 2
University of Louisiana at Lafayette, Lafayette, LA 3
Schlumberger-Doll Research, Cambridge, MA
[email protected],
[email protected],
[email protected],
[email protected],
[email protected],
[email protected],
[email protected],
[email protected],
[email protected],
[email protected] Keywords: EGS, CO2, Faults, Fractures, Characterization, Active seismic monitoring, Neutron capture well logging ABSTRACT Fault and fracture networks with permeability are essential in any geothermal field to provide surfaces for heat transfer and sufficient fluid production rates. Yet characterization of the geometry and hydrogeologic properties of natural faults, fractures, and stimulated fracture networks remains an outstanding problem. We propose to inject and produce supercritical CO 2 (scCO2) in and out of faults and fracture networks, using push-pull well experiments coupled with active-source geophysical monitoring and well logging to characterize the fault and fracture characteristics relevant to Enhanced Geothermal Systems (EGS). Replacing formation brine with scCO2 effectively increases the contrast in geophysical properties between fault/fractures and matrix. We present modeling results that explore the technical feasibility of the approach. Using TOUGH2-ECO2N, we simulate the injection and production of CO2 into a normal fault based on faults at the Brady’s geothermal field and model pressure and saturation conditions in the fault zone. Because of the combination of a dipping fault and scCO2 buoyancy, the injected CO2 plume grows upward in the fault gouge against the hanging wall. It does not enter the damage zone because of the non-wetting characteristics of scCO2 relative to the liquid phase, which keeps the gas in the gouge excluding it from the damage zone and matrix. The simulated CO2 injection results are used in the project to model seismic and well-logging approaches to fault characterization. Separate pressure-transient and coupled well-fault injection simulations are also being carried out. We model the response of the system to active seismic monitoring in time-lapse mode using anisotropic finite difference codes from SPICE with modifications for fracture compliance. Results to date show that even narrow fault and fracture zones filled with CO2 can be detected using Vertical Seismic Profiling (VSP). The active seismic simulations are complemented by modeling of well logging, with neutron capture and induction tools showing the most promise for high-temperature systems, especially if saline water pre-flushes are carried out. 1. INTRODUCTION Connected fractures and/or faults and associated permeability are essential in any geothermal field to provide surfaces for adequate heat transfer and sufficient fluid production rates. In many fields, fluid production is sustained by a small number of more prominent fractures and faults. Faults are obviously the best candidate for enhanced fluid production because they tend to have greater extent and permeability. At enhanced geothermal system (EGS) sites, stimulation of fractures is also done to allow hydraulic connection between the producing well and larger conductive faults (Genter et al., 2010). Therefore, strategies for reservoir development and stimulation will certainly benefit from enhanced fracture and fault network geometric and fluid-dynamic characterization. To achieve this characterization, we propose to inject and produce supercritical CO2 (scCO2) in and out of faults, using push-pull (injection/production) well operations, and to use active-source geophysical monitoring and well logging that are sensitive to CO2 saturation to enhance characterization of the fault zone. The key idea is to use CO2 to effectively increase the contrast in geophysical properties between fractures or fault zone materials and the matrix rock, improving characterization of the permeable features (Borgia et al., 2015; Oldenburg et al., 2016). The reasons that scCO2 are promising as an injectate to enhance geophysical contrast of faults and fractures are: (1) scCO2 is much more compressible than water at supercritical conditions, creating variations in stiffness tensor components and resulting seismic velocity; (2) scCO2 is non-wetting and will therefore tend to stay in the fault gouge or slip plane without entering the fine-grained matrix; (3) scCO2 is less viscous than ambient brine, facilitating fracture/fault permeation. (4) scCO2 is denser than other gases (like nitrogen or air) decreasing the buoyant rise of the CO 2 plume in vertical faults and fractures and thereby enabling better recovery during the pull phase. 1
Borgia, Oldenburg, Zhang, Jung, Lee, Doughty, Daley, Altundas, Chugunov, and Ramakrishnan
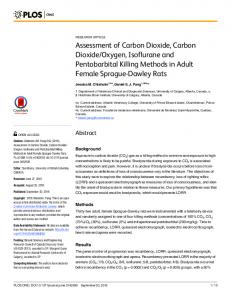
In this brief paper, we present example simulations of the injection of CO2 into a normal fault in topological conditions that are similar to those found at Rhyolite Ridge just north of the Brady’s geothermal field in Nevada. The simulations produce pressure and saturation conditions in the fault gouge that can be analyzed for their active seismic monitoring and wellbore logging response. Example simulations of geophysical monitoring are presented below to demonstrate the approach. 2. CONCEPTUAL MODEL Our “Brady’s type” conceptual fault model consists of a normal fault with a 60° dip (Fig. 1). The fault has a fault gouge, with a slipplane within it, and a damage zone on both sides of the fault gouge. Farther away is the unfractured rock matrix (Fig. 2).
Figure 1. Schematic Geologic cross section of the Rhyolite Ridge fault system at Brady’s geothermal field (modified after Faulds and Garside (2003). In our model we consider only the single fault on the right-hand side. In the simplest configuration, we use a 2D hydrogeologic fault model in order to evaluate the scCO2 injection and production processes. We model the various matrix rocks and include variations in properties of these formations depending on their locations in the damage zone or fault gouge. In the example numerical experiment shown here, we use homogeneous permeability for the cap rock and the reservoir matrix. Porosity and density are a function of rock type as shown in Table 1. Two-phase relative permeability is modeled after Corey (1954), while we use the van Genuchten (1980) model for capillary pressure (Pc). 3. SIMULATION OF CO2 INJECTION IN NORMAL FAULT We present for brevity one of the many numerical experiments that we have carried out for the Brady’s model system. The example case consists of a homogeneous fault gouge with larger permeability and smaller capillary pressure than the damage zone. In the experiment, we inject scCO2 at a location 2/3 of the distance from model top to bottom by fixing the pressure at 0.3 MPa above ambient hydrostatic pressure held at 100% CO2 saturation at the local temperature over the full thickness of the fault gouge (e.g., see Fig. 3a). Our grid is made of 10 m × 10 m elements in the across-fault (X) and down-dip (Z) directions. In the horizontal direction parallel to the fault direction (Y-direction) cells are 50 m wide. The grid has 93 grid blocks extending from -630 m below the surface to -1435.4 m below the surface including boundaries at top and bottom. The water table is assumed to be at -30 m from the ground surface. In the Xdirection cell dimensions vary from 10 m in the matrix, to 5 and 1 m in the damage zone, to 1 m and then down to 1 cm in the fault gouge, and finally to 1 cm in the slip plane (Fig. 2b). The boundary conditions are open to flow at the top and bottom. For the simulations we use TOUGH2-ECO2N (Pan et al., 2015), a module that represent the CO2 equation of state from 10 to 300 °C and up to 60 MPa.
2
Borgia, Oldenburg, Zhang, Jung, Lee, Doughty, Daley, Altundas, Chugunov, and Ramakrishnan (a)
(b)
Figure 2. Conceptual model and grid for the Brady’s 2D model. The 2D-fault has slip-plane (10-2 m in thickness), gouge (5 m on both side of slip plane), damage zone (10 m on both side of gouge) and intact matrix (10 m on both side of damage zone). The different rocks may change their hydrogeologic parameters if they are a part of the damage zone, gouge, and slip plane. Geology is after Faulds and Garside (2003). (a) no vertical or horizontal exaggeration; (b) 40 times horizontal exaggeration.
3
Borgia, Oldenburg, Zhang, Jung, Lee, Doughty, Daley, Altundas, Chugunov, and Ramakrishnan Table 1. Properties of the Brady’s system.
Hydrogeologic property High Permeability aquifer Matrix (Ryolitic Lavas): Damage zone: Fault gouge: Slip plane: Low Permeability Cover Matrix (Oligocente Tuff): Damage zone: Fault gouge: Slip plane: High Permeability Reservoir Matrix (Meta Sediments): Damage zone: Fault gouge: Slip plane: Low Permeability Basement Matrix (Intrusive Basement): Damage zone: Fault gouge: Slip plane:
(kg/m3)
kx,z (m )
Cp (Pa)
2650 2650 2650 2650
0.1 0.05 0.1 0.3
1.00E-16 1.00E-15 1.00E-12 1.00E-12
1.00E+08 1.00E+08 0 0
2450 2550 2550 2550
0.1 0.05 0.1 0.3
1.00E-16 1.00E-15 1.00E-12 1.00E-12
1.00E+08 1.00E+08 0 0
2550 2650 2650 2650
0.05 0.05 0.1 0.3
1.00E-16 1.00E-15 1.00E-12 1.00E-12
1.00E+08 1.00E+08 0 0
2750 2750 2750 2750
0.01 0.05 0.1 0.3
1.00E-19 1.00E-15 1.00E-12 1.00E-12
1.00E+08 1.00E+08 0 0
2
Although our conceptual model is simplistic, we consider it sufficient to show some of the complexities that arise during injection of CO2 into a normal fault and to reveal some of the challenges for geophysical imaging. Future numerical experiments will consider 3D geometry and injection into conjugate faults such as those at Dixie Valley, Nevada. Fig. 3 shows the results of the example case of a homogeneous fault gouge. Because of buoyancy and lower permeability in the basement rock, most of the CO2 flows upward along the fault gouge against the hanging wall. The CO 2 does not enter the damage zone because of its lower permeability and higher capillary pressure at the brine–scCO2 interface (Borgia et al., 2013). In less than 4 days the CO2 has reached the top of the domain. Because of decompression, the CO2 plume tends to expand in the x-direction at its upper extent, creating a “tooth” at 2 days. After 4 days, the fault gouge has been filled by a band of CO2 about 4 m thick. Most of these details of the flow are not evident in the model results shown without horizontal exaggeration (Fig. 3e). During the corresponding pull (production) process (not shown here for brevity) with production specified by setting pressure 4 MPa below ambient hydrostatic at the same point that CO2 was injected, practically no CO2 is recovered back into the well. Instead water flows back into the fault gouge largely supplied by water along the footwall side of the gouge.
4
Borgia, Oldenburg, Zhang, Jung, Lee, Doughty, Daley, Altundas, Chugunov, and Ramakrishnan (a)
(b)
(c)
(d)
(e)
Figure 3. 2D model of CO2 injection in a “Brady’s-type” normal fault with 60° of dip. Fault gouge and slip plane are homogeneous in hydrogeologic properties. Note how the CO2 plume develops against the hanging wall of the fault not entering the damage zone in the short time of the simulation. Note also the tooth that develops at the top of the plume. a) 1 day, b) 2 days, c) 4 days, d) 6 days, and e) the same results with no horizontal exaggeration. The inclined red line is made by the injection cells within the fault gouge.
5
Borgia, Oldenburg, Zhang, Jung, Lee, Doughty, Daley, Altundas, Chugunov, and Ramakrishnan SIMULATION OF ACTIVE SEISMIC MONITORING The next step in the workflow to demonstrate the use of CO2 injection for enhancing characterization of faults is to simulate the seismic response of the system. We simulate a surface seismic source located 40 m from the well in the up-dip direction with vertical seismic profiling (VSP) receivers in the well. CO2 saturation changes the stiffness component C11 in a very narrow region (the fault zone) as shown in Fig. 4, which shows C11 change as a result of the simulated saturations shown in Fig. 3. We model seismic wave propagation using a code based on SPICE (http://www.spice-rtn.org/library/software.1.html). The differences in C11 from pre-injection (no CO2) to post push (CO2 injection) produce time-lapse differences on the order of 1-2% percent as shown in Fig. 5. This difference is small but potentially detectable if high-quality data are collected. We are investigating how to enhance data quality, e.g., through optimal positioning of source and receivers, or using cross-well geometry to enhance signal.
Figure 4. Changes in C11 (GPa) arising from CO2 saturation in the fault zone as simulated in the push phase shown in Fig. 3.
Figure 5. Pre- and post-CO2-injection seismic modeling results along with the time-lapse difference on the order of 1-2%.
6
Borgia, Oldenburg, Zhang, Jung, Lee, Doughty, Daley, Altundas, Chugunov, and Ramakrishnan FEASIBILITY OF WELL-LOGGING METHODS Well logging provides another method of characterizing the fault zone following injection of CO 2 into the fault. Well logging could be conducted on a similar schedule as the VSP, i.e., before, during, and after the push-pull CO2 test. Utilization of the well for logging will require accessing the injection well. In our previous review summary Oldenburg et al. (2016), we noted that there is only a limited set of logging tools available for the EGS environment due to the high pressure, high temperature (HPHT) conditions. Sensitivity calculations suggested that induction logging (electrical conductivity) would to be the most promising measurement, although it would require either an open-hole environment or fiber-glass casing. Calculations also showed that neutron capture (HAPS) monitoring might be feasible for fault gouge (and limited for slip-plane and damage zone), provided there is enough salinity contrast, and condition that could be achieved by carrying out a pre-flush with high-salinity brine. Neutron capture is sensitive to formation properties around 5-10 inches (13-25 cm) into the formation. We present results of simulations using the Schlumberger code SNUPAR of neutron capture logging of the well at various potential locations intersecting the fault zone that is filled with CO2. Neutron capture cross-section (S [=] capture units) is sensed by gamma radiation returning to the tool. Differences in S greater than 1 capture unit are needed for positive detection of CO2. The capture cross-section (S) has contributions from the matrix and the fluid making it a function of porosity, salinity, saturation, pressure, and temperature. These properties are simulated using TOUGH2-ECO2N as presented above, and passed to the SNUPAR code for simulating the HAPS logging tool response. Capture cross-section is sensitive to CO2 saturation and increases approximately linearly with the water displaced. The SNUPAR simulation results are presented in Fig. 6 after six days of injection as shown in Fig. 3d. Results of HAPS response are shown along seven profile lines shown by the various colored symbols in Fig. 6 corresponding to different distances from the slip plane where X = 25 m is the slip plane. Neutron capture appears to be a very effective tool to supplement active seismic monitoring to locate CO2 in the fault zone.
Figure 6. Profiles of simulation results at 6 days from the SNUPAR code using the output of the TOUGH2-ECO2N runs as input. Colored symbols correspond to different sub-vertical profile lines through the system starting at the slip plane (X = 25 m) and moving to the left to X = 19.5 m. The second frame from the left-hand side shows the strong capture cross section signal that demonstrates that CO2 can be monitoring using neutron capture.
CONCLUSIONS We are carrying out modeling and simulation to test the technical feasibility of injecting CO 2 into fault zones to enhance geophysical contrast to improve monitoring that can be used to better characterize the fault zone. Simulations of the injection of CO 2 show that gravity effects cause the CO2 to preferentially flow up the hanging wall in the gouge zone of a fault dipping at 60 degrees. Seismic simulation of this CO2 shows small time-lapse changes that motivate improvements in signal-to-noise ratio for seismic detection, and/or use of cross-well configuration to enhance seismic detection of the CO2. Neutron capture well logging appears to be very capable of 7
Borgia, Oldenburg, Zhang, Jung, Lee, Doughty, Daley, Altundas, Chugunov, and Ramakrishnan detecting and characterizing the saturation distribution of CO2 in the fault gouge. Ongoing work is focused on 3D simulations, pressuretransient analysis, and data-worth analysis to inform the question of what kinds of monitoring data should be collected and where these data can most optimally be collected. ACKNOWLEDGMENTS Support for this work was provided by the Office of Energy Efficiency and Renewable Energy, Geothermal Technologies Office, U.S. Department of Energy. Additional support was provided by the Assistant Secretary for Fossil Energy (DOE), Office of Coal and Power Systems, through the National Energy Technology Laboratory (NETL), by Lawrence Berkeley National Laboratory under Department of Energy Contract No. DE-AC02-05CH11231, and by EDRA. Pre- and post-processing of TOUGH2 simulations is done using a free GMS license provided by Acquaveo™. REFERENCES Borgia, A., Pruess, K., Kneafsey, T.J., Oldenburg, C.M., Pan, L., 2013. Simulation of CO 2-EGS in a fractured reservoir with salt precipitation. Energy Procedia, 37, 6617-6624, doi:10.1016/j.egypro.2013.06.594. Borgia, A., Oldenburg, C.M., Zhang, R., Pan, L., Finsterle, S., Ramakrishnan, T.S., 2015. Simulations of CO 2 push-pull in fractures to enhance geophysical contrast for characterizing EGS sites. PROCEEDINGS, TOUGH Symposium 2015, Lawrence Berkeley National Laboratory, Berkeley, California, September 28-30, p. 109-115. Corey, A.T., 1954. The interrelation between gas and oil relative permeabilities. Producers monthly, 19(1), pp.38-41. Faulds, J.E., and Garside, L.J. 2003. Preliminary geologic map of the Desert Peak – Brady geothermal fields, Churchill County, Nevada, Nevada Bureau of Mines and Geology Open-File Report 03-27. Genter, A., Evans, K., Cuenot, N., Fritsch, D. and Sanjuan, B., 2010. Contribution of the exploration of deep crystalline fractured reservoir of Soultz to the knowledge of enhanced geothermal systems (EGS). Comptes Rendus Geoscience, 342(7), pp.502-516. Oldenburg, C.M., Daley, T.M., Borgia, A., Zhang, R., Doughty, C., Ramakrishnan, T.S., Altundas, B., Chugunov, N., 2016. Preliminary Simulations of Carbon Dioxide Injection and Geophysical Monitoring to Improve Imaging and Characterization of Faults and Fractures at EGS Sites. PROCEEDINGS, 41st Workshop on Geothermal Reservoir Engineering, Stanford University, Stanford, California, February 22-24, 2016, SGP-TR-209. Pan, L., Spycher, N., Doughty, C. and Pruess, K., 2016. ECO2N V2.0: A TOUGH2 fluid property module for modeling CO 2-H2ONaCL systems to elevated temperatures of up to 300°C. Greenshouse Gases Science and Technology. DOI: 10.1002/ghg.1617. van Genuchten, M.T., 1980. A closed-form equation for predicting the hydraulic conductivity of unsaturated soils. Soil science society of America journal, 44(5), pp.892-898.
8