Journal of Pharmaceutical and Biomedical Analysis 146 (2017) 302–313
Contents lists available at ScienceDirect
Journal of Pharmaceutical and Biomedical Analysis journal homepage: www.elsevier.com/locate/jpba
Simultaneous determination of pentoxifylline, metabolites M1 (lisofylline), M4 and M5, and caffeine in plasma and dried blood spots for pharmacokinetic studies in preterm infants and neonates Madhu Page-Sharp a , Tobias Strunk b,c , Sam Salman c , Julie Hibbert b , Sanjay K. Patole b,c , Laurens Manning c,d , Kevin T. Batty a,∗ a
School of Pharmacy, Curtin University, Bentley, Western Australia, Australia King Edward Memorial Hospital for Women & UWA Centre for Neonatal Research and Education, University of Western Australia, Subiaco, Western Australia, Australia c School of Medicine and Pharmacology, University of Western Australia, Crawley, Western Australia, Australia d Harry Perkins Research Institute, Fiona Stanley Hospital, Murdoch, Western Australia, Australia b
a r t i c l e
i n f o
Article history: Received 21 May 2017 Received in revised form 17 August 2017 Accepted 19 August 2017 Available online 26 August 2017 Keywords: Pentoxifylline Caffeine Neonates LC–MS/MS Plasma Dried blood spots
a b s t r a c t Advances in bioanalytical methods are facilitating micro-volume and dried blood spot (DBS) analysis of drugs in biological matrices for pharmacokinetic studies in children and neonates. We sought to develop a UPLC–MS/MS assay for simultaneous measurement of caffeine, pentoxifylline (PTX) and three metabolites of PTX in both plasma and DBS. Caffeine, PTX, the metabolites M1 (lisofylline), M4 and M5, and the internal standards (caffeine-d9 and PTX-d6 ) were separated using a Waters Aquity T3 UPLC C18 column and gradient mobile phase (watermethanol-formic acid). Retention times for caffeine, M5, M4, PTX and M1 were 1.6, 1.7, 1.9, 2.0 and 2.1 min, respectively, with a run time of 5 min. The precision (≤10%) and accuracy (≤15%) across the concentration range 0.1–50 mg/L for caffeine, PTX and the three metabolites in plasma and DBS were within accepted limits, as were the limits of quantification (100 g/L for caffeine and 10 g/L for PTX, M1, M4 and M5). Caffeine, PTX and the metabolites were stable in DBS for >34 days at room and refrigerated temperatures. Plasma and DBS samples were obtained from 24 preterm infants recruited into a clinical pharmacokinetic study of PTX. Paired analysis indicated that DBS concentrations were 9% lower than concurrent plasma concentrations for caffeine, 7% lower for PTX (consistent with the blood:plasma ratio) and 13% lower for M1 (lisofylline). The validated UPLC–MS/MS method is suitable for micro-volume plasma and DBS analysis of caffeine, PTX and its metabolites for pharmacokinetic studies in paediatric patients. © 2017 Elsevier B.V. All rights reserved.
1. Introduction Pentoxifylline (PTX; Fig. S1) is a methylxanthine derivative and phosphodiesterase inhibitor, which has been used for decades in the treatment of peripheral vascular disease and other circulatory disorders, including intermittent claudication [1,2]. More recently, the immunomodulatory and haemorrheological properties of PTX have led to its use in serious neonatal inflammatory conditions such as sepsis and necrotizing enterocolitis (NEC), and heart fail-
∗ Corresponding author at: School of Pharmacy, Curtin University, GPO Box U1987, Perth, Western Australia, Australia. E-mail address:
[email protected] (K.T. Batty). http://dx.doi.org/10.1016/j.jpba.2017.08.030 0731-7085/© 2017 Elsevier B.V. All rights reserved.
ure, chronic kidney disease and wound care in older patients [3–9]. Pharmacokinetic studies in adult patients have shown that PTX is metabolised to at least seven metabolites, including three that are considered to be pharmacologically active − lisofylline (M1), M4 and M5 [1,3,10–13]. M1 is the principal metabolite and although it has a chiral centre, biotransformation of PTX to the (S)-enantiomer of M1 is favoured in vivo [10]. Our interest is in the emerging role of PTX in neonatal late-onset sepsis (LOS) and NEC [3–6]. However, there is a paucity of pharmacokinetic data for PTX in neonates and high-risk, preterm infants with the highest burden of LOS and NEC [13]. Moreover, few bioanalytical methods have been validated for pharmacokinetic studies using very small volumes of biological matrix. Szymura-Oleksiak et al. [13] reported a HPLC-UV method for PTX, M1, M4 and M5
M. Page-Sharp et al. / Journal of Pharmaceutical and Biomedical Analysis 146 (2017) 302–313
303
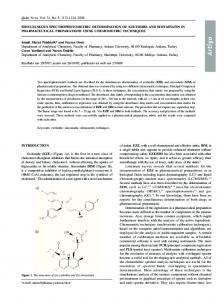
Fig. 1. Chromatograms showing blank plasma (A) and plasma spiked with analytes at 2.5 mg/L (B). In panel B, peaks are caffeine (peak 2; tR = 1.6 min), pentoxifylline (PTX; peak 7; tR = 2 min) and the PTX metabolites, M1 (peak 4; tR = 2.1 min), M4 (peak 5; tR = 1.9 min) and M5 (peak 6; tR = 1.7 min). M1 and M4 appear overlayed due to the same multiple reaction monitoring (MRM). Intensity of background noise in blank plasma was generally 10:1 and precision and accuracy within ± 20% of the nominal value [35]. The lower
limit of detection (LOD) was determined from a signal to noise ratio ≥3:1.
2.6. Dried blood spot (DBS) method development and validation Whole blood was collected from healthy adult volunteers using standard venepuncture and lithium heparin blood collection tubes. We had previously determined that abstinence from caffeinated beverages and food (coffee, tea, chocolate) for at least 4 days would ensure the volunteers’ blood was caffeine-free. The venous haematocrit was measured using a haemocentrifuge (Kendro Laboratory Products GmbH, Hanau, Germany) at 5000 rpm for 5 min. Standard curve and quality control samples (QCS) were prepared using 10 L of relevant working standards spiked into 1 mL of whole blood, in order to maintain consistency of added volumes. QCS were prepared at concentrations of 0.1, 1, 5, 20 and 50 mg/L to validate the accuracy, and at 0.1, 1, 10 and 50 mg/L to determine the precision of the assay. Standard curve ranges were 0.01–50 mg/L for PTX, M1, M4 and M5. The standard curve range for caffeine
306
M. Page-Sharp et al. / Journal of Pharmaceutical and Biomedical Analysis 146 (2017) 302–313
Fig. 4. Chromatograms from the dried blood spot (DBS) assay showing drug-free DBS (A) and spiked DBS with analytes at 2.5 mg/L (B). In panel B, peaks are caffeine (peak 2; tR = 1.6 min), pentoxifylline (PTX; peak 7; tR = 2 min) and the PTX metabolites, M1 (peak 4; tR = 2.1 min), M4 (peak 5; tR = 1.9 min) and M5 (peak 6; tR = 1.7 min). M1 and M4 appear overlayed due to the same multiple reaction monitoring (MRM). Intensity of background noise in drug-free DBS was 10 mm), air-dried at room temperature for 2 h, placed in a foil bag with mini silica gel and stored in a freezer until analysed. Otherwise, the blood samples (each approximately 100–150 L) were centrifuged to obtain the plasma (normally at least 50 L) which was stored at −80 ◦ C until analysed. 2.10. Statistical analysis General data analysis and representation were performed with SigmaPlot v13 (Systat Software, San Jose, CA). Data are mean ± standard deviation (SD) unless otherwise indicated. Passing-Bablok nonparametric regression analyses [45] and Lin’s concordance correlation coefficient (c ) were performed with NCSS v11 Statistical Software (NCSS, LLC, Kaysville, UT). As Lin’s correlation quantifies the strength of agreement between two methods of measurement and detects departure from the 45◦ line through the origin, it is an appropriate test to compare paired drug concentrations in different matrices, such as plasma and dried blood spots [46,47]. Bland-Altman difference plots were prepared to complement the Passing-Bablok regression plots [32,36,38,47]. The upper and lower 95% confidence limits for the Bland-Altman plot were
Features of the present method are the simultaneous analysis of caffeine, pentoxifylline and three PTX metabolites from small volumes of human plasma, and the adaptation of this method for DBS analyses. Simple extraction methods and a swift run-time (4 days and subsequent analysis confirmed the matrices were caffeine-free for the assay validation. 3.2. Plasma method validation 3.2.1. Matrix effect and recovery The matrix effect, process efficiency and recovery in plasma are shown in Table S2. With the exception of M1 (lisofylline) efficiency and recovery, the results were generally in the acceptable range of 90–110% [42,48] and compare favourably with other bioanalytical methods [12,14,49]. Blank and zero time plasma samples from the preterm infants demonstrated no apparent interference with analyte specificity (Fig. 1). Storage stability of the analytes in plasma was not addressed in the present study. Two previous reports have found that PTX, M1 and M5 were stable in plasma at −20 ◦ C for at least 3 and 8 months respectively [12,14]. 3.2.2. Linearity and calibration range All plasma standard curves were linear (r2 ≥ 0.998). The standard curve range for PTX and its metabolites (0.01–50 mg/L) and the QC sample concentrations were based on previous reports of PTX pharmacokinetics [12–14]. The concentration ranges of the patient samples for PTX, M1, M4 and M5 were 0.08–23 mg/L, 0.2–49 mg/L, 0.04–1.8 mg/L and 0.05–13 mg/L, respectively. The standard curve range for caffeine (0.1–100 mg/L) also was based on previous reports of caffeine pharmacokinetics [19,20,26,27] and was found to be relevant in the present study, with a caffeine plasma concentration range in the patient samples of 2–59 mg/L. 3.2.3. Accuracy and precision The precision (RSD ≤ 8%) and accuracy (≤13%) across the concentration range 0.1–50 mg/L for caffeine, PTX and its metabolites in plasma are shown in Table 1. These results were within accepted limits of 20% and 15% of nominal values for precision and accuracy respectively [43,50]. 3.2.4. Limit of quantification and limit of detection The 10:1 signal to noise ratios for caffeine, PTX, M1, M4 and M5 were at concentrations of 60 g/L, 2 g/L, 3 g/L, 7 g/L and 5 g/L respectively, from which the LLOQ and lowest concentrations of the standard curve were established as 100 g/L for caffeine and 10 g/L for PTX, M1, M4 and M5. At the LLOQ for caffeine in plasma (100 g/L), the mean intraday accuracy was 107% (n = 5; 95% CI 94–120%; range 95–119%) and the mean inter-day accuracy was 106% (n = 15; 95% CI 100–111%;
M. Page-Sharp et al. / Journal of Pharmaceutical and Biomedical Analysis 146 (2017) 302–313
309
Table 1 Accuracy and precision for caffeine, PTX, and the pentoxifylline metabolites, M1 (lisofylline), M4 and M5 in plasma. Data are mean ± SD. Accuracy (%; n = 10)
0.1 mg/L
1 mg/L
5 mg/L
20 mg/L
50 mg/L
Caffeine Pentoxifylline M1 (Lisofylline) M4 M5
96 ± 7 92 ± 9 91 ± 9 103 ± 7 90 ± 7
97 ± 11 94 ± 5 94 ± 6 90 ± 5 92 ± 7
109 ± 8 106 ± 5 104 ± 6 113 ± 6 108 ± 6
104 ± 6 106 ± 5 101 ± 5 96 ± 5 98 ± 8
103 ± 5 97 ± 4 103 ± 5 103 ± 6 104 ± 6
Precision (RSD; %) Caffeine Intra-day (n = 5) Inter-day (n = 25) Pentoxifylline Intra-day (n = 5) Inter-day (n = 25) M1 (Lisofylline) Intra-day (n = 5) Inter-day (n = 25) M4 Intra-day (n = 5) Inter-day (n = 25) M5 Intra-day (n = 5) Inter-day (n = 25)
0.1 mg/L
0.5 mg/L
1 mg/L
2.5 mg/L
5 mg/L
10 mg/L
20 mg/L
30 mg/L
50 mg/L
7.4 4.1
8.1 5.5
4.7 4.7
7.0 5.9
4.0 2.9
3.6 3.7
3.6 4.8
2.8 4.1
4.9 1.7
3.1 3.8
4.3 4.1
4.8 4.9
5.4 3.7
5.9 3.6
5.8 3.4
7.6 4.2
4.3 2.8
6.7 4.0
3.8 1.6
1.1 2.0
5.2 3.7
4.3 5.1
1.3 1.7
4.9 2.7
5.6 3.9
3.1 3.2
4.9 3.1
4.5 5.6
5.2 2.7
2.4 3.9
4.0 4.4
2.7 1.7
2.8 2.2
3.9 3.4
1.6 2.6
2.5 4.1
6.6 5.3
3.5 2.6
4.9 3.5
4.2 5.5
1.7 2.3
3.0 1.9
5.3 3.9
1.8 2.5
2.8 2.5
Table 2 Accuracy and precision for caffeine, PTX, and the pentoxifylline metabolites, M1 (lisofylline), M4 and M5 in dried blood spots (DBS). Accuracy data are mean ± SD. Accuracy (%; n = 10)
0.1 mg/L
1 mg/L
5 mg/L
20 mg/L
50 mg/L
Caffeine Pentoxifylline M1 (Lisofylline) M4 M5
94 ± 9 103 ± 9 106 ± 6 95 ± 9 93 ± 11
95 ± 9 97 ± 5 97 ± 9 93 ± 9 94 ± 7
108 ± 4 106 ± 9 113 ± 5 106 ± 5 107 ± 5
115 ± 4 110 ± 8 114 ± 6 103 ± 7 111 ± 9
96 ± 6 96 ± 4 104 ± 4 104 ± 4 104 ± 5
Precision (RSD; %) Caffeine Intra-day (n = 5) Inter-day (n = 15) Pentoxifylline Intra-day (n = 5) Inter-day (n = 15) M1 (Lisofylline) Intra-day (n = 5) Inter-day (n = 15) M4 Intra-day (n = 5) Inter-day (n = 15) M5 Intra-day (n = 5) Inter-day (n = 15)
0.1 mg/L
1 mg/L
10 mg/L
50 mg/L
9.9 8.5
9.1 6.6
7.3 6.1
1.5 1.9
3.1 5.6
6.1 5.4
7.2 4.9
2.5 3.6
9.5 1.6
1.6 2.7
6.5 5.7
2.3 2.6
8.2 5.6
6.9 5.6
8.4 6.9
6.3 5.0
2.4 5.3
7.8 4.6
9.7 5.3
6.7 4.5
range 88–119%). The intra-day and inter-day precision at LLOQ was 9.9% and 9.4% respectively. The mean intra-day accuracy at the LLOQ (10 g/L; n = 5) was 102% for PTX (95% CI 84–119%; range 85–120%), 94% for M1 (95% CI 80–108%; range 80–110%), 100% for M4 (95% CI 81–118%; range 84–120%), and 107% for M5 (95% CI 90–124%; range 90–120%). The intra-day precision at LLOQ was 14.0%, 12.1%, 14.9% and 12.8% for PTX, M1, M4 and M5 respectively. The mean inter-day accuracy at the LLOQ (10 g/L; n = 15) was 105% for PTX (95% CI 97–113%; range 85–130%), 94% for M1 (95% CI 88–101%; range 80–120%), 98% for M4 (95% CI 90–105%; range 80–120%), and 107% for M5 (95% CI 99–114%; range 81–130%). The inter-day precision at LLOQ was 14.0%, 12.8%, 13.5% and 13.1% for PTX, M1, M4 and M5 respectively. The intra-day and inter-day accuracy and precision was within ±20% of the nominal value at the LLOQ for all analytes in plasma. The LLOQ compared favourably with the lowest concentrations from the patients’ plasma samples, which were 2 mg/L, 80 g/L,
200 g/L, 40 g/L and 50 g/L for caffeine, PTX, M1, M4 and M5 respectively. The LOD for caffeine, PTX, M1, M4 and M5 in plasma were 20 g/L, 1 g/L, 1 g/L, 3 g/L and 2.5 g/L, respectively. 3.3. Dried blood spot (DBS) method validation 3.3.1. Matrix effect and recovery The matrix effect, process efficiency and recovery in DBS at four concentrations and five haematocrits are shown in Table S3. For caffeine and PTX, the matrix effect and recovery were generally in the acceptable range of 85–115% [30,34]. By comparison, the matrix effect, process efficiency and recovery for the three metabolites were predominantly in the range of approximately 80–110%, and most likely to be 34 days (kD < 0.0015 days−1 ) for caffeine, PTX, M1, M4 and M5 at all temperatures and both the high and low concentrations (complete data not shown). The four-week thermal stability investigations in the present study indicate that long term, frozen storage of DBS will be acceptable; however, this requires confirmation in future studies. 3.4. Comparison between plasma and dried blot spot (DBS) in assay validation The blood to plasma partition ratios for caffeine, PTX, M1, M4 and M5 were approximately 1.0, 0.9, 1.1, 1.0 and 1.0 respectively (Table 3). Our data accord with the reported blood to plasma partition ratio for caffeine of 1.0 [27]. By comparison, Nicklasson et al. reported the blood to plasma concentration ratio was 0.84 for (S)-M1 and was concentration-dependent for PTX, albeit approximately 0.9 at 0.5–3 mg/L [10].
M. Page-Sharp et al. / Journal of Pharmaceutical and Biomedical Analysis 146 (2017) 302–313
311
Fig. 8. Comparison of plasma and DBS concentrations from 24 preterm infants treated with caffeine and pentoxifylline. Panel A (left) shows a Passing-Bablok regression plot for caffeine (DBS = −1.34 + 0.91 × plasma; 95% confidence interval of the slope = 0.85-0.98; c = 0.88 (95% CI = 0.84–0.91); n = 110 paired samples; line of unity (—)). Panel A (right) shows a Bland-Altman plot of percent difference versus mean caffeine concentration (plasma + DBS; mg/L). The solid horizontal line is mean percent difference (17%; SD = 15%); the dashed lines are the upper and lower 95% confidence limits (± 1.96 × SD (36)).
312
M. Page-Sharp et al. / Journal of Pharmaceutical and Biomedical Analysis 146 (2017) 302–313
A strong correlation (c ≥ 0.993) was observed between plasma (50 L) and DBS (50 L spot) calibration curves (concentration range 0.1–20 mg/L) in the validation studies using blood from healthy adult volunteers. The Passing-Bablok slopes (95% CI) for caffeine, PTX, M1, M4 and M5 were 0.97 (0.96–1.10), 1.01 (0.98–1.08), 1.03 (1.01–1.10), 1.05 (0.99–1.14) and 1.06 (0.98–1.08), respectively. Data from these calibration curves indicated a direct and accurate relationship between plasma and DBS for caffeine, PTX and the metabolites, whereby DBS concentrations would be within approximately 5% of the concurrent plasma concentrations. By comparison, the blood to plasma partition ratios suggested that DBS concentrations could be lower than the concurrent plasma concentrations for PTX, higher than plasma for M1 and close to unity for caffeine, M4 and M5. Given the relatively small sample sizes in each of these independent experiments and the overall scope of the validation studies, we conclude that type I errors are a plausible explanation for the apparent discrepancies. Nevertheless, in the context of clinical relevance, these findings have a modest quantitative influence. For example, differences in the blood to plasma partition ratio of 10% (i.e., 1.0 compared to 0.9 or 1.1) would reflect only a 5% variation in the plasma concentration that is estimated from a matching blood concentration, at a normal haematocrit (0.4–0.5). 3.5. Application of method Paired DBS and plasma samples for caffeine (n = 110), pentoxifylline (n = 83), lisofylline (M1; n = 83), M4 (n = 66 were above the LLOQ) and M5 (n = 82) were analysed and the concentrations compared by Passing-Bablok regression analysis and Bland-Altman plots (Fig. 8). The mean ± SD initial haematocrit of the 24 preterm infants was 0.34 ± 0.07 (range 0.23–0.54). The median (interquartile range) DBS and plasma caffeine concentrations were 28 (20–34) mg/L and 31 (24–42) mg/L respectively. The Passing-Bablok slope (95% CI) was 0.91 (0.85–0.98), indicating the overall DBS concentrations were approximately 9% lower than concurrent plasma concentrations in these 24 preterm infants (Fig. 8a). These results are comparable to the recent study by Bruschettini et al. [26] and demonstrate the value of additional method validation in relevant patient populations to complement the conventional validation protocols. Our data were further considered in the context of the European Medicines Agency (EMA) guideline on bioanalytical method validation [35], specifically the criteria for cross validation, which states “the difference between the two values obtained should be within 20% of the mean for at least 67% of the repeats”. We found that 59% of the samples were within ± 20% of the mean (plasma-DBS pairs) and 71% were within ± 25%, thus demonstrating that for caffeine, our cross validation results in this pilot study were marginally outside the EMA guideline. The median DBS and plasma PTX concentrations were 5.0 (1.7–8.7) mg/L and 5.5 (2.1–9.4) mg/L respectively. The PassingBablok slope (95% CI) was 0.93 (0.89–0.96), indicating the DBS concentrations were approximately 7% lower than concurrent plasma concentrations for PTX (Fig. 8b). These data are consistent with the blood to plasma ratio predictions and suggest that reliable comparisons can be made between DBS and plasma PTX concen-
trations. Furthermore, cross validation met the EMA guideline, as 71% of the samples were within ± 20% of the mean concentration (plasma-DBS pairs). The median DBS and plasma lisofylline (M1) concentrations were 12.2 (5.6–20.8) mg/L and 13.5 (4.8–24.5) mg/L respectively. The Passing-Bablok slope (95% CI) was 0.87 (0.82–0.94), reflecting average DBS concentrations 13% lower than plasma concentrations (Fig. 8c). This finding contrasts with the validation data and may be related to the patient group; however, the results provide further evidence of the need to validate DBS:plasma assay relationships in special patient groups. Cross validation analysis also was outside the EMA guideline, with 54% of the samples within ± 20% of the mean (plasma-DBS pairs) and 66% within ± 25%. The data for M4 (regression slope = 0.70) and M5 (regression slope = 0.63) demonstrated average DBS concentrations were ≥30% lower than plasma concentrations (Fig. 8d and e). Although only 25% of the samples were within ±20% of the mean, almost half were within ± 40% of the mean in the cross validation analysis for M4 and M5. Therefore, given the low concentrations of M4 and M5 compared to PTX and M1, the potential limitations associated with sub-optimal matrix effect and recovery at low analyte concentrations, and the apparently modest pharmacological effect of these metabolites [3], we conclude that cautious interpretation of the concentration-time data and pharmacokinetic parameters of M4 and M5 will be required in clinical pharmacokinetic studies of PTX. 4. Conclusion Our novel, validated UPLC–MS/MS method is suitable for microvolume plasma (10 L) and dried blood spot analysis of caffeine, pentoxifylline and its principal metabolite (M1, lisofylline) for clinical pharmacokinetic studies, including preterm infants and neonates. Simple extraction procedures, a short run time (