JOURNAL OF LIQUID CHROMATOGRAPHY & RELATED TECHNOLOGIES VOL. 40, NO. 10, 536–540 https://doi.org/10.1080/10826076.2017.1331172
none defined
Simultaneous determination of six perylenequinones in Shiraia sp. Slf14 by HPLC Zhiwu Tonga, Lingwen Maoa, Hailin Liangb, Zhibin Zhanga, Ya Wangb, Riming Yana, and Du Zhua,b a
Key Laboratory of Protection and Utilization of Subtropic Plant Resources of Jiangxi Province, Jiangxi Normal University, Nanchang, China; Key Laboratory of Bioprocess Engineering of Jiangxi Province, College of Life Sciences, Jiangxi Science and Technology Normal University, Nanchang, China
b
ABSTRACT
KEYWORDS
The aim of the study was to develop a rapid and sensitive analytical method for simultaneous determination of the hypocrellin A, hypocrellin B, hypocrellin C, elsinochrome A, elsinochrome B, and elsinochrome C content in the Huperzia serrata endophytic fungus Shiraia sp. Slf14. Separation was performed by high-performance liquid chromatography (HPLC) with an YMC-Triart C18 column (4.6 mm � 250 mm, 5 µm), elution with acetonitrile and triple-distilled water (volume ratio 70:30) as the mobile phase, a detection wavelength of 460 nm, and a flow rate of 1.0 mL/min. All six pigments were successfully determined with good linear correlations and a precision relative standard deviation 98% (HPLC) and their structures are shown
CONTACT Riming Yan
[email protected] Key Laboratory of Protection and Utilization of Subtropic Plant Resources of Jiangxi Province, Jiangxi Normal University, Nanchang 330022, China. Color versions of one or more of the figures in this article can be found online at www.tandfonline.com/ljlc. © 2017 Taylor & Francis
537
Z. TONG ET AL.
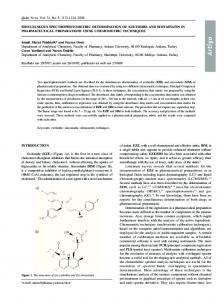
Figure 1. Structures of hypocrellin A, hypocrellin B, hypocrellins C, elsinochrome A, elsinochrome B, and elsinochrome C.
in Figure 1. Acetonitrile and methanol (HPLC grade) were bought from Merck (Darmstadt, Germany). Triple-distilled water was used and all other reagents were of analytical grade and were obtained from West Long Chemical Co. Ltd.
perylenequinone samples. All samples were injected five times, and the peak area and retention time were recorded.
Sample preparation
Appropriate chromatographic conditions
The dry powder of Shiraia sp. Slf14 (40-mesh sieve) was accurately weighed, and 1.0 g was to added 60 mL of acetone and sonicated at 30°C. To ensure maximum extraction, the sample was extracted twice under the same conditions, and the extracts were combined and concentrated by vacuum to yield extractum, which was dissolved in acetonitrile (10 mL) and filtered using a 0.22 µm membrane. The hypocrellin A standard (2 mg) was dissolved and diluted with acetonitrile to various concentrations (200, 120, 84, 40, 20, 10, 4, and 0.4 mg/L) to generate standard stock solutions. Elsinochrome A and hypocrellin C standards (1 mg) were similarly dissolved and diluted with acetonitrile to various concentrations (100, 80, 60, 40, 20, 12, 2, and 0.2 mg/L), as was elsinochrome B (0.8 mg; 0.2, 0.8, 2, 6, 15, 30, 60, and 80 mg/L) and hypocrellin B and elsinochrome C (0.6 mg; 0.2, 0.8, 2.4, 12, 24, 48, and 60 mg/L).
The most appropriate chromatographic conditions were determined based on the degree of separation between adjacent peaks and the total analysis time. Optimum conditions were as follows: An YMC-Triart C18 column (4.6 mm � 250 mm, 5 µm), a ratio of acetonitrile to water of 7:3, a flow rate of 1.0 mL/min, a column temperature of 25°C. As shown in Figure 2, there were almost no absorption peaks at 460 nm from impurities in the extractum, and this wavelength was therefore chosen for subsequent experiments. As shown in Figure 3, perylenequinone standard mixture was clearly
Results and discussion
Precision of the HPLC detection method Precision of the HPLC method was determined using two known concentrations of the six perylenequinone samples. All experiments were performed in triplicate at each concentration, and each sample was injected thrice. Peak area and retention time were used to calculate the concentration, and the peak area average was used to calculate the standard deviation of concentration and retention time. Reproducibility of the HPLC detection method Reproducibility of the HPLC method test was determined using known concentrations of standard solutions of the six
Figure 2. Spectra of perylenequinones and impurities showing absorbance at different wavelengths. (a) Elsinochrome, (b) hypocrellin, (c) Impurity 1, and (d) Impurity 2.
JOURNAL OF LIQUID CHROMATOGRAPHY & RELATED TECHNOLOGIES
538
Figure 3. HPLC chromatograms of perylenequinone standards (a) and the fermentation broth sample (b). 1, elsinochrome C; 2, elsinochrome B; 3, elsinochrome A; 4, hypocrellins A; 5, hypocrellins B; 6, hypocrellins C. Note: HPLC, high-performance liquid chromatography.
separated under the described conditions (A). According to the calibration curve, the concentration of HA, HB, HC, EA, EB, and EC in the real fermentation sample was 689.73, 27.82, 155.45, 635.29, 217.56, and 233.14 mg/L, respectively.
Y ¼ 24,900X 13,400 (R2 ¼ 0.9989) for EC (Table 1). The results showed that detection in the developed method was highly linear over the whole concentration range measured. Precision
Linearity A linear regression equation of the peak area (Y) and the concentration (X) was used to check the linearity of detection. Correlation coefficients (R2) were used to evaluate the linearity of the calibration curves. The equations were as follows: Y ¼ 28,100X 230,300 (R2 ¼ 0.9991) for HA; Y ¼ 39,500X 70,400 (R2 ¼ 0.9998) for HB; Y ¼ 29,507X 180,524 (R2 ¼ 0.9988) for HC; Y ¼ 43,800X 240,300 (R2 ¼ 0.9991) for EA; Y ¼ 42,800X 162,900 (R2 ¼ 0.999) for EB; and
The precision was validated using the relative standard deviation (RSD) of samples at the investigated concentrations. The results of precision experiments were characterized by RSD of sample concentrations and retention times. The results showed that RSD values for concentrations were lower than 2.2% for all six perylenequinones, and all RSD values for retention times were