Most previous MIR systems, however, assumed that the ..... one or two instruments (piano and/or guitar), this method .... and vibrato features,â in In Proc.
Singer and Music Discrimination based Threshold in Polyphonic Music Hassan Ezzaidi
Mohammed Bahoura
Jean Rouat
Department of Applied Sciences, University of Quebec at Chicoutimi, 550, boul. de l’Universit´e, Chicoutimi, Qc, Canada, G7H 2B1.
Department of Engineering, University of Quebec at Rimouski, 300, all´ee des Ursulines, Rimouski, Qc, Canada, G5L 3A1.
Dept. Elect. & Comp. Eng., University of Sherbrooke, 2500 boul. de l’Universit´e, Sherbrooke, Qc, Canada, J1K 2R1.
Abstract—Song and music discrimination play a significant role in multimedia applications such as genre classification and singer identification. Song and music discrimination play a significant role in multimedia applications such as genre classification and singer identification. The problem of identifying sections of singer voice and instrument signals is addressed in this paper. It must therefore be able to detect when a singer starts and stops singing. In addition, it must be efficient in all circumstances that the interpreter is a man or a woman or that he or she has a different register (soprano, alto, baritone, tenor or bass), different styles of music and independent of the number of instruments. Our approach does not assume a priori knowledge of song and music segments. We use simple and efficient threshold-based distance measurements for discrimination. Linde-Buzo-Gray vector quantization algorithm and Gaussian Mixture Models (GMMs) are used for comparison purposes. Our approach is validated on a large experimental dataset from the music genre database RWC that includes many styles (25 styles and 272 minutes of data). Keywords—music; song; discrimination; multimedia; singer.
I. I NTRODUCTION Increasing amounts of digital music information is today more readily available on the Internet, and public and private media supports (ipod, iphone, USB devices, etc.). Therefore, searching for music information now covers many areas depending on the desired task, such as archiving, filtering, searching, browsing, classification, synthesis, etc. Particularly, automatic speech, singer, music discrimination and language/artist identification play an important role in musical pieces to achieve a better performance for automatic transcription, identification, segmentation, tracking, verification singer, speech/music coding, audio indexing and musical genres systems. Singing voice is a useful descriptor of artist names of songs for music information retrieval (MIR) and classification by genre and/or artist name. The challenge of achieving automatic singer/music discrimination lies in the influence of accompaniment instruments, voiceprint and styles of singers. Most previous MIR systems, however, assumed that the metadata including artist names and song titles were available. When this information is not available, it is not possible to retrieve automatically by submitting a query based on artist or genre names [1]. To conduct automatic MIR system searches without a priori labeled metadata, new techniques are needed use the musical sound signal directly and extract relevant and pertinent information adequately, particularly the sequence of singing segments with the names of involved artists [1]. Little
research has been conducted on singer (artist) identification from digitized media documents for such applications as verification of identity or discrimination between instrumental and vocal sequences. Most systems use features and models similar to speech recognition and speaker identification methods [2], [3]. Vocal separation and detection of vocal regions have been widely used for this problem [4], [5]. Kim et al. [6] introduced a system that performs segmentation of vocal regions prior to singer identification. After segmentation, the classifier uses low and high features drawn from voice coding based on Linear Predictive Coding (LPC), although with some modifications. In fact, the low order MFCCs characterizing vocal track resonances and the high order MFCCs related to the glottal wave shape are used to identify and distinguish singers. According to these authors results, one can affirm that both subsets in essence contribute to vocal identification. But the high order subset is less sensitive to changes in singing style [6]. Behind the problem of automatically identifying singers is the difficulty in distinguishing between vocal and instrumental sounds. To solve this problem, accompaniment sound reduction and reliable frame selection were proposed [1]. Pitch and dynamics of sung melody were also examined as cues for singer recognition [7]. Kako et al. [8] proposed an automatic identification system, for singing style, based on sung melodic contours characterized in the phase plane. These authors confirm the effectiveness of the approach through experimental evaluation where 94.1% accuracy for singerclass discrimination was obtained. Vibrato, ornamentations and singing skill characterization were reported in [9]–[11]. “Pitch Extraction” and “1/12 OFCC” methods for singer identification are proposed by [7]. The Pitch Extraction method is composed of three stages: i) Singing pitch estimation stage, ii) Exact pitch calculation stage and iii) GMM classification stage. On the other hand, the “1/12 OFCC” method comprises two stages: “Pitch Feature Calculation” and GMM classification. With the “Pitch Extraction” and “1/12 OFCC” methods, improvements on singer identification using single feature is obtained. Mesaros et al. [4] propose two different approaches to singer identification: one where the acoustic features are extracted directly from the polyphonic signal and the other where the vocal line is first separated from the mixture using a predominant melody transcription system. Classification strategies include the discriminating functions, Gaussian mixture model (GMM)-based maximum likelihood classifier and nearest neighbor classifiers using Kullback-
Leibler divergence between the GMMs. It was found that vocal line separation enables reliable singer identification [4]. Vallet et al. [12] investigate the perceptual constraints for automatic vocal singer detection. They examine how the length of a sound excerpt influences the listeners perceptual ability to identify the presence of a singing voice, and whether or not the inclusion of note transients helps listeners to detect vocal content. The collected data is used to constrain the development of acoustic feature models for the automatic detection of singing voice in popular songs. The experiment revealed that even for the shortest excerpt length, 100 ms, subjects performed well above chance at detecting the vocal segments. For the two longest excerpt lengths (350 ms and 500 ms), subjects could also more easily discriminate vocal/nonvocal excerpts when transients were present [12]. We are interested in a system that performs automatic artist detection from a complete song. The system will have to label the complete sound file and identify the frames with vocal presence. We study various combinations of feature vectors along with different pattern classifiers. Conventional Mel Frequency Cepstral Coefficients (MFCC), Linear Predictive Coding (LPC) Coefficients, Centroids, Root Quadratic Means (RQM), Zero Crossing Rates (ZCR) and cochlear filter energies are used as feature parameters. The pattern recognition algorithms are built around adaptative thresholding, Gaussian Mixture Models (GMM), Linde- Buzo-Gray (LGB) and the likelihood ratio [13] techniques. Among these techniques, the adaptive thresholding we propose does not need prior knowledge or labeling of the music or singer. II. DATABASE A 68-musical piece of the RWC Music Genre Database is used. Pieces average four minutes and originate from more than 25 genres (Popular, Ballad, Rock, Heavy Metal, Rap/Hip-Hop, House, Techno, Funk, Soul/R&B, Big Band, Modern Jazz, Fusion, Bossa Nova, Samba, Reggae, Tango, Baroque, Classical, Romantic, Modern, Blues, Folk, Country, Gospel) with men and women vocalists. The musical pieces are numbered in the RWC database by: G01 xx to G05 xx and G07 xx. The duration of the whole database is approximately five hours, with three hours of instrumental music only. All the musical pieces used in our experiments have been hand labeled. For each file, we ask a person to listen on a segment-by-segment basis, each segment lasting one second. The listener is instructed to type 1 when a singer is heard and 0 when no vocal presence is detected. Each piece in the proposed database is split into two equal parts: the first half segment and the last half segment. The first half segments of all pieces are used as the set for training sessions. And the second half segments are grouped together and are never used in training sessions, but in testing sessions only as validation. III. F EATURE E XTRACTION Conventional parameters often used in speech or music classification and identification are considered.
A. Spectrum Gravity Center (Centroid) The spectral Centroid is the gravity center of the spectral energy distributions. It is the ratio of the sum of the weighted energies (the weights are equal to the frequency index k) divided by the total energy (sum of the magnitudes). The Centroid is a good indicator of the harmonic structure of the sound. It is supposed to be higher for music than for speech (even for singing speech). However, when vocal and instrumental music are present at the same time, the measure is at its highest as it to a certain extent constitutes the sum of the two cases. Therefore, it will be the higher of the two indices when music and speech are isolated. B. Root Mean Square (RMS) The Root Mean Square value of a signal is a statistical measure based on the square root of the average of the squares of the signal samples. r (x21 + x22 + . . . + x2N ) xrms = N C. Mel-Frequency Cepstral Coefficients (MFCC) In this paper, musical pieces are first down-sampled from 44.4 kHz to 16 kHz. Then the musical signal is divided into frames of 2,000 samples without overlapping. In fact, the musical signal is more stable and quasi-stationary than the speech signal (co-articulation phenomenon). For each frame, a Hanning window is applied without pre-emphasis. The Fourier power spectrum is computed and multiplied with a bank of 84 triangular transfer functions of Melfilters (to retrieve principally more harmonic components, and at the same time for comparison purposes with the CFB method described in the next section, which uses 80 channels). After the application of log operator for each output filters, a discrete cosine transform is used to obtain 24 coefficients in the cepstral space. D. Zero Crossing Rate (ZCR) Zero Crossing Rates provide a measure of noisiness or of instantaneous frequencies. E. Linear Predictive Coding (LPC) Linear Predictive Coding (LPC), also called autoregressive (AR) modeling, is widely used in signal processing and especially in speech processing applications. The linear prediction model (LPC) assumes that the current sample can be approximated by a linear combination of its past p samples (for more details see [5]). The LPC method is supposed to estimate the resonant frequencies system (vocal track, musical instrument, etc.). IV. P ROPOSED C LASSIFICATION T ECHNIQUES Distinguishing between vocal and instrumental sounds in music can be naively seen as a labeling into two classes. The first class is associated with musical sequences and a second with the song signal. However, the two-class model is far from ideal due to the rich information conveyed by
the singer (melody, form, prosody, sex, age, feeling, etc.) and the music (instruments, style, etc.). Several contributions have been proposed in the field of speaker identification to track and recognize one or more persons engaged in a conversation [13]. Inspired by the progress made over the past years in that field, we consider the following statistical classification approaches. A. Linde-Buzo-Gray Algorithm (LBG) LBG clustering is a method that aims to partition N observations into K clusters (prototypes or centers) in which each observation belongs to the cluster with the nearest distances. Strategy based on vector quantization using the LBG algorithm was investigated to calculate respectively 32, 64 and 128 centers (one codebook related to the music and second related to the vocal partitions). The use of this method is motivated by its simplicity.
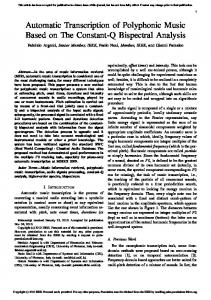
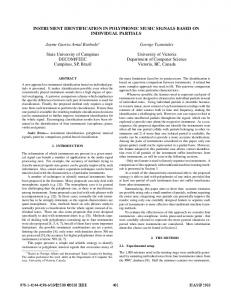
Fig. 1. In top, the threshold value estimated by the Residual Filtering method (RES). In bottom, we give the manual labeling by frame (song=1 and music=0).
B. Gaussian Mixture Models (GMMs) A powerful statistical method massively used for speaker identification/verification is the Gaussian mixture models (GMMs). In this approach, the distribution of the feature vectors is modeled by a weighted sum of N Gaussian densities (for more details see [14]). In this work, the system-based GMM model is seen as a system of reference. So, a comparison with unsupervised techniques will be discussed. C. Bayesian Information Criterion (BIC) Consider two consecutive segments of vectors spectral acoustic parameters (ex.: MFCC, LPC, etc.): xn, n=1 to N1 and yn, n= N1 +1 to N2, with N1 and N2 - N1, respectively the number of vectors in each segment. We need to examine the following hypotheses using the BIC criterion [13]: H0: The segments were generated by the same class (multivariate Gaussian model). H1: The segments were generated by different classes (multivariate Gaussian model). Let λ denote the likelihood ratio [13] between the two hypotheses, giving: λ=
L(z, µ12 , Σ12 ) L(x, µ1 , Σ1 )L(y, µ2 , Σ2 )
L(x, µ1 , Σ1 ) denotes the likelihood functions of the first x segment vectors. L(y, µ2 , Σ2 ) denotes the likelihood functions of the second y segment vectors. L(z, µ12 , Σ12 ): denotes the likelihood functions of the z segment vectors, where z is the concatenation of x and y segments; µ and Σ are the mean and covariance of the Gaussians, respectively. It is assumed that the segment probability density function is a Gaussian multivariate. The mean and covariance are estimated from all feature vectors for segments. It is supposed that the consecutive segments contain the same number of vectors. We used as parameters 24 MFCC coefficients with and without union of ZCR, Centroid and RMS coefficients. They are estimated from consecutive segments and union segments (x, y and z) by rhythm of 125 ms (frame) over a time
window of one second. For each frame, a measure of the logarithm of the inverse likelihood ratio log(1/λ) denoted F (t) is estimated. The last F (t) is calculated and cumulated over 8 frames (1 sec.). The detection of transition points (music/song) therefore consists in seeking a maximum. D. Residual Filtering (RES) Assuming that an instrumental signal is rhythmic and stationary compared to the vocal signal, we propose to first estimate, via LPC coefficients, the instrument resonance over a window with half-signal duration. Then, by using the estimated resonances, inverse filtering of the signal is used to enhance singer activity and to eliminate instrumental contributions. A 125 ms window length is used. Details of this strategy, which we denote RES, are given in the Results and Discussion Section. Fig. 1 is an example of this technique applied to the G01 1.wav signal. E. Cochlear Filter Bank Model (CFB) The energy of a Mel filter bank is estimated for every 84 channels with a rhythm of 125 ms (without overlapping). Here, we propose to estimate the covariance matrix of the energy vectors (84 dimensions over one second duration). To reduce the dimension, we keep only the trace of the covariance matrix. We denote this strategy as CFB. Note that for all approaches, the same analysis window and shifting were used for an identical length of feature vectors. Also, for all proposed systems, regardless of the parameters or classifiers in use, it provides an output that measures the richness of harmonic contents. This output is oriented to emphasize the abrupt transitions of formants and harmonics. V. R ESULTS AND D ISCUSSION A. Overviews and interpretations In this subsection, we present some results obtained on small database (other than RWC) in order to have an overall idea about the problematic posed. The choice of songs requires interpreters in different registers (soprano, alto, tenor and
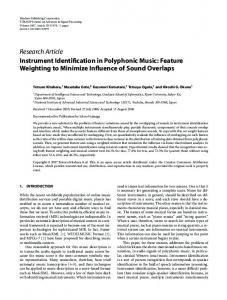
Fig. 2. RMS parameter for the singer’s vocal activity estimated from 1.5s to 3s and from 4s to 7s.
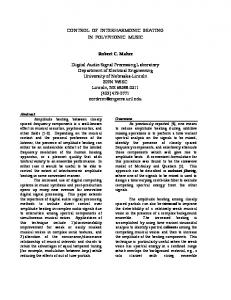
Fig. 3. RMS parameter for the singer’s vocal activity estimated from 5.6s to 8.5s.
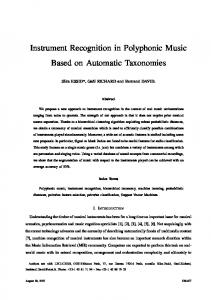
Fig. 4. Centroid parameter for the singer’s vocal activity estimated from 5.5s to 12s.
Fig. 5. Centroid parameter for the singer’s vocal activity estimated from 6s to 8s and from 9.5s to 13s.
baritone) and styles (alternative, rock, classical, pop, reggae and R & B). Each clip takes about 11 seconds and contains several instruments (keyboard, percussion, wind instruments and strings) and different number. Each of the extracts was chosen so that the presence of the interpreter occupies approximately half the time. These extracts will verify the reliability of the proposed techniques. Principally, this exploratory study has put in evidence the relevance of each item proposed, and especially its weaknesses and we showed that the use of
fixed thresholds for discrimination singing and music cannot function effectively. This led us to propose the approach to be more dynamic thresholds robust to variability registers and styles of the singer and instruments (next subsection). In general, the RMS signal increases when there is presence of the singer. In Fig. 2 (only the guitar is present), it illustrates the evolution of the RMS parameter where the singer’s voice activity is located in the intervals of 1.5s to 3s and 4s to 7s. There it possible to define a discriminatory threshold between singing and music. However, Fig. 3 shows an inconsistency with the observations above. Indeed, the singer begins and ends at 5.6s to 8.5s, while the average energy decreases during this interval. It was noted that the influence of the bass is stronger than all the other instruments would cause this result. Following the observations based on RMS criteria, detection of the singer can be performed when the singer has a higher volume than the instruments. Moreover, where there is only one or two instruments (piano and/or guitar), this method works well. However, a higher presence of bass, for example, is interfering with the results. Detection of the words sung by the signal energy becomes dependent on the recording of the song. The centroid of the spectrum of a musical signal is calculated on segments of 2,048 points for a sampling frequency of 22,050 Hz. Indeed, for a rich low frequency, the value will be lower and for its highest, the value will be higher. In the case of the singer, the frequency spectrum has a high contribution in the low frequencies and amplitudes significant beyond 500 Hz. A segment of the instrumental signal only has a spectrum with lower amplitudes and lower frequencies (below 50 Hz). It is expected that the centroid of the frequency spectrum will be lower in the presence of instruments and higher in the presence of the voice. The values of each centroid, calculated on 92.9ms, are placed in a vector so see the evolution of this parameter over time. It should be noted that a median filter of order 2 is applied to the output of the final vector to suppress noise. Fig. 4 shows the evolution of the centroid in time on the partition where the singer begins and ends at 5.5s to 12s. It is interesting to note that the centroid of the spectrum is influenced by the presence of the singer. Indeed, from 5.5s, the area under the curve increases significantly. Fig. 5 is the value of the centroid of the frequency spectrum in time of a musical piece segment. Here, the singer is present in the intervals of 6 to 8s and 9.5s to 13s. In this case, the area under the curve tends to increase slightly to 6s, but when the singer finished in the interval 8 to 9.5s, it does not decrease. It is therefore not possible to distinguish the voices of the instruments. The method by the centroid of the frequency spectrum is effective for music with a singer and only one or two instruments. Otherwise, the contribution of other instruments just affects detection. The ZCR method is based on detecting the passage by zero of the original signal. However, it is modified with a threshold to eliminate noise during the recording of the song. The value of this threshold is set at 20% of the maximum
based thresholds (see illustration in Fig. 1: the output (residual estimation) of BIC and how we could set the threshold to discriminate between the instrumental and vocal parts of music). We noted that thresholds vary widely depending on the style of music, which makes it very difficult to determine absolute thresholds. We propose to adapt thresholds for each style of music and for each window analysis. The proposed thresholds S1, S2 and S3 are calculated as follows: Fig. 6. ZCR parameter for the singer’s vocal activity estimated from 5.8s to 11s.
S1 = max(Output) ∗ α1 + min(Output) ∗ α2 S2 = max(Output) ∗ α3 + min(Output) ∗ α4 S3 = max(Output) ∗ α5 + min(Output) ∗ α6
Fig. 7. ZCR parameter for the singer’s vocal activity estimated from 1.5s to 3s and 4s to 7s.
value on the entire score followed by a median filter. Indeed, the determination of this threshold comes directly influence outcomes. In Fig. 6 is presented a graphical output based zero crossing rate parameter. The ZCR is significantly higher in the presence of the singer in the interval that begins and ends at 5.8s to 11s. In the partition of Fig. 7, the singer is involved in the intervals of 1.5s to 3s and 4s to 7s. We remarked on the graph at 7.5s, the sound of the guitar affect the detection of zeros given the significant increase at the end of the extract. ZCR method is seen inefficient and unreliable. Even with few instruments on the soundtrack, the results are not representative. This exploratory study with other results, we have oriented to use a dynamics thresholds estimated at each analysis window.
Where Output is the output result for BIC, RES and CFB analysis. αi is a variables set by the user to adjust the performance score. So, each threshold has two degrees of freedom among statistical measures that are estimated adaptively for each test file. Recall that theses thresholds are not predefined but depend on the statistical properties of each signal. The validation shall be carried out on data labeled song and music. A compilation of these results is presented in Table II. It is found that the use of MFCC coefficients with or without concatenation of other parameters (ZCR + Centroid + RMS) in the BIC approach does not significantly enhance the recognition scores, so afterwards we present only the results based on MFCC. We note that the threshold S2 yields the best results for the RES method. The thresholds S1 and S3 are more appropriate for the BIC and CFB methods. For the three approaches, using a threshold as a decision criterion, the best score is on the order of 63% overall. This score is 6% lower than the LBG score, and 16% lower than the GMM method. However, the threshold method requires no training and may possibly be subject to adjustments to improve performance. It is found that approaches based on thresholds render bad decisions on files containing only music and no singing. Thus, the estimate of threshold is not optimal. If we try to adjust the thresholds knowing in advance the presence or absence of song, we can significantly improve recognition scores. TABLE I S CORE RECOGNITION WITH SUPERVISED TRAINING .
B. Discussion In this subsection we present all results obtained with the standard database described in the RWC section II. For GMM and LBG pattern recognizer training, we used the first half of each sound file and the second half was used for testing sessions, as unseen data. Scores for the various proposed prototypes of LBG and Gaussian mixture reference systems are given in Table I. When recognition is made on training data, performance increases with the number of Gaussian mixtures (GMM) or Centroids (LBG). When recognition is made on the test set, scores decrease and are the same for all prototypes. It is known that the GMM models yield the best results following their statistical aspect. However, we note that the recognition scores of both approaches dropped nearly by 10% when using the test set instead of the training set. With the BIC, CFB and RES parameters, we apply discrimination-
Data GMM LBG
Train Test Train Test
Prototypes and Gaussian mixture 32 64 128 88% 91% 94% 79% 80% 81% 75% 77% 80% 70% 71% 71%
TABLE II S CORE RECOGNITION BASED THRESHOLDS .
Method \ Threshold CFB RES BIC
S1 43% 63% 49%
S2 54% 64% 55%
S3 63% 58% 64%
VI. C ONCLUSION Techniques based on BIC algorithm, residual LP filter and trace of covariance matrix of CBF were investigated for music and song segmentation. They assumed no prior information and all used a threshold to make a decision. Comparatively to GMM models and LBG using several prototypes, the results seem to be good and promising. R EFERENCES [1] H. Fujihara, T. Kitahara, M. Goto, K. Komatani, T. Ogata, and H. G. Okuno, “Singer identification based on accompaniment sound reduction and reliable frame selection,” in In Proc. of the 6th International Conference on Music Information Retrieval (ISMIR 2005), 2005, pp. 329–336. [2] H. Ezzaidi and M. Bahoura, “Voice singer detection in polyphonic music,” in Electronics, Circuits, and Systems, 2009. ICECS 2009. 16th IEEE International Conference on, dec. 2009, pp. 884–887. [3] A. Mesaros and J. Astola, “The mel-frequency cepstral coefficients in the context of singer identification,” in In Proc. of the 6th International Conference on Music Information Retrieval (ISMIR 2005), 2005, pp. 610–613. [4] A. Mesaros, T. Virtanen, and A. Klapuri, “Singer identification in polyphonic music using vocal separation and pattern recognition methods,” in In Proc. 8th International Conference on Music Information Retrieval (ISMIR 2007), 2007, pp. 375–378. [5] W. H. Tsai and H. M. Wang, “Automatic singer recognition of popular music recordings via estimation and modeling of solo vocal signals,” IEEE Trans. Audio, Speech, and Language Processing, vol. 14, no. 1, pp. 330–341, jan. 2006.
[6] Y. E. Kim and B. Whitman, “Singer identification in popular music recordings using voice coding features,” in In Proc. 3rd International Conference on Music Information Retrieval (ISMIR 2002), 2002, pp. 164–169. [7] P. Chang, “Pitch oriented automatic singer identification in pop music,” in Semantic Computing, 2009. ICSC ’09. IEEE International Conference on, sep. 2009, pp. 161–166. [8] T. Kako, Y. Ohishi, H. Kameoka, K. Kashino, and K. Takeda, “Automatic identification for singing style based on sung melodic contour characterized in phase plane,” in In Proc. 10th International Conference on Music Information Retrieval (ISMIR 2009), 2009, pp. 393–397. [9] T. Nakano, M. Goto, and Y. Hiraga, “An automatic singing skill evaluation method for unknown melodies using pitch interval accuracy and vibrato features,” in In Proc. INTERSPEECH 2006, vol. 4, 2006, pp. 1706–1709. [10] T. L. Nwe and H. Li, “Exploring vibrato-motivated acoustic features for singer identification,” IEEE Trans. Audio, Speech, and Language Processing, vol. 15, no. 2, pp. 519–530, feb. 2007. [11] L. Regnier and G. Peeters, “Singing voice detection in music tracks using direct voice vibrato detection,” in In Proc. ICASSP 2009, apr. 2009, pp. 1685–1688. [12] F. Vallet and M. F. McKinney, “Perceptual constraints for automatic vocal detection in music recordings,” in In Proc. Conference on Interdisciplinary Musicology (CIM 2007), 2007. [13] H. Gish and M. Schmidt, “Text-independent speaker identification,” IEEE Signal Processing Magazine, vol. 11, no. 4, pp. 18–32, oct. 1994. [14] D. Reynolds and R. Rose, “Robust test-independent speaker identification using gaussian mixture speaker models,” IEEE Trans. Speech Audio Processing, vol. 3, pp. 72–83, 1995.