these neurons are little affected by the distance of a face (Perrett et al. ...... Rolls ET, Baylis GC, Leonard CM (1985) Role of low and high spatial frequencies in ...
Experimental BrainResearch
Exp Brain Res (1986) 65:38-48
9
Springer-Verlag 1986
Size and contrast have only small effects on the responses to faces of neurons in the cortex of the superior temporal sulcus of the monkey E . T . Rolls and G . C . Baylis University of Oxford, Department of Experimental Psychology,South Parks Road, Oxford OX1 3UD, U.K.
Summary. There is a population of neurons in the cortex in the middle and anterior part of the superior temporal sulcus (STS) of the m o n k e y with responses which are selective for faces. To investigate whether the responses of these neurons show some of the perceptual properties of face recognition such as tolerance to changes in the size and contrast of the face, the effects of alteration of the size and contrast of an effective face stimulus on the responses of these neurons were analysed quantitatively in macaque monkeys. First, it was shown that the majority of these neurons had responses which were relatively invariant with respect to the size of the stimulus. The median size change tolerated with a response of greater than half the maximal response was 12 times. Second, it was found that for a few of these neurons, the size of the face did affect the neuronal response. For most of these neurons, it was found that when the size of the image and its distance were altered, the neuronal response was related to the retinal angle subtended by the image. But for four neurons the absolute size of the image determined the magnitude of the neuronal response, independently of the distance of the image. Thus these four neurons showed size constancy. It is suggested that these neurons would be useful as part of a face recognition system, because only objects in a certain absolute size range should normally be classified as faces. Third, the responses of the neurons were relatively invariant with respect to the contrast of the face. The mean contrast at which the neurons still responded with more than half the maximal response was 0.26. Fourth, the responses of the neurons were relatively invariant with respect to the sign of the contrast of the face, that is the neurons responded to negative as well as to positive images of faces. Fifth, the neurons typically responded to a face when the information in Offprint requests to: E.T. Rolls (address see above)
it had been reduced from 3D to a 2D representation in gray on a monitor, with a response which was on average 0.5 that to a real face. These results show that the responses of these neurons have some of the invariant properties with respect to size and contrast alteration shown by face perception, and show that their processing is at a level which would be useful in face recognition. The results also show that the responses of these neurons are not simply to local contour information.
Key words: Perceptual invariance - Face - Inferior temporal cortex - Primate - Visual recognition Temporal lobe cortex - Constancy
Introduction The perception and recognition of faces is relatively resistant to changes in the size or contrast of the face. The recognition of an object independently of its size is an important problem in pattern recognition, and it is thus of interest to investigate how this is achieved by the brain. It is known that there are neurons in the temporal lobe visual cortex of the monkey which respond selectively to faces (Gross et al. 1972; Rolls 1981a, b; Bruce et al. 1981; Perrett et al. 1982; Desimone et al. 1984; Rolls 1984; Baylis et al. 1985, 1986). The responses of these neurons to faces (real or projected, human or rhesus monkey) were selective in that they were 2-10 times as large to faces as to gratings, simple geometrical stimuli or complex 3-D objects. These neurons have different responses to different faces, so that across an ensemble of such neurons information useful in recognising a particular face is present (Baylis et al. 1985; Rolls 1984, 1986). Given that the responses of these neurons thus have some properties of a system which could
39 provide information useful f o r the recognition of a particular face, one aim of the experiments described here was to obtain quantitative information on how the responses of these neurons are related to the size of a face. In addition to the interest of comparing the responses of these cells to the relative invariance of perceptual recognition with change in image size, this experiment was also of interest in that neurons at earlier stages of the visual system, in for example the striate cortex, are relatively finely tuned to size, with a tolerance at half-maximal response of only approximately 1.5 octaves (Kulikowski and Bishop 1981; DeValois et al. 1982). If the neurons in the temporal lobe visual cortex are relatively less affected by size change, this would suggest not only that they are more closely related to recognition of a stimulus, but also one way in which their information processing is specialized relative to that in the striate cortex. Indeed, the provision of size invariance implies processing quite different from that of neurons in the striate cortex, and this would require considerable computation. In addition to altering the absolute size of the image, its distance was also altered in the present study, to provide evidence on whether the cells generalised equally effectively and equivalently over changes in absolute size and in distance. There are preliminary indications that the responses of these neurons are little affected by the distance of a face (Perrett et al. 1982), but in the present study the effects of parametric alterations of size and distance on the responses of a population of these cells were investigated. A second aim was to obtain quantitative evidence on how the responses of these neurons depend on the contrast of a face, again in order to determine how closely the properties of neurons at this stage of visual information processing might be related to the relative invariance of perceptual recognition when contrast is changed. Contrast was changed in two ways in this study. First, the responses of single neurons to a digitized image of a face in which the contrast could be quantitatively manipulated was measured. Second, the contrast of an optimal face stimulus was reversed digitally, so that a negative was shown. It is known with human face perception that recognition of a face is somewhat impaired if the face is shown as a negative, but that performance with negatives is still well above chance (Galper 1970; Davies et al. 1981). Not only was it of interest to compare the neuronal responses in this region of cortex with the degree of invariance with contrast reversal of face recognition by humans, but also it was of interest to determine whether reversal of the local contour information in a negative diminished the response of the neuron. Change in the sign of the
local contour information would be expected to affect the response of a simple cell in the striate cortex, but might not of a neuron involved at a higher level of perceptual analysis. The perception and recognition of faces is also relatively resistant to another type of information reduction in a face, produced by representing a real, three-dimensional, face as a two-dimensional image. To investigate quantitatively the extent to which the responses of these neurons might still respond to faces transformed in this way, the responses of the neurons were compared to the real face, and to a photograph or a digitized image presented on a video monitor of the same face. This investigation is of interest not only in relation to the relative invariance of perception with such a transformed representation of a face, but also because in many of the parametric investigations of the effects of factors such as contrast, size and spatial frequency on the responses of these neurons, it is convenient to work with 2D images of faces presented on a video monitor. In order to provide a completely standardized method of presenting the set of images repeatedly in a random sequence, and to allow in addition quantitative manipulations of the images such as size a n d contrast changes, the faces, together with a large range of non-face images, were digitized, stored on a computer disk, and loaded in random sequence into a video framestore ready for presentation on a video monitor on each trial. This method of stimulus presentation also allowed the responses of the neurons to be measured to sine wave gratings and to boundary curvature descriptors (Schwartz et al. 1983), in order to provide evidence on whether these neurons could be activated by such stimuli varied systematically over a wide range of parameters. Methods
Recording techniques The activity of single neurons was recorded with glass-insulated tungsten microelectrodes (after Merrill and Ainsworth 1972, but without the platinum plating) in two alert macaque monkeys (one Macaca mulatta, weight 3.2 kg, and one Macaca fascicularis, weight 3.8 kg) seated in a primate chair using techniques that have been describedpreviously(Rolls et al. 1976). The action potentials of single cells were amplified using techniques described previously (Rolls et al. 1979), were converted into digital pulses using the trigger circuit of an oscilloscope, and were analysed on-line using a PDP11 computer. The computer collected peristimulus rastergrams of neuronal activity for each trial and displayed, printed and stored each trial, as well as computingthe peristimulus time histogram by summing trials of a given type. To facilitate latency measurements, the cumulative sum distribution was calculated from the sum peristimnius time histogram. For each trial the number of action potentials occurring in a 500 ms period (and a 250 ms period) starting 100 ms after the stimulus onset was
40 printed. This period was chosen because the neurons studied responded to visual stimuli with latencies which were typically 100 ms or more, and the monkeys consistently fixated the stimuli for this period. Fixation of the stimuli was confirmed using permanently implanted silver/silver chloride electrodes for electrooculogram recording. The E O G recordings provided eye position with an accuracy of 1-3 degrees using frequent baseline checks, and were sampled by the computer every 10 ms and saved with the action potentials for each trial. X-radiographs were used to locate the position of the microelectrode on each recording track relative to permanently implanted reference electrodes and bony landmarks such as the posterior tip of the spheuoid bone (Aggleton and Passingham 1981). The position of cells was reconstructed from the X-ray coordinates taken together with serial 50 ~t histological sections which showed the reference electrodes and micro-lesions made at the end of some of the microelectrode tracks.
Stimulus presentation The visual stimuli were presented in one of two ways. First, stimuli were digitized, stored on computer disk, and displayed on a video monitor using a video framestore. The resolution of these images was 256 pixels wide by 256 pixels high with 256 gray levels. The computer randomized the order of presentation of these stimuli, switched the stimuli on and off for each trial, and synchronized its data collection so that the stimulus was turned on at the start of the 21st bin of the 100-bin peristimuhis time histogram. This method allowed completely standardized and randomized presentation of quantitatively specified stimuli as diverse as sine wave gratings and faces, and allowed image processing techniques such as alteration of contrast and size to be applied to the stimuli presented. Second, stimuli could be presented by the opening of a fast rise time (less than 15 ms), large aperture shutter (Compur Electronic 5FM, 6.4 cm aperture) which opened for 1.0 s after a 0.5 s signal tone (400 Hz) provided to allow the monkey to fixate before the shutter opened. The stimuli were presented against a uniform background (a large white screen). This method allowed the presentation of three-dimensional stimuli such as real faces and 3-D objects which differed along a wide range of parameters such as size, shape, and color, and also allowed 2-D stimuli such as photographs of a wide range of faces to be presented. The monkeys performed a visual discrimination task during the testing to ensure that they looked at the stimuli. If a circle, the positive discriminative stimulus (S+), appeared the monkeys could lick to obtain a fruit juice reward, and if a square of the same area and luminance, the negative discriminative stimulus (S-), appeared the monkey had to withold licking in order to avoid aversive hypertonic saline. A 0.5 s signal tone (400 Hz) preceded the presentation of the stimulus, and if the monkey was fixating correctly before the stimulus appeared, he had sufficient time to perform the discrimination and obtain multiple licks of the fnfit juice tube in the short (1.0 s) period in which the stimulus was on. This procedure was designed to ensure fixation of the stimuli (Rolls et al. 1979). If any other stimulus appeared (such as a grating, a 3-D object, or a face), then if the monkey licked he obtained fruit juice (i.e. all stimuli except the square were treated as S+). The order of presentation of the stimuli was randomized. The EOG recordings confirmed that this procedure resulted in consistent fixation of the stimuli. When digitized visual stimuli were being presented on the video monitor, one set of 5-20 visual stimuli were used at a time. Each set of stimuli was designed to provide neuronal response data relevant to one or several hypotheses. For example, one set included a set of images at different contrasts of the same face, to determine how the response of the neuron depended on the
contrast of the stimuli. The computer randomized the sequence in which the members of the set were presented, and after it had presented the sequence once, it restarted the set with another random sequence. The computer was allowed to repeat the set 4-10 times in order to provide sufficient data for an analysis of variance in order to determine whether the neuron responded differently to the different stimuli within the set. After data had been collected on one set, the experimenter then started a different set. Within each set, S- trials appeared with a probability which was usually specified as 0.25, but could be reduced.
Visual stimuli Non-face stimuli. The responses of the cells were tested to a wide range of non-face stimuli, including sine wave gratings, boundary curvature descriptors, and complex three-dimensional objects in order to assess whether the neuron responded primarily to faces, as described previously (Baylis et al. 1985). To be classified as a face-selective neuron in this study, the neuron had to respond to the optimal face stimulus with a change of firing rate which was at least twice that to any non-face stimulus tested, and this difference had to be significant at the 0.05 level. In fact, the majority of the neurons in the cortex in the superior temporal sulcus classified as showing responses selective for faces responded much more specifically than this. For half these neurons, their response to the most effective face was more than five times as large as to the most effective non-face stimulus, and for 25% of these neurons, the ratio was greater than 10 : 1. These criteria, and the extent to which these neurons are considered to respond preferentially to faces, have been considered elsewhere (Baylis et al. 1985). The population of neurons studied here included many of those whose other properties have been previously described (Baylis et al. 1985; Rolls et al. 1985). All the neurons studied here met these criteria.
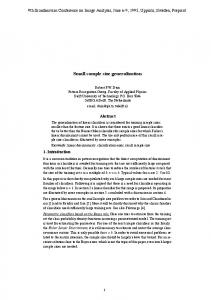
Face stimuli. Photographs were prepared of macaque monkey faces (looking directly at the camera), and of human faces. The photographic negatives were digitized using a Scandig 3 (JoyceLoebl, Gateshead, England) scanning digitizer, and stored in an image file with a resolution of 256 x 256 x 8 bits, ready for presentation on the Matrox (Quebec, Canada) QRGB 256 framestore. The monitor was a Microvitec, and the gray scale output of the system was adjusted to within 5% of linearity (2% over the middle 85% of the range) using a photometer. The maximum luminance was 8 foot-Lamberts, and the minimum 0.16 footLamberts. The mean luminance of every image used was 4 footLamberts. Images of the same face at different contrast levels were prepared using the digital image processing package Semper (Saxton and Koch, 1982) running on a P D P l l . The contrast levels available were 1, 0.56, 0.28, 0.14, 0 (a blank), and for some images 0.07. The actual contrast level achieved by the nominal 1 image was 0.95, where contrast = (Lmax-Lmin)/(Lmax+Lmin), and refers to the contrast achieved between the maximal pixel value in the image (Lmax = 255), and the minimum value (Lmin = 0). The standard deviation of the pixel values of the faces used in this study was typically 60 (in an image in the range 0-255, with a mean value of 128), resulting in a coefficient of variation (standard deviation/mean x 100%) of 46.8. (For comparison, the standard deviation of the pixel range for a sine wave grating was 90. This stimulus has pixel values which are concentrated towards the extrema of the 0-255 range of possible pixel values, so that the "standard deviation" was larger than for faces.) The effects of alterations of contrast were usually measured using the face image to which the neuron responsed best. Examples of the images used are shown in Fig. 1.
41
Fig. la, b. Examples of the stimuli used. a Faces of different sizes; b Faces of reduced and reversed contrast
Sets of images of different sizes were also prepared using digital image processing. The sizes available for most faces on the system were I (full size), 0.5, 0.25, and 0.125. These values refer to the linear not areal size change. In addition, an image with the central part expanded 2 times, referred to as size 2, was also prepared. Examples of these images are shown in Fig. 1. The effects of size and distance were further investigated by placing the monitor at different distances from the monkey, and then running size series. The standard viewing distance was 1 m, at which the screen subtended 12 degrees of visual angle at the retina, and the other viewing distances were 0.5, 2 and 4 m. In some further cases, real faces or photographs of faces were shown at different distances from the monkey. To investigate quantitatively the extent to which the responses of these neurons might still respond to faces transformed from the real 3D form to 2D images, the responses of the neurons were compared to a real face, and to a photograph or a digitized image presented on a video monitor of the same face. The real face or photograph were shown using the shutter method of presentation. The video image of a face was one of those from the standard set (Baylis et al. 1985) digitized and presented with a resolution of 256 by 256 with 256 gray levels. It should be noted that one aspect of this transformation from a real to a representation of a face included the removal of color information.
Treatment of results. For each cell measures of responses were calculated from the total number of action potentials occurring on each trial in the period 100-600 ms following stimulus onset. This period was chosen because the cells studied typically responded to visual stimuli with latencies just greater than 100 ms. The response of the cell plotted in the Figures was this value of the firing rate obtained over a 0.5 s period with the spontaneous firing rate subtracted, and expressed in spikes/s. Recordings of fixation usually confirmed that the monkeys fixated during this period of firing rate measurement, but trials with poor fixation were rejected from the analysis. Analyses of variance were then performed on the responses of each cell to the different stimuli. If a significant difference between the responses to the different stimuli was indicated, then subsequent multiple t, Tukey, and Newman-Keuls' analyses (see Bruning and Kintz 1977) were performed to determine how the different stimuli differed in their efficacy. One analysis of variance was performed over the responses to a wide range of non-face and
face stimuli, to determine whether a neuron responded differently to the face as compared to the non-face stimuli. Other analyses of variance were performed to analyse the differences of response to stimuli within one group, such as different contrasts or sizes of a face. In the figures, the mean firing rate and its standard error to each stimulus based on typically 4-10 presentations of the stimulus are shown.
Results T h e r e s p o n s e s o f 900 n e u r o n s in t h e c o r t e x in t h e s u p e r i o r t e m p o r a l sulcus, a n d in s u r r o u n d i n g a r e a s , w e r e e x a m i n e d . O f t h e s e , 92 ( 1 0 % ) w e r e f o u n d to h a v e r e s p o n s e s s e l e c t i v e f o r f a c e s , as d e f i n e d b y t h e criteria described above. Some of the response properties of these neurons have been described e l s e w h e r e ( B a y l i s e t al. 1985; R o l l s e t al. 1985). T h e effects of alterations of contrast were investigated for 34 o f t h e s e n e u r o n s , o f size f o r 42 o f t h e s e n e u r o n s , a n d o f r e a l vs 2 D i m a g e s f o r 27 o f t h e s e n e u r o n s .
Contrast An example of the effect of alterations of contrast on t h e r e s p o n s e s o f a n e u r o n d i s p l a y e d in r a s t e r g r a m f o r m a r e s h o w n in Fig. 2. T h e r e s p o n s e s o f t w o r e p r e s e n t a t i v e cells as a f u n c t i o n o f c o n t r a s t a r e p l o t t e d in Fig. 3. F o r c e l l G G 0 4 5 9 , t h e e f f e c t s o f c o n t r a s t o n t h e r e s p o n s e s to t w o d i f f e r e n t f a c e s a r e shown. The means and standard errors of the change o f firing r a t e f r o m t h e s p o n t a n e o u s r a t e o v e r 4 - 1 0 presentations of the stimuli are plotted. For these cells, it is c l e a r t h a t t h e n e u r o n s t o l e r a t e d a w i d e c h a n g e o f c o n t r a s t w i t h little a l t e r a t i o n o f n e u r o n a l r e s p o n s e . F o r e x a m p l e , t h e n e u r o n a l r e s p o n s e o f cell
42 lO~1
C=1 i
,i
,i
,,
,,t,,
,,,
i*,,,,,
,
,,~,
,t,
,,i
~,,,,,,,
.
,,,
,
, , , 1 , 1 , , ,
,~,~
,
,,
,
,,,,
,,,,,
,,
so-[
C=0.25
oj ,
t
'
lie
'
'
'
,
'
,,,11
'
'
,
,
,..
u
,
,,,
t
,,,
,,,
,t,,,,~lN,,~,,,t,,,
,,
,
,
t
,
, . ,
,
,
,
,
~. 507
c=O 1,
,
,,I
,
,
,
I
,,
I
,
,
,,
,
,,
,
I
100~
C='1 , ,,
,
&o
,
,
t
,
,
,
;
,,,,
, ,,,,,,,,
,,,t,,
,,
,,,
,,,
~;o Perisfimulus
,,,,
,,,
,,,t,,
,,
,
,,
i,
,,,
&
t,t
,,
, ,,
,,
,
, ,,
6;~
, i,
, *
,,,,
,
t,
,
,
,,,
Fig. 2. Rastergrams showing the effects of alterations of the contrast (c) of a face stimulus on the responses of a n e u r o n recorded in the cortex in the superior temporal sulcus, c = - 1 indicates the negative, c = 0 indicates a blank control stimulus with the same luminance as the other stimuli. Each action potential is represented by a single vertical line, and the histogram shows the firing rate in each of the 10 ms bins
,~o
Time (ms}
Z1614 only started to diminish when the contrast had been reduced to 0.125, and the contrast at which the response of the neuron was half that to the face with normal contrast was 0.07, by interpolation (see Fig. 3, indicated by vertical dotted line). To show how contrast affected all the cells recorded, the contrast at which the response of each cell became half that to a face of normal contrast is plotted in Fig. 4a. It is clear that most of these cells tolerated a large change in contrast, and that many of them still responded well to faces when the contrast of the image was reduced by 10 times. Another way in which the effect of contrast on the population of cells was analysed was by normalizing the responses at different contrasts relative to a maximum of 1.0, and then obtaining the mean across the population. This is shown in Fig. 4b. It appears that the mean for the population decreases linearly as a function of the log of the contrast. Contrast reversal
The effects of contrast reversal for the 42 neurons tested are shown in Fig. 5. For each neuron, its
response to the normal (positive) image of an effective face stimulus is indicated along the abscissa, and its response to a negative of the same face along the ordinate. It is clear that most of the neurons responded well to the negative of the face. The slope of the regression line (dashed in Fig. 5) is 0.9, so that as a population, the neurons responded almost as well to the negative as to the positive image of a face. This was despite the fact that local edge of contour information was reversed in the negative image. Thus the responses of the neurons were little affected by the sign of local edge information. Size
An example of the effect of alterations of size (in which local contour information would again be altered) on the responses of a neuron displayed in rastergram form are shown in Fig. 6. Four types of effect of alteration of size are illustrated by the responses of the four cells plotted in Fig. 7. The means and standard errors of the change of firing rate from the spontaneous rate over 4-10 presentations of the stimuli are plotted. First, 6 cells (e.g. Fig. 7a)
43 10050Cell no. Z161~
ca.
"3
25-
/
8
/
/
/
//
/"
z o
Level
/ 9 ii ol
9
/ 9
9 (/-
50-
9/4
~
/
/
50-
Contrast
/
.
9
9
/0
0o0459
// 0"
9
~00
o
2sI
I
50
100
Response to Positive Image (spikes/s)
o
0.2
0.4
0.6
Confras~
0.8
1.0
Level
Fig. 3a, b. The effects of alterations of the contrast of a face stimulus on the responses of 2 neurons (Z1614 and GG0459). For neuron GG0459, the separate curves show the contrast-response function for different face stimuli. The means and the s.e.m.s are shown
Fig. 5. The effects of contrast reversal on the responses of neurons to a face stimulus. Each point represents the responses of a single neuron, and shows how much it responded to the positive and to the negative image of a face. The slope of the regression line (dashed) is 0.9
1.5o o .
L
t
.
L
9
~
L
i
i
,
,
i
L,,
,
l
.
,,
,,, ,,
o
, 0
, 0.1
,
i
I
0.2
013
O~
Contrast
.
,
i
Ores >0.5
ThreshoLd
b 1.0-
6 ~ O.B-
o
,, ,,,,,,,,'::',,',, ',',,",:, ,,......
o o~o.6oo E
t,
,
H,
,
I
,,,
,
,
,
,t
, l . ,
E
"~ 0.~_
z 0
0.2-
1
24 ~,
,
,,
,
,
~
,,JLz
,,,,,,,E
,
,~,,,tE
~
. , i t ,
0.11 i
0
/I,
i
l
0.06
0.13
i
m
I
0.25
0.50
tOO
[onfrasf
Fig. 4. a The contrast at which each cell had its response decreased by 10% relative to the response to the full contrast face is shown. b The normalised response of the population of 38 neurons analysed as a function of the contrast of the stimulus (+ sem)
-2~o
2Go Perisfirnulus
4~o ,Time
6~o
,~o
(ms}
Fig. 6. Rastergrams and peristimulus time histograms showing the effects of alterations of the size of a face on the responses of a neuron recorded in the cortex in the superior temporal sulcus. The angle subtended by the face at the retina is shown
44
Z16~6
Ce[[ no
lS0q~ , Ceil no Z1~92
lO0-
_
.z:
~
,J o~75
50-
o_
g
+
O[TS 1~5
" 3
Refine(
BI.ank
12
;
2'L
41B
~8
Size (o)
Btank
Refinat
Size
{~
Fig. 7a-d. Four types of responses
Ce[[ no GI50270
Ceil no ZlL&O 30m B0-
/+O-
g
lS-i
g
oJ
§ §
o~s
I
15
I
3 Refine(
Btcmk
I
i
6
12
0J 21/*
i
/~18
0.75 Btenk
Size (~
Retina[
~
1~ 2'4 & i
Size (~
Table 1. The numbers of cells which responded best to face images of different sizes are shown
T~
z
i
~.s ~
shown by single neurons when the size of the face stimulus was altered. a Little change in response, b Some reduction in the response at each end of a wide range of relative size invariance, c A decrease of the neuronal response when the size of the image was increased, d An increase in the neuronal response when the size of the image was increased. Triangles - distance of screen = 1 m; Squares - distance of screen = 0.5 m; Circles - distance of screen = 2 m
0
I 1.0
2.0
3,0
/+.0
5.0
610
SIZE TOLERANCE (powersof 2)
Fig. 8. The range of size variation within which the responses of each cell remained more than half the maximal response of the cell
s h o w e d a l m o s t no effect o f t h e c h a n g e o f size in t h e n e u r o n a l r e s p o n s e e v o k e d b y a face. S e c o n d , m a n y cells (13) t o l e r a t e d a w i d e r a n g e in r e t i n a l i m a g e size, b u t n e v e r t h e l e s s s t a r t e d to r e s p o n d less if t h e face b e c a m e v e r y s m a l l o r v e r y l a r g e (e.g. Fig. 7b). T h i r d , s o m e cells s h o w e d a g r a d u a l i n c r e a s e o f r e s p o n s e as t h e size o f t h e face was i n c r e a s e d (11 cells, e.g. Fig. 7d), a n d 3 cells s h o w e d t h e m a x i m a l r e s p o n s e to t h e s m a l l e s t face in t h e set, w i t h a r e s p o n s e w h i c h d e c r e a s e d as t h e f a c e b e c a m e l a r g e r (e.g. Fig. 7c). T h e d e g r e e to w h i c h this p o p u l a t i o n o f n e u r o n s t o l e r a t e d c h a n g e s in r e t i n a l i m a g e size was m e a s u r e d b y d e t e r m i n i n g f r o m g r a p h s o f t h e t y p e s h o w n in
Image size
Angle (degrees) "
No. of cells
2.00 1.00 0.5 0.25 0.125
24 12 6 3 1.5
6 5 3 5 3
Fig. 7 t h e a m o u n t o f t h e c u r v e w h i c h lay a b o v e t h e half m a x i m a l r e s p o n s e . This was t h u s an e s t i m a t e o f t h e n u m b e r of d o u b l i n g s (in o c t a v e s ) of size o v e r which t h e n e u r o n g a v e this d e g r e e o f r e s p o n s e . This size t o l e r a n c e i n d e x for t h e p o p u l a t i o n o f n e u r o n s is s h o w n in Fig. 8. It is c l e a r t h a t m o s t o f t h e n e u r o n s t o l e r a t e d m a n y d o u b l i n g s o f size, w i t h 95 % t o l e r a t i n g m o r e t h a n two d o u b l i n g s (i.e. a c h a n g e o f size o f f o u r times). T h e m e d i a n v a l u e for t h e p o p u l a t i o n was a 12 fold size c h a n g e . It was p o s s i b l e f r o m t h e s e m e a s u r e m e n t s to d e t e r m i n e t h e size o f t h e f a c e s u b t e n d e d at t h e r e t i n a w h i c h gave t h e m a x i m a l r e s p o n s e f r o m a n e u r o n . T h e
45
a
40-
70
,+ i/
/
60
/
4r /
20-
_~
I
I
i
i
i
I
i
l
l
50
/ //
I
/
>"
b
:=
5O-
/ /
30
o
'2§
+
eL 25-
o=
i
i
i
i
i
i
i
I
I
i
I'0
2'o
3'0
Response to video imagg of human face
~b
i0
6'0
(spikes/s)
Fig. 10. The magnitude of the response of each neuron to a real and to a two-dimensional video image of a face is shown. Each point represents the mean (+ sem) of the responses of a single neuron to the same face viewed in these different ways
C
I'~ 2oi
Distance 0
d
+
i
i
i
50-
9--25-
O-
+ 055 & Blank
~ Refinal
; Size
1'2 2'~ ~'8 {*)
ols
4.'0 Disfance
2!o (rn)
Fig. 9a-d. The effects of alteration of the distance at which a face was viewed on the responses of four neurons to face images of different absolute sizes on the screen. Left: Neuronal response as a function of retinal size. Circle - 2 m; triangle - 1 m; square - 0.5 m distance of screen from viewer. Right: Neuronal response as a function of distance for different image sizes. Inverted open triangle-reduced in size to 1/8; filledtriangle-1/4; open circle-1/2; filled circle - full size of screen; open triangle - twice normal size
values for t h e p o p u l a t i o n o f n e u r o n s a r e s h o w n in T a b l e 1, a n d it is c l e a r t h a t t h e r e w e r e d i f f e r e n t n e u r o n s w h i c h r e s p o n d e d m a x i m a l l y to e a c h o f t h e w i d e r a n g e o f i m a g e sizes t e s t e d .
F o r 22 cells, it was p o s s i b l e to m e a s u r e t h e effect of viewing d i s t a n c e o n t h e r e s p o n s e s o f t h e n e u r o n to a face. I n a l m o s t all cases, d i s t a n c e h a d as little effect on t h e m a g n i t u d e o f t h e n e u r o n a l r e s p o n s e s as t h e size of t h e i m a g e o n t h e v i d e o m o n i t o r . T h u s t h e s e n e u r o n s s h o w e d c o n s i d e r a b l e i n v a r i a n c e in t h e i r r e s p o n s e w h e n d i s t a n c e was a l t e r e d . W h e n d i s t a n c e did start to affect t h e n e u r o n a l r e s p o n s e , for t h e m a j o r i t y of n e u r o n s t h e r e was a s i m p l e l i n e a r t r a d e o f f b e t w e e n t h e size o f t h e i m a g e o n t h e m o n i t o r a n d t h e d i s t a n c e o f t h e m o n i t o r . T h u s for t h e m a j o r i t y (18/22) o f t h e s e n e u r o n s , w h e n size o r distance d i d affect t h e m a g n i t u d e o f t h e n e u r o n a l r e s p o n s e , t h e effect was a c c o u n t e d for b y t h e c h a n g e of r e t i n a l a n g l e s u b t e n d e d b y t h e i m a g e . F o r this r e a s o n , r e t i n a l i m a g e size is p l o t t e d in Fig. 7. H o w e v e r , for s e v e r a l n e u r o n s r e t i n a l i m a g e size did n o t a c c o u n t for t h e r e s p o n s e s . T h e effects of altering t h e v i e w i n g d i s t a n c e o n t h e m a g n i t u d e o f t h e r e s p o n s e s o f o n e such n e u r o n to d i f f e r e n t sized o f i m a g e o n t h e m o n i t o r is s h o w n in Fig. 9a. It is clear that t h e r e s p o n s e o f t h e n e u r o n was i n d e p e n d e n t o f t h e viewing distance. I n s t e a d , t h e firing r a t e was a simple f u n c t i o n o f t h e a b s o l u t e size o f t h e i m a g e o n t h e screen. T h u s this n e u r o n s h o w e d q u i t e r e m a r k -
46 able size constancy. Three other neurons showed the same effect (Fig. 9b-d).
Two-dimensional images of faces It was possible to compare the responses of 27 neurons to a real face and to a digitized image of the same face presented two-dimensionally on the video monitor. The magnitude of the responses of each of these neurons to the real face as a function of its response to the video image of the same face is shown in Fig. 10. It is clear that most of the neurons responded to the video image of a face in addition to responding to the real face. It is also clear that the response to the video image was a reasonable predictor of the response to a real face, in that the correlation between the responses was 0.42, df = 25, p < 0.01. It is also clear that there was usually a greater response to the real face than to the video image of the same face, in that the slope of the regression line was 2.1.
Recording sites The sites at which these neurons were recorded are shown in a previous publication (Baylis et al. 1985). The majority of the neurons with face-selective responses were in the cortex in the anterior dorsal part of the superior temporal sulcus in area TPO and on the ventral lip of the sulcus in areas TEm and TEa as defined cytoarchitectonically and myeloarchitectonically (Baylis et al. 1986; Seltzer and Pandya 1978).
Discussion
The considerable invariance of the responses of these neurons with change of contrast is consistent with the observation that face recognition can proceed relatively unimpaired despite large changes in the contrast of the face. This suggests that the responses of these neurons are relatively close to a neural mechanism useful in face recognition. We suggest that it would be of interest to obtain quantitative information on exactly how reduction of contrast of the image affects face recognition in the human to allow a direct comparison with the responses of these neurons. However, we believe that the relative invariance of firing of these neurons does not represent a special property of processing at this stage, in that for example Tolhurst, Movshon and Thompson (1981) found that neurons in the striate cortex of the
cat could still in many cases respond to sine wave gratings when the contrast was 0.03 (see their Figs. 1 and 2). Furthermore these authors found that the neuronal response increased approximately linearly as a function of the log of the contrast. Thus the responses of the neurons described here varied over the same range and similarly when contrast was altered as neurons at earlier stages of the visual system. The observation that the responses of these neurons were relatively little reduced by reversal in the contrast of the face (to a negative) is consistent with the effects of contrast reversal on human perception of faces. For example in humans there is only a partial impairment in face recognition with negatives (Galper 1970). The majority of these neurons respond to faces relatively independently of the size of the face. For example these neurons responded with more than half their maximal response to stimuli which differed from each other by on average as much as 12 times in size. This relative invariance of the neuronal response is appropriate for a system involved in face recognition, which can proceed despite manyfold change in the size of a face. For the majority of these neurons, when size did start to affect the magnitude of the neuronal response, the retinal angle subtended by the image was important, in that the absolute size of the face (on the video monitor) could be compensated for by a change in the distance of the face. This size invariance of the neuronal response appears to be a property of processing at this stage of the visual system, useful for recognition of faces independently of their size, and does not appear to be a property of neuronal responses which are found in the striate cortex. This can be seen for example by the responses of striate neurons to sine wave gratings, which often have a bandwidth (at half maximal response) of 1.5 octaves (Kulikowski and Bishop 1981; DeValois et al. 1982). This implies that the magnitude of the neuronal response would be reduced to one half by a change in the size of the image of 2.83 times (215). Thus a special computation is required to produce the degree of size invariance of the neuronal responses described here. For some neurons, the size of the face did affect the magnitude of the neuronal response. For 18 such neurons, the retinal angle subtended by the face was again important. But for 4 neurons, the absolute size of the face, independently of the distance of the monitor over a fourfold range, determined the magnitude of the neuronal response. That is, the neurons showed size constancy, adjusting the magnitude of the neuronal response to produce a firing rate which accurately represented the absolute size of the image,
47
compensating for the effect of distance on the retinal angle subtended by the image. A computation to achieve this involves multiplication of the size subtended at the retina by the image by the distance of the image. Size constancy is a well known phenomenon in perception (Dember and Warm 1979). We propose that one function of it may be to aid in recognition, by acting as one descriptor of a face. Thus, if the absolute size of the image, as well as all its size-invariant perceptual properties, were included in the descriptors passed to the recognition system for the face, this would improve the accuracy of the memory, because only stimuli within a certain range of absolute sizes would tend to be classified as faces. That there may be a special mechanism for perceptual constancy in the temporal lobe visual cortex is supported by the findings that damage to the inferior temporal visual cortex in the monkey impair size constancy (Humphrey and Weiskrantz 1969; Ungerleider et al. 1977). The observations that the responses of these neurons are relatively invariant with respect to change in size of the face and reversal in its contrast provide evidence that the responses of these neurons do not depend on local contours such as edges which happen to be present in the faces. Rather, this invariance suggests that the description of the images provided by these neurons is a much more abstract, and size independent, description, which would be much more useful in face recognition, which is relatively independent of contrast and size. Consistent with the neurophysiological evidence described here, Weiskrantz and Saunders (1984) have found that monkeys with lesions of the inferotemporal cortex are impaired on size, orientation, and shadow transforms. Taken together, these findings suggest that information is represented in the temporal lobe visual cortex in a way which is relatively resistant to transforms. In both this study and our previous studies (Rolls 1981a, b; Perrett et al. 1982; Baylis et al. 1985; Rolls et al. 1985), the neurons classified as having faceselective responses were tested on a wide range of non-face stimuli. In the present study these included sine-wave gratings and series of boundary descriptors presented on a video screen, a large number of 3dimensional junk objects, and complex images digitized from the TV which were presented as novel and familiar for a particular day as part of a recognition memory experiment (Rolls et al. 1982; Baylis and Rolls 1986). To be classified as a faceselective neuron in this study, the neuron had to respond to the optimal face stimulus with a change of firing rate which was at least twice that to any nonface stimulus tested. In fact, the majority of the
neurons in the cortex in the superior temporal sulcus classified as showing responses selective for faces responded much more specifically than this. For half these neurons, their response to the most effective face was more than five times as large as to the most effective non-face stimulus, and for 25% of these neurons, the ratio was greater than 10 : 1. These ratios show that while responding preferentially to faces, these neurons do not have absolute specificity for faces. Indeed, we view them as a population which, in that they respond well to faces but generally poorly to other stimuli, and in that they can respond differently to different faces, convey information which could be useful in recognition of different faces. The experiments described in this paper provide further quantitative evidence that the responses of these neurons would be useful for face recognition, for the neurons display some of the properties of face recognition such as size and contrast invariance. Some further evidence which suggests that they perform a common computation is that they appear to be grouped together particularly in architectonic areas TPO, TEm and TEa in the cortex in the superior temporal sulcus rather than spread uniformly throughout the inferior temporal cortex (Baylis et al. 1986). Acknowledgement. This work was supported by the Medical Research Council.
References Aggleton JP, Passingham RE (1981) Stereotaxic surgery under Xray guidance in the rhesus monkey, with special reference to the amygdala. Exp Brain Res 44:271-276 Baylis GC, Rolls ET (1986) Responses of neurons in the inferior temporal visual cortex in short term and serial recognition memory tasks. Exp Brain Res (in press) Baylis GC, Rolls ET, Leonard CM (1985) Selectivity between faces in the responses of a population of neurons in the cortex in the superior temporal sulcus. Brain Res 342:91-102 Baylis GC, Rolls ET, Leonard CM (1986) Functional subdivisions of temporal lobe neoeortex. J Neurosci (in press) Bruce C, Desimone R, Gross CG (1981) Visual properties of neurons in a polysensory area in superior temporal sulcus of the macaque. J Neurophysiol 46:369-384 Bruning JL, Kintz BL (1977) Computational handbook of statistics, 2nd edn. Scott Foresman, Glenview Ill Davies G, Ellis H, Shepherd J (eds) (1981) Perceiving and remembering faces. Academic Press, London Dember WN, Warm JS (1979) Psychology of perception, 2nd edn. Holt Rinehart and Winston, New York Desimone R, Albright TD, Gross CG, Bruce C (1984) Stimulusselective responses of inferior temporal neurons in the macaque. J Neurosci 4:2051-2062 DeValois RL, Albrecht DG, Thorell LG (1982) Spatial frequency selectivity of cells in macaque visual cortex. Vision Res 22: 545-559
48 Galper RE (1970) Recognition of faces in photographic negative. Psychon Sci 19:207-208 Gross CG, Rocha-Miranda CE, Bender DB (1972) Visual properties of neurons in inferotemporal cortex of the macaque. J Neurophysiol 35:96-111 Humphrey NK, Weiskrantz L (1969) Size constancy in monkeys with inferotemporal lesions. QJ Exp Psychol 21:225-238 Kulikowski JJ, Bishop PO (1981) Linear analysis of the responses of simple cells in the cat visual cortex. Exp Brain Res 44: 386--400 Merrill EG, Ainsworth A (1972) Glass-coated platinum-plated tungsten microelectrodes. Med Biol Eng 10:662-672 Perrett DI, Rolls ET, Caan W (1982) Visual neurons responsive to faces in the monkey temporal cortex. Exp Brain Res 47: 329-342 Rolls ET (1981a) Responses of amygdaloid neurons in the primate. In: Ben-Ari Y (ed) The amygdaloid complex. Elsevier, Amsterdam, pp 383-393 Rolls ET (1981b) Processing beyond the inferior temporal visual cortex related to feeding, memory, and striatal function. In: Katsuld Y, Norgren R, Sato M (eds) Brain mechanisms of sensation, Chap 16. Wiley, New York, pp 241-269 Rolls ET (1984) Neurons in the cortex of the temporal lobe and in the amygdala of the monkey with responses selective for faces. Hum Neurobiol 3:209-222 Rolls ET (1986) Information representation, processing and storage in the brain: analysis at the single neuron level. In: Changeux JP, Konishi M (eds) Neural and molecular mechanisms of learning. Springer, Berlin Rolls ET, Burton MJ, Mora F (1976) Hypothatamic neuronal responses associated with the sight of food. Brain Res 111: 53-66
Rolls ET, Sanghera MK, Roper-Hall A (1979) The latency of activation of neurones in the lateral hypothalamus and substanfia innominata during feeding in the monkey. Brain Res 164:121-135 Rolls ET, Perrett DI, Caan AW, Wilson FAW (1982) Neuronal responses related to visual recognition. Brain 105:611-646 Rolls ET, Baylis GC, Leonard CM (1985) Role of low and high spatial frequencies in the face-selective responses of neurons in the cortex in the superior temporal sulcus in the monkey. Vision Res 25:1021-1035 Saxton WO, Koch TL (1982) Interactive image processing with an off-line minicomputer: organization, performance and applications. J Microsc 127:69-83 Schwartz EL, Desimone R, Albright TD, Gross CG (1983) Shape recognition and inferior temporal neurons. Proc Natl Acad Sci 80:5776-5778 Seltzer B, Pandya DN (1978) Afferent cortical connections and architectonics of the superior temporal sulcus and surrounding cortex in the rhesus monkey. Brain Res 149:1-24 Tolhurst DJ, Movshon JA, Thompson ID (1981) The dependence of response amplitude and variance of cat visual cortical neurones on stimulus contrast. Exp Brain Res 41:414-419 Ungerleider LG, Ganz L, Pribram KH (1977) Size constancy in rhesus monkeys: effects of pulvinar, prestriate, and inferotemporal lesions. Exp Brain Res 27:251-269 Weiskrantz L, Saunders RC (1984) Impairments of visual object transforms in monkeys. Brain 107:1033-1072
Received October 23, 1985 / Accepted June 13, 1986