INSOMNIA
ERP Evidence of Enhanced Excitatory and Reduced Inhibitory Processes of Auditory Stimuli During Sleep in Patients With Primary Insomnia Chien-Ming Yang, PhD1; Hsiao-Sui Lo, MD2 Department of Psychology and The Research Center for Mind, Brain, and Learning, National Chengchi University, Taipei, Taiwan; 2Department of Neurology, Chung Shan Medical University, Taichung, Taiwan 1
Study Objectives: Increased information processing around the onset of sleep and during sleep has been suggested as an important factor for the pathogenesis of insomnia. The purpose of the present study was to examine the processing of auditory information during sleep in patients with insomnia through the recording of event-related potentials (ERPs). Design: A mixed design was used in which subject group was a betweensubject factor and sleep stage and type of tone presented were withinsubject factors. Participants: Fifteen patients with primary insomnia and 15 normal sleepers (controls) were studied. Measurements and Results: An odd-ball paradigm was conducted to evoke ERPs throughout the night. Patients with insomnia showed larger N1 and smaller P2 to rare tones, smaller N350 to standard tones, and
slower P900 to both tones during the first 5 minutes of continuous stage 2 sleep. No consistent ERP differences were detected between the 2 groups when the waveforms were averaged across the whole night. Conclusions: Patients with insomnia showed an enhancement in attention and a reduction in the inhibitory process that normally facilitates sleep onset in the beginning part of sleep. The results partially support the hyperarousal theory, ie, enhanced information processing during the initiation of sleep is a contributing factor for insomnia. Keywords: ERP, Insomnia, Information Procesing Citation: Yang CM; Lo HS. ERP Evidence of Enhanced Excitatory and Reduced Inhibitory Processes of Auditory Stimuli During Sleep in Patients With Primary Insomnia. SLEEP 2007;30(5):585-592
treatment with cognitive behavioral therapy, beta activities have been found to decrease significantly.13,14 Because high-frequency EEG has been reported to be associated with increased cognitive activities, these findings support the hypothesis that information processing during sleep is increased in patients with insomnia. Although-high frequency EEG is usually thought to be associated with higher mental activities, there are alternative explanations of these findings. Bonnet and Arand have pointed out that increased muscle tension can also contribute to highfrequency EEG.15 They have shown that high-frequency EEG power can be elevated simply by having the subjects engage in some mild physical activities, such as standing up and sitting down or walking around. Therefore, the elevated high-frequency EEG observed in insomniacs is not necessarily associated with increased cortical activities. In addition, even if the highfrequency EEG reflects increased mental activities in insomniacs, it is not necessarily associated with enhancement of processing of environmental stimuli. High-frequency EEG, in fact, could reflect heightened anxiety, rumination, or both. The present study was undertaken to further evaluate information processing during sleep in patients with insomnia with the recording of event-related potentials (ERPs). ERPs can reflect the neurophysiologic activities elicited by sensory stimulation and do not require behavioral responses or conscious awareness. It is therefore an ideal technique to study information processing during sleep. Previous studies on the ERP changes during sleep have shown an attenuation of the N1 and an enhancement of the P2 (also called P220) as a person falls asleep.16,17 Also, several ERP components have been reported to appear during non-rapid eye movement (NREM) sleep, including N350, P450, N550, and P900.18-20 The N1 has been suggested to be associated with the formation of auditory feature traces and an automatic switching of attention toward novel stimuli, whereas the P2 has been related to inhibition of sensory interferences. The attenuated N1 and enhanced P2 reflect decreased cortical excitability and
PATIENTS WITH INSOMNIA OFTEN REPORT AWARENESS OF ENVIRONMENTAL ACTIVITIES FOR AN EXTENDED PERIOD OF TIME WHILE LYING IN BED TRYING TO FALL asleep.1-3 They also tend to report that they are still awake even though polysomnographic recording indicates sound sleep status.4 Therefore, patients who complain of insomnia often overestimate their sleep-onset latency and underestimate theirtotal sleep time.5-7 Perlis and his colleagues have proposed a hyperarousal hypothesis for insomnia from a neurocognitive perspective that offers a possible explanation of the above phenomenon.8 This model hypothesizes that the difficulties in sleep initiation and/ or sleep maintenance in patients with primary insomnia may be associated with increased information processing around the onset of sleep. Accordingly, patients with insomnia may have an elevated degree of cortical or cognitive arousal that corresponds to enhanced information processing during polysomnographydefined sleep. Thus, they tend to perceive wakefulness even though the electroencephalogram (EEG) indicates sleep. This point of view is primarily supported by the demonstration that high-frequency EEG power (beta range: 14-35 Hz; gamma range: 35-45 Hz) prior to and during sleep are elevated in patients with insomnia, as compared with normal controls.9-12 Furthermore, their beta power during sleep correlates with the discrepancies between subjective and polysomnography-defined sleep.11 After Disclosure Statement This is not an industry supported study. Drs. Yang and Lo have indicated no financial conflicts of interest. Submitted for publication September, 2006 Accepted for publication January, 2007 Address correspondence to: Hsiao-Sui Lo, Chung Shan Medical University, Department of neurology, No. 110, Sec. 1, Chien-Kuo N. Road, Taichung, 402, Taiwan; E-mail:
[email protected] SLEEP, Vol. 30, No. 5, 2007
585
ERP During Sleep in Primary Insomnia—Yang and Lo
increased inhibitory processes around sleep onset.17,21 Among the NREM-specific ERP components, N350, N550, and P900 have been reported to be elevated in response to stimuli occurring less frequently or stimuli that are designated to be a target of attention prior to falling asleep.18,19,22,23 Therefore, these waveforms do not simply reflect a general reaction to sensory stimuli but are associated with at least a minimum level of discrimination in the processing of information. Also, the amplitudes of the N350 and the P900 components during sleep and the N550 during the waketo-sleep transition increase following 1 night of sleep deprivation or disrupted sleep.24,25 Given that sleep deprivation and sleep disruption enhance sleep drive and therefore increase the threshold for arousal during subsequent sleep, it is more likely that these waveforms reflect an inhibitory process that prevents or minimizes cognitive processing, cortical activation, or both processing and activation following the detection of a sensory event.24,25 In addition, previous studies have shown that the amplitude of N350 is larger at or near the time of sleep onset26 and is larger during light sleep relative to slow-wave sleep (SWS).27 Furthermore, there is a close correlation between the emergence of N350 and reductions in behavioral responsiveness around sleep onset,28 as well as the emergence of theta activity in stage 1 sleep.29,30 N350, therefore, has been proposed to be associated with the process of sleep initiation. P900, on the other hand, shows a tendency to increase with the deepening of sleep.31,32 P900 is more associated with the maintenance or deepening of sleep. Thus, if insomnia, as suggested by the neurocognitive hypothesis, is associated with increased information processing during sleep, one would expect to find the attention-related ERPs to be elevated during sleep and the inhibition-related ERPs to be reduced in patients with insomnia. To the best of our knowledge, there is only 1 published study that has examined the NREM ERPs in patients with insomnia. Hull showed that N350 is smaller in insomniacs than in normal controls during the initial part of stage 2 sleep.33 The results support the premise underlying the neurocognitive hypothesis. However, the subjects with insomnia in Hull’s study were not clinical patients but were undergraduate students. Furthermore, the recording of ERPs was conducted only until 10 minutes into stage 2 sleep. Therefore, information processing throughout the night in clinical patients with insomnia remains a question of interest. The present study aimed to further explore this issue by recording NREM ERPs in clinical patients with insomnia and normal sleepers for a full night. It was hypothesized that, if there is increased information processing, and thus a reduction in inhibition processing during sleep in patients with insomnia, arousal-related ERPs (such as N1) would be elevated and inhibition-related ERPs (such as P2, N350, and P900) would be reduced for patients with insomnia. Also, the ERP differences in different NREM sleep stages were examined separately to further understand information processing of insomniacs in different sleep states.
age from 20 to 60 years; (2) difficulties in sleep initiation or sleep maintenance, or both, for at least 6 months, with sleep difficulties defined as a sleep-onset latency longer than 30 minutes or a wake time after sleep onset longer than 30 minutes, occurring on average 4 or more nights per week; (3) daytime consequences were reported; (4) no history of current medical or psychiatric disorders that are associated with sleep disturbances; (5) not a habitual coffee drinker (fewer than 2 cups of caffeinated drinks per day) or habitual alcohol user (fewer than 3 standard drinks per week); (6)nonsmoker or light smoker (fewer than 10 cigarettes per day); (7)currently not using medications that may affect sleep or willingness to stop using medication for at least 2 weeks; and(8) not a shift worker, with a regular sleep-wake schedule. Inclusion criteria for normal controls were comprised of items 4 to 8 from the above list. The subjects’ insomnia was diagnosed by a neurologist or a psychiatrist, and the subjects were interviewed by a clinical psychologist certified in behavioral sleep medicine. All of the included subjects reported no use of medications or other medical conditions. One of the control subjects and 2 of the subjects with insomnia were light smokers. Two of the control subjects and 5 of the subjects with insomnia drank 1 to 2 cups of caffeinated drinks daily. None of the subjects were habitual alcohol users. Informed consent was obtained from all subjects before the beginning of the experimental procedures. Procedure Potential subjects who met the screening criteria were scheduled to sleep in the sleep laboratory for 2 nights. The subjects were instructed to refrain from alcohol intake and to limit caffeinated beverages to 1 cup per day before noon for the 3 days prior to the night in the sleep laboratory. The first night in the laboratory served as an adaptation and screening night, in order to habituate the subjects to sleep in the laboratory and to rule out possible sleep disorders. Subjects were scheduled to come to the laboratory about 1 hour before their regular bedtime. The average habitual sleep schedules were 12:01 AM to 7:27 AM and 12:18 AM to 7:26 AM for control and insomnia groups, respectively. Their average in-lab sleep schedules were 12:19 AM to 6:55 AM and 12:05 AM to 6:58 AM. The average total bedtime in the laboratory was somewhat shorter because many of the subjects requested to get up earlier than their regular schedule so that they would have sufficient time to prepare to go to work. The montage of the polysomnography recording included a EEG (C3/A2, C4/A1, O1/A2, and O2/A1), left and right electrooculograms, a submental electromyogram, an electrocardiogram, nasal/oral airflow, chest and abdominal respiratory efforts, and oxygen saturation. Subjects found to have other sleep disorders, such as sleep-related breathing disorders (respiratory disturbance index ≥ 5/hr) or a periodic limb movement disorder (periodic limb movement index ≥ 10/hr) were excluded from participation in the study. During the second night, ERP recordings were conducted. An EEG (ie, Fz/A1A2, Cz/A1A2, and Pz/A1A2), vertical and horizontal electrooculograms, and submental electromyogram were recorded throughout the night. The procedure of ERP induction was modified from the odd-ball paradigm used by Hull and Harsh.17 Auditory pure tones, either 1000 Hz or 1500 Hz for 45 milliseconds, were presented every 1.5 seconds via a plug-type earphone to both ears throughout the night. A higher-pitch tone
METHODS Subjects Subjects included 15 patients, 9 women and 6 men, with primary insomnia (mean age = 35.3 ± 12.4 years) and 15 normal sleepers, 10 women and 5 men, (mean age = 34.3 ± 12.9 years). The inclusion criteria for subjects with primary insomnia were as follows: (1) SLEEP, Vol. 30, No. 5, 2007
586
ERP During Sleep in Primary Insomnia—Yang and Lo
was designated to be a standard tone for one half of the subjects and to be a rare tone for the other one half of the subjects. The sequences of the 2 tones were randomly arranged, and the ratio of rare-to-standard tones was 20:80. Subjects were instructed to count the number of target tones while they were still awake but not to resist falling asleep. For both nights, subjects were requested to fill out an evening questionnaire before bedtime to assess any unusual events during the previous day and a morning questionnaire right after awakening to assess their general feelings about the night’s sleep.
complexity. First, data from the first 5 minutes of continuous stage 2 sleep were analyzed in order to examine the information processing after the initiation of sleep. Multivariate analysis of variance (MANOVA) was performed for comparisons of the amplitude and latency of ERP components between different subject groups (insomnia vs control) and the 2 types of tones (standard vs rare), combining data derived from Fz and Cz. Second, information processing was analyzed for the entire night. Again, MANOVA was conducted to compare ERPs between normal controls and insomniacs for rare and standard tones, combining data from Fz and Cz. Because some of the subjects did not have a sufficient number of artifact-free epochs of EEG (ie, fewer than 10 epochs) for a certain sleep stage, their data were excluded from analysis of the sleep stages. Accordingly, 2 control subjects were excluded from analysis of stage 1 sleep, and 2 control subjects and 3 insomnia subjects were excluded from analysis of SWS.
Data Analysis Sleep stages were scored in 30-second epochs following standard criteria as defined by Rechtschaffen and Kales.34 Stages 3 and 4 sleep were combined as SWS for data analysis. ERP analysis was conducted with Scan 4.3 (Compumedics USA Ltd., El Paso, TX). The recorded EEG was initially filtered with a 30Hz low-pass filter. It was then segmented with periods of 1350 milliseconds, from 150 milliseconds prior to the onset of the tones to 1200 milliseconds after the onset of the tones. Baseline corrections were then conducted with the average of the 150millisecond EEG prior to stimulus onset as the baseline. Segments containing electrooculogram signals in excess of 75 microvolt above or below the baseline were then excluded from analysis. The rest of the segments were averaged separately for target and nontarget tones during different sleep stages. N1, P2, N350, and P900 were calculated as the negative or positive peaks during the ranges of 76 to 150 milliseconds, 150 to 260 milliseconds, 250 to 475 milliseconds, and 600 to 1000 milliseconds, respectively. These windows were adjusted slightly for some subjects according to visual inspection of their average waveforms. The N550 was not analyzed in the present study because it was indiscernible in several of our conditions. The N550 has been shown to be absent or greatly reduced when trials with K-complex are excluded from averaging.35-38 Because K-complexes are not typically elicited with shorter interstimulus intervals, as in the present study,39-41 it is not surprising that the N550 was infrequently identified in our data. Because the ERP components of interest were known to have primarily central or frontal distributions in previous studies,18,19 statistics were performed for Fz and Cz only so as to avoid
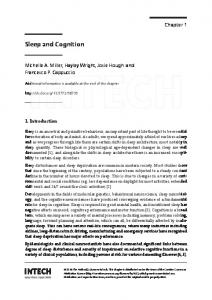
RESULTS Table 1 shows the sleep parameters obtained during the experimental night for the 2 groups. Control subjects showed higher sleep efficiency than insomnia subjects (t = 2.20, P < 0.05). All the other sleep measures showed no significant differences between the two groups. ERP Findings for the First 5 Minutes of Continuous Stage 2 SLEEP Means and SDs of ERP measures of the first 5 minutes of continuous stage 2 sleep are presented in Table 2 and Table 3. Figure 1 shows the ERPs for the first 5 minutes of continuous stage 2 sleep. MANOVA results for the N1 amplitude showed a significant type of tone-by-group interactions (Wilks λ = 0.76, F = 9.03, P < 0.01). MANOVA of simple main effects showed that N1 amplitudes induced by rare tones were significantly higher in patients with insomnia, as compared with normal control subjects (F = 4.15, P = 0.05); the N1 responses to standard tones showed no significant differences between the 2 groups (F = 1.71, NS). In terms of N1 latencies, MANOVA showed neither significant main effects nor interactions. MANOVA results for the P2 amplitudes showed significant
Table 1—Sleep Parameters of the Experimental Night Sleep Parameter Total bed time, min Total sleep time, min Sleep-onset latency, min Sleep efficiency, % WASO, % Sleep stage, % Stage 1 Stage 2 SWS REM
Group Control 391.67 ± 55.12 344.73 ± 62.27 7.27 ± 5.60 87.60 ± 5.32 10.69 ± 5.36
Insomnia 413.07 ± 42.68 331.27 ± 51.79 10.83 ± 6.30 80.50 ± 11.32 17.24 ± 11.48
4.83 ± 2.70 55.27 ± 9.89 17.40 ± 8.60 13.67 ± 3.83
6.21 ± 2.85 53.67 ± 7.93 12.87 ± 8.94 13.60 ± 4.69
t Value (df = 28)
P Value
-1.19 0.64 0.11 2.20 -2.00
0.244 0.525 0.112 0.036* 0.055
-1.36 1.31 1.31 -0.25
0.184 0.199 0.201 0.980
Data are presented as mean ± SD. WASO refers to wake after sleep onset; SWS, slow-wave sleep; REM, rapid eye movement sleep. *P < 0.05 SLEEP, Vol. 30, No. 5, 2007
587
ERP During Sleep in Primary Insomnia—Yang and Lo
Standard Tone
Rare Tone
Fz ���
���
���
���
��
��
�
�
�
�
��
��
��
��
���
���
���
���
��
��
�
�
�
�
��
��
Cz
��
N350 N1
P900 P2
��
15 ��
Insomnia Control
500 ms Figure 1—Grand averages of the event-related potentials (ERP) for the first 5 minutes of continuous stage 2 sleep recorded at Fz and Cz.
Table 2—ERP Amplitudes for the First 5 minutes of Continuous Stage 2 Sleep Type of Tone N1g1 Standard Rare P2g1,t Standard Rare N350g2,t Standard Rare P900t Standard Rare
Insomnia Group
Fz
Control Group
Insomnia Group
Cz
Control Group
1.03 ± 2.50 -1.04 ± 2.99
-0.17 ± 2.83 1.82 ± 5.24
1.00 ± 2.23 -1.10 ± 2.63
0.08 ± 2.87 1.75 ± 4.42
7.39 ± 3.36 8.26 ± 4.70
7.42 ± 4.43 13.23 ± 5.78
7.92 ± 3.51 11.73 ± 3.76
9.44 ± 5.80 15.70 ± 6.77
-7.95 ± 4.15 -15.43 ± 7.63
-13.85 ± 8.12 -14.39 ± 10.38
-9.67 ± 4.89 -17.40 ± 6.60
-15.74 ± 11.77 -17.53 ± 13.46
4.96 ± 3.09 12.15 ± 6.59
6.23 ± 4.99 11.26 ± 10.57
3.59 ± 2.40 8.65 ± 6.17
5.26 ± 3.98 8.64 ± 6.60
Data are presented as mean ± SD of event-related potentials (ERP) amplitudes (μV). g1 Significant simple main effect of group (insomnia vs control groups) for rare tones only. g2 Significant simple main effect of group (insomnia vs control groups) for standard tones only. t Significant type-of-tone main effect (standard vs rare tones).
SLEEP, Vol. 30, No. 5, 2007
588
ERP During Sleep in Primary Insomnia—Yang and Lo
Table 3—ERP Latencies for the First 5 minutes of Continuous Stage 2 Sleep Type of Tone N1 Standard Rare P2t Standard Rare N350 Standard Rare P900t,g Standard Rare
Insomnia Group
Fz
Cz
Control Group
Insomnia Group
Control Group
150.80 ± 27.96 147.20 ± 23.49
142.53 ± 26.10 148.27 ± 19.36
147.60 ± 28.09 146.80 ± 22.51
146.93 ± 31.54 150.67 ± 19.27
251.60 ± 40.39 260.80 ± 27.85
228.13 ± 47.21 258.13 ± 26.65
252.67 ± 39.92 262.27 ± 22.01
228.00 ± 46.99 260.13 ± 25.46
388.40 ± 22.93 386.53 ± 36.41
377.07 ± 26.80 371.73 ± 27.02
385.47 ± 23.96 376.13 ± 37.20
377.73 ± 31.96 369.20 ± 35.78
851.20 ± 75.23 869.07 ± 52.57
772.93 ± 85.69 809.33 ± 68.63
846.80 ± 78.11 871.20 ± 58.16
782.13 ± 78.47 816.40 ± 61.87
Data are presented as mean ± SD of event-related potentials (ERP) latencies (ms). t Significant type-of-tone main effect (standard vs. rare tones). g Significant group main effect (insomnia vs. control groups).
and group in stage 1 sleep (Wilks’ λ = 0.86, F = 4.21, P = 0.05), and significant type-of-tone main effects for all stages (stage 1: Wilks λ = 0.59, F = 18.31, P < 0.001; stage 2: Wilks λ = 0.40, F = 42.24, P < 0.001; SWS: Wilks λ = 0.41, F = 31.81, P < 0.001). No other main effects and interactions were significant for P2 amplitudes and latencies. MANOVA results for N350 showed no significant difference in patients with insomnia compared with the control group. Neither the group main effect nor the interactions of group with other factors were significant. There were significant type-oftone effects for all sleep stages. N350 amplitudes were greater in response to rare tones than to the standard tone (stage 1: Wilks λ = 0.61, F = 16.92, P < 0.001; stage 2: Wilks λ = 0.39, F = 44.49, P < 0.001; SWS: Wilks’ λ = 0.45, F = 26.56, P < 0.001). The N350 latency showed no significant main effects or interactions. The P900 amplitudes showed a significant type-of-tone main effect, with greater amplitudes in response to rare tones than to standard tones (stage 1: Wilks λ = 0.77, F = 13.23, P = 0.001; stage 2: Wilks λ = 0.29, F = 69.32, P < 0.001; SWS: Wilks λ = 0.33, F = 45.27, P < 0.001). The P900 latencies showed significant group (F = 4.14, P = 0.05) and type-of-tone main effects (Wilks λ = 0.61, F = 18.08, P < 0.001) during stage 2 sleep only.
type-of-tone main effects (Wilks λ = 0.44, F = 35.93, P < 0.001) as well as type of tone-by-group interactions (Wilks λ = 0.80, F = 6.99, P < 0.05). Further analysis showed that the P2 was smaller in patients with insomnia than in control subjects when evoked by rare tones (F = 5.86, P < 0.05) but showed no difference when evoked by standard tones (F = 0.25, NS). In terms of latency, P2 also showed a significant difference between types of tone (Wilks λ = 0.78, F = 7.75, P = 0.01) but no differences between the groups. MANOVA results for the N350 amplitude showed significant type of tone-by-group interactions (Wilks λ = 0.77, F = 8.41, P < 0.01) and type-of-tone main effects (Wilks λ = 0.64, F = 15.57, P < 0.001). Comparisons of simple main effects indicated that the amplitudes of N350 induced by standard tones were significantly lower in insomniacs, as compared with normal control subjects, (F = 4.61, P < 0.05); the N350 responses to rare tones were not different between the 2 groups (F = 0.02, NS). The latencies of the N350 showed no significant effects on MANOVAs. MANOVA results for the P900 amplitudes showed that only the type-of-tone main effects were significant (Wilks λ = 0.46, F = 32.80, P < 0.001). In terms of latencies, MANOVA results showed significant group (F = 8.01, P < 0.01) and type-of-tone (Wilks λ = 0.83, F = 5.90, P < 0.05) main effects. Peak latencies of P900 in stage 2 sleep were longer in patients with insomnia than in control subjects and were longer for rare tones than for standard tones.
DISCUSSION In the present study, ERPs were used to investigate the processing of auditory stimuli during sleep in patients with primary insomnia. The results showed that insomniacs generated abnormal ERP patterns primarily during the first 5 minutes of stable stage 2 sleep. Because the ERP changes during the initiation of sleep have been suggested to be associated with a sleepprotecting process that inhibits cognitive and/or cortical arousals from responding to sensory events during sleep,25 the findings indicate an impairment of the inhibitory mechanism during the beginning of sleep in patients with primary insomnia. The results support the neurocognitive hypothesis that patients with insomnia may have an elevated level of information processing after the onset of sleep. The attenuation of N1 and the enhancement of P2 as a person
ERP Findings for Different Sleep Stages Throughout the Night The means and SDs of the amplitudes and latencies of different ERP components are presented in Tables 4 and 5. The N1 amplitude showed no significant main effects or interactions. The N1 latency was longer for patients with insomnia than normal controls during SWS (F = 5.98, P < 0.05), nearly significantly longer during stage 1 sleep (F = 3.20, P = 0.085), but showed no difference during stage 2 sleep (F = 0.14, NS). No other main effects or interactions for N1 latency were significant. Also, N1 peaked significantly later for standard tones than for rare tones during SWS (Wilks λ = 0.68, F = 10.20, P < 0.005). P2 amplitudes showed significant interactions of type-of-tone SLEEP, Vol. 30, No. 5, 2007
589
ERP During Sleep in Primary Insomnia—Yang and Lo
Table 4—ERP Amplitudes for Different Sleep Stages Throughout the Night Type of Tone N1 Stage 1 Stage 2 SWS P2
Stage 1g2,t Stage 2t SWSt
N350 Stage 1t Stage 2t SWSt P900 Stage 1t Stage 2t SWSt
Insomnia Group
Fz
Control Group
Insomnia Group
Cz
Control Group
Standard Rare Standard Rare Standard Rare
-0.65 ± 1.71 -0.38 ± 1.65 1.65 ± 1.19 1.96 ± 1.37 4.52 ± 2.13 5.55 ± 3.96
0.07 ±.96 -0.44 ± 1.90 1.91 ± 1.10 2.03 ± 1.66 4.67 ± 2.87 3.93 ± 3.30
-0.51 ± 1.33 -0.11 ± 1.90 1.42 ± 0.98 1.63 ± 1.26 3.49 ± 1.53 4.27 ± 2.25
0.16 ± 1.06 -0.51 ± 2.28 1.78 ± 1.02 1.76 ± 1.53 4.28 ± 2.81 3.74 ± 3.65
Standard Rare Standard Rare Standard Rare
2.23 ± 1.34 4.31 ± 2.21 3.54 ± 2.04 5.26 ± 1.95 6.37 ± 2.89 8.50 ± 4.12
3.65 ± 2.48 4.62 ± 2.13 4.06 ± 2.12 5.39 ± 2.91 7.10 ± 4.12 9.43 ± 4.26
2.41 ± 1.62 4.81 ± 3.19 3.71 ± 1.94 5.77 ± 2.22 5.77 ± 2.83 8.86 ± 3.60
4.17 ± 2.87 4.99 ± 2.95 4.68 ± 2.72 6.42 ± 3.64 7.65 ± 5.04 11.01 ± 5.63
Standard Rare Standard Rare Standard Rare
-3.46 ± 1.51 -5.76 ± 2.33 -2.35 ± 1.45 -6.81 ± 3.43 -2.39 ± 2.43 -8.23 ± 5.45
-4.71 ± 2.42 -6.91 ± 3.76 -3.45 ± 2.94 -6.60 ± 3.61 -3.90 ± 2.88 -9.22 ± 4.88
-3.73 ± 1.74 -6.10 ± 2.98 -3.16 ± 1.74 -7.80 ± 3.89 -3.52 ± 2.69 -9.40 ± 5.73
-4.78 ± 2.81 -7.58 ± 4.34 -4.37 ± 3.60 -7.92 ± 4.60 -4.65 ± 3.81 -10.85 ± 6.25
Standard Rare Standard Rare Standard Rare
1.75 ± 1.14 3.86 ± 2.76 4.80 ± 3.53 9.07 ± 5.01 7.67 ± 3.86 14.41 ± 6.23
2.63 ± 1.67 4.89 ± 4.66 4.84 ± 2.32 7.83 ± 3.61 8.20 ± 4.84 15.01 ± 5.57
1.31 ± 1.24 2.83 ± 2.63 3.73 ± 2.58 7.00 ± 3.74 6.89 ± 3.63 12.48 ± 5.93
2.44 ± 1.75 4.46 ± 4.66 4.46 ± 2.19 7.14 ± 3.59 8.56 ± 5.38 15.24 ± 6.18
Data are presented as mean ± SD of event-related potentials (ERP) amplitudes (μV). SWS refers to slow-wave sleep. g2 Significant simple main effect of group (insomnia vs control groups) for standard tones only. t Significant type-of-tone main effect (standard vs rare tones).
falls asleep have been suggested to be associated with decreased cortical excitability and inhibition of attention toward external stimuli around sleep onset. Our data showed that this pattern was less obvious in patients with insomnia in responding to rare tones during the beginning part of sleep. This finding indicates a failure in reducing the orienting response and attention processing to distinct stimuli after sleep initiation in patients with insomnia. When the whole night of data were included, the only difference found was a slightly longer N1 latency in patients with insomnia. This latency delay was not consistent for all sleep stages and recording sites. There may be general abnormalities in attention toward stimuli throughout sleep in patients with insomnia but not as robust as what was found in the beginning of sleep. This finding requires further study for confirmation. In the current study, N350 was shown to be lower during the first 5 minutes of continuous stage 2 sleep but was not different from that of normal sleepers when the whole night of data were included. Previous studies have shown that N350 reaches its maximum at or near sleep onset and emerges corresponding to the reductions in behavioral responsiveness around sleep onset.18, 26 More recently, an association between the emergence of N350 and alpha-to-theta EEG transition during stage 1 sleep has also been reported.30 These results support the notion that N350 is related to the process of sleep initiation. The decreased N350 amplitude that existed during the early part of sleep found in our study may partially explain SLEEP, Vol. 30, No. 5, 2007
the pathogenesis of the prolonged sleep-onset latency in patients with insomnia. Such patients may have difficulty inhibiting the intrusions of external sensory stimuli during the process of falling asleep, which therefore leads to the perception of prolonged sleeponset latency. It is worth pointing out that the decreased N350 in subjects with insomnia was limited to standard tones but not to rare tones. This finding suggests that patients with insomnia are not more impaired with respect to the inhibition of rare stimuli, in comparison with normal sleepers. However, they demonstrated a general decrease in the inhibition to process background auditory stimuli during the initiation of sleep. This is in line with patients’ common complaints that they are aware of the activities in their surroundings while having difficulty falling asleep. P900, on the other hand, did not show amplitude differences but peaked later for patients with insomnia than for control subjects. P900 has been shown to be more a reflection of the elevation of sensory threshold along the deepening of sleep.19,31 A latency delay may indicate a slowing in the process associated with the waveform or may reflect a later onset of the process due to the abnormality in the earlier processes. Overall, our data suggest that patients with primary insomnia have an elevated level of information processing that may affect both the initiation and deepening of sleep. A recent positron emission tomography study reported that patients with insomnia showed greater global cerebral glucose metabolism during sleep 590
ERP During Sleep in Primary Insomnia—Yang and Lo
Table 5—ERP Latencies for Different Sleep Stages Throughout the Night Type of Tone N1 Stage 1 Stage 2 SWSg,t P2
Stage 1 Stage 2 SWS
N350 Stage 1 Stage 2 SWS P900 Stage 1 Stage 2g,t SWS
Insomnia Group
Fz
Control Group
Insomnia Group
Cz
Control Group
Standard Rare Standard Rare Standard Rare
158.59 ± 19.76 157.88 ± 17.51 155.76 ± 26.80 153.18 ± 18.10 178.33 ± 23.74 159.50 ± 20.54
153.54 ± 21.22 137.69 ± 27.18 163.87 ± 18.55 148.27 ± 30.61 160.77 ± 22.40 134.62 ± 36.79
154.47 ± 23.65 152.94 ± 19.69 152.59 ± 23.13 147.41 ± 18.73 177.83 ± 20.63 157.17 ± 17.47
154.46 ± 20.85 139.69 ± 26.71 162.27 ± 19.55 146.80 ± 28.14 160.77 ± 20.44 136.46 ± 32.36
Standard Rare Standard Rare Standard Rare
237.18 ± 29.11 246.00 ± 31.98 248.59 ± 31.16 256.00 ± 30.47 241.67 ± 23.88 239.33 ± 28.49
239.54 ± 24.55 230.62 ± 42.63 252.93 ± 24.13 246.53 ± 39.15 229.54 ± 23.55 240.77 ± 28.73
225.65 ± 26.91 240.82 ± 29.40 245.18 ± 30.06 253.18 ± 30.58 244.50 ± 17.35 250.17 ± 18.44
240.00 ± 24.32 232.46 ± 40.76 252.93 ± 26.56 246.27 ± 38.54 233.08 ± 23.46 242.46 ± 27.67
Standard Rare Standard Rare Standard Rare
383.53 ± 28.19 392.59 ± 35.87 410.12 ± 22.82 410.94 ± 22.22 404.50 ± 25.05 404.50 ± 37.32
369.69 ± 40.70 377.23 ± 39.87 394.13 ± 28.77 399.60 ± 29.42 393.54 ± 32.56 392.77 ± 25.34
370.82 ± 27.24 380.82 ± 30.70 402.59 ± 26.61 398.00 ± 29.86 394.83 ± 35.23 394.50 ± 37.19
370.15 ± 28.76 373.23 ± 48.09 387.33 ± 30.19 390.80 ± 28.20 385.85 ± 29.90 387.23 ± 24.52
Standard Rare Standard Rare Standard Rare
858.12 ± 70.56 862.82 ± 65.91 825.88 ± 71.59 845.76 ± 51.98 762.50 ± 53.14 784.50 ± 64.07
809.69 ± 96.86 848.15 ± 97.38 770.53 ± 45.36 803.73 ± 52.56 767.69 ± 76.79 766.92 ± 48.48
854.59 ± 67.41 861.76 ± 61.65 803.76 ± 76.36 829.76 ± 64.49 757.83 ± 53.85 769.33 ± 59.05
812.15 ± 88.70 836.00 ± 93.56 757.87 ± 46.85 792.00 ± 47.86 770.77 ± 73.90 768.00 ± 46.45
Data are presented as mean ± SD of event-related potentials (ERP) latencies (ms). SWS refers to slow-wave sleep. g Significant group main effect (insomnia vs. control groups). t Significant type-of-tone main effect (standard vs. rare tones).
and a smaller decline in relative metabolism from waking to sleep in brain areas associated with wake promotion, as compared with normal sleepers. It was concluded that insomnia was related to a failure of arousal mechanisms to decline during the transition from waking to sleep states.42 The ERP findings in the present study are consistent with the positron emission tomography results and further demonstrate both an inability to lower a general attention or arousal process and an impairment in the sleep-specific inhibitory process during the beginning part of sleep. In conclusion, our results are consistent with the hypothesis of the neurocognitive perspective of insomnia. There is enhanced attention and impaired inhibition of information processing in patients with insomnia during the initiation of sleep. However, one should be careful in assigning causal inferences from these results. Indeed, the results may represent a physiologic manifestation instead of the pathogenesis of insomnia. It is not clear if these phenomena originate from physiologic factors, cognitive or psychological factors, or an interaction of both. It also does not clarify whether overactivation in information processing is a more-specific phenomenon limited to cortical activities, as is suggested by the neurocognitive hypothesis of insomnia, or is only part of a more general hyperarousal state, as has been suggested by others.43 This issue may be further explored by examining the relationships between ERPs and other features of hyperarousal, such as indexes for autonomic arousals, in future studies. SLEEP, Vol. 30, No. 5, 2007
Because the pathogenesis of insomnia may be heterogeneous across individual patients, the neurophysiologic deficits may play different roles in different groups of patients. For example, patients who primarily experience difficulty with sleep initiation and difficulty with sleep maintenance may show different ERP patterns. Also, if the sleep difficulties experienced by patients with insomnia are associated with elevated information processing, as indicated by the ERP data, one would expect to find more ERP abnormalities in patients with a poor subjective perception of sleep. These issues are not explored in the present study because the classification of patients could be complicated by the night-to-night variation in sleep and the discordance between polysomnography-defined sleep and subjective sleep, as occurs commonly in patients with insomnia. Although the average polysomnography-defined sleep-onset latency for insomnia patients in this study was within normal range (10.8 minutes), 10 of the subjects with insomnia estimated their sleep-onset latency to be longer than 30 minutes in the morning questionnaires. Also, 6 of the subjects with insomnia, compared to 4 of the control subjects, rated their sleep-onset latency shorter than their usual sleep at home. Due to the lack of careful measures of subjective sleep and the limited number of subjects in the present study, we were unable to further divide the subjects into subgroups for analysis. These issues can be further addressed in future studies. 591
ERP During Sleep in Primary Insomnia—Yang and Lo
the evoked K-complex. J Sleep Res 1994;3:65-72. 23. Nielsen-Bohlman L, Knight RT, Woods DL, Woodward K. Differential auditory processing continues during sleep. Electroencephalogr Clin Neurophysiol 1991;79:281-90. 24. Nicholas CL, Trinder J, Colrain IM. Increased production of evoked and spontaneous K-complexes following a night of fragmented sleep. Sleep 2002;25:882-7. 25. Peszka J, Harsh J. Effect of sleep deprivation on NREM sleep ERPs and related activity at sleep onset. Int J Psychophysiol 2002;46:275-86. 26. Ornitz EM, Ritvo ER, Carr EM, La Franchi S, Walter RD. The effect of sleep onset on the auditory averaged evoked response. Electroencephalogr Clin Neurophysiol 1967;23:335-41. 27. Kallai I, Harsh J, Voss U. Attention to external stimuli during wakefulness and sleep: evoked 40-Hz response and N350. Psychophysiology 2003;40:955-66. 28. Harsh J, Voss U, Hull J, Schrepfer S, Badia P. ERP and behavioral changes during the wake/sleep transition. Psychophysiology 1994;31:244-52. 29. Gora J, Colrain IM, Trinder J. Respiratory-related evoked potentials during the transition from alpha to theta EEG activity in Stage 1 NREM sleep. J Sleep Res 1999:8:123-34. 30. Colrain IM, Di Parsia P, Gora J. The impact of prestimulus EEG frequency on auditory evoked potentials during sleep onset. Can J Exp Psychol 2000;54:243-54. 31. Ujszaszi J, Halasz P. Long latency evoked potential components in human slow wave sleep. Electroencephalogr Clin Neurophysiol 1988;69:516-22. 32. Yang C-M, Wu C-S. The effects of sleep stages and time of night on NREM sleep ERPs. Intern J Psychophysiol 2007;63:87-97. 33. Hull JS. Event-related potentials during the wake/sleep transition in adults with and without primary insomnia. [Dissertation] The University of Southern Mississippi; 1993. 34. Rechtschaffen A, Kales A. A Manual of Standardized Terminology, Techniques and Scoring Systems for Sleep Stages of Human Subjects. Los Angeles: Brain Information Service/Brain Research Institute; 1968. 35. Bastien C, Campbell K. The evoked K-complex: all-or-none phenomenon? Sleep 1992;15:236-45. 36. Niiyama Y, Fushimi M, Sekine A, Hishikawa Y. K-complex evoked in NREM sleep is accompanied by a slow negative potential related to cognitive process. Electroencephalogr Clin Neurophysiol 1995;95:27-33. 37. Colrain IM, Webster KE, Hirst G. The N550 component of the evoked K-complex: a modality non-specific response? J Sleep Res 1999;8:273-80. 38. Gora J, Colrain IM, Trinder J. The investigation of K-complex and vertex sharp wave activity in response to mid-inspiratory occlusions and complete obstructions to breathing during NREM sleep. Sleep 2001;24:81-9. 39. Bastien C, Campbell K. Effects of rate of tone-pip stimulation on the evoked K-complex. J Sleep Res 1994;3:65-72. 40. Colrain IM. The K-complex:A 7-decade history. Sleep 2005;28:255273. 41. Halasz P. K-complex, a reactive EEG graphoelement of NREM sleep: an old chap in a new garment. Sleep Med Rev 2005;9:391-412. 42. Nofzinger EA, Buysse DJ, Germain A, Price JC, Miewald JM, Kupfer DJ. Functional neuroimaging evidence for hyperarousal in insomnia. Am J Psychiatry 2004;161:2126-8. 43. Bonnet MH, Arand DL. Related Hyperarousal and insomnia. Sleep Med Rev 1997;1:97-108.
ACKNOWLEDGMENTS This study was supported by the National Science Counsel, Taiwan (Grant No. NSC91-2413-H-030-007 and NSC92-2413H-030-014). REFERENCES 1. 2. 3. 4. 5. 6. 7. 8. 9. 10. 11. 12.
13.
14. 15. 16. 17. 18. 19. 20. 21. 22.
Harvey AG. Pre-sleep cognitive activity: a comparison of sleep-onset insomniacs and good sleepers. Br J Clin Psychol 2000;39:275-86. Semler CN, Harvey AG. An investigation of monitoring for sleep-related threat in primary insomnia. Behav Res Ther 2004;42:1403-20. Wicklow A, Espie CA. Intrusive thoughts and their relationship to actigraphic measurement of sleep: towards a cognitive model of insomnia. Behav Res Ther 2000;38:679-93. Borkovec TD, Lane TW, VanOot PH. Phenomenology of sleep among insomniacs and good sleepers. J Abnorm Psychol 1981;90:607-9. Edinger J, Fins A. The distribution and clinical significance of sleep time misperceptions among insomniacs. Sleep 1995;4:232-9. Frankel BL, Coursey RD, Buchbinder R, Snyder F. Recorded and reported sleep in chronic primary insomnia. Arch Gen Psychiatry 1976;33:615-23. Monroe LJ. Psychological and physiological differences between good and poor sleepers. J Abnorm Psychol 1967;72:255-64. Perlis ML, Giles DE, Mendelson WB, Bootzin RR, Wyatt JK. Psychophysiological insomnia: the behavioural model and a neurocognitive perspective. J Sleep Res 1997;6:179-88. Freedman RR. EEG power spectra in sleep-onset insomnia. Electroencephalogr Clin Neurophysiol 1986;63:408-13. Lamarche CH, Ogilvie RD. Electrophysiological changes during the sleep onset period of Psychophysiological insomniacs, psychiatric insomniacs, and normal sleepers. Sleep 1997;20:724-33. Perlis ML, Smith MT, Andrews PJ, Orff H, Giles DE. Beta/gamma EEG activity in patients with primary and secondary insomnia and good sleeper controls. Sleep 2001;24:110-7. Perlis ML, Kehr EL, Smith MT, Andrews PJ, Orff H, Giles DE. Temporal and stagewise distribution of high frequency EEG activity in patients with primary and secondary insomnia and in good sleeper controls. J Sleep Res 2001;10:93-104. Cervena K, Dauvilliers Y, Espa F, et al. Effect of cognitive behavioural therapy for insomnia on sleep architecture and sleep EEG power spectra in psychophysiological insomnia. J Sleep Res 2004;13:385-93. Jacobs G., Benson H., Friedman R. Home-based central nervous system assessment of a multifactor behavioral intervention for chronic sleep-onset insomnia. Behav Ther 1993;24:159-74. Bonnet MH, Arand DL. Related Impact of activity and arousal upon spectral EEG parameters. Physiol Behav 2001;74:291-8. Atienza M, Cantero JL, Escera C. Auditory information processing during human sleep a revealed by event-related brain potentials. Clin Neurophysiol 2001;112:2031-45. Crowley KE, Colrain IM. A review of the evidence for P2 being an independent component process: age, sleep and modality. Clin Neurophysiol 2004;115:732-44. Harsh J, Voss U, Hull J, Schrepfer S, Badia P. ERP and behavioral changes during the wake/sleep transition. Psychophysiology 1994;31:244-52. Hull J, Harsh J. P300 and sleep-related positive waveforms (P220, P450, and P900) have different determinants. J Sleep Res 2001;10:9-17. Winter O, Kok A, Kenemans JL, Elton M. Auditory event-related potentials to deviant stimuli during drowsiness and stage 2 sleep. Electroencephalogr Clin Neurophysiol. 1995;96:398-412. Bastuji H, Garcia-Larrea L. Evoked potentials as a tool for the investigation of human sleep. Sleep Med. Rev 1999;3:23-45. Bastien C, Campbell K. Effects of rate of tone-pip stimulation on
SLEEP, Vol. 30, No. 5, 2007
592
ERP During Sleep in Primary Insomnia—Yang and Lo