structural factors: social inequalities, global city status, welfare regime and the ... of socio-economic segregation for a large number of European cities, and to ...
1 A multi-factor approach to understanding socio-economic segregation in European capital cities1 Tiit Tammaru, Sako Musterd, Maarten van Ham and Szymon Marcińczak Abstract Growing inequalities in Europe, even in the most egalitarian countries, are a major challenge threatening the sustainability of urban communities and the competiveness of European cities. Surprisingly, though, there is a lack of systematic and representative research on the spatial dimension of rising inequalities. This gap is filled by our book project Socio-Economic Segregation in European Capital Cities: East Meets West, with empirical evidence from Amsterdam, Athens, Budapest, London, Madrid, Milan, Oslo, Prague, Riga, Stockholm, Tallinn, Vienna and Vilnius. This introductory chapter outlines the background to this international comparative research and introduces a multi-factor approach to studying socio-economic segregation. The chapter focuses on four underlying universal structural factors: social inequalities, global city status, welfare regime and the housing system. Based on these factors, we propose a hypothetical ranking of segregation levels in the thirteen case study cities. As the conclusions of this book show, the hypothetical ranking and the actual ranking of cities by segregation levels only match partly; the explanation for this can be sought in context-specific factors which will be discussed in-depth in each of the case study chapters.
Introduction Although it is often claimed that socio-economic segregation is increasing in European cities, there is no recent internationally comparative and systematic research into changing levels of this form of segregation. Most research on segregation focuses on ethnic rather than socio-economic segregation, and although the two are related, the latter deserves more attention in light of increasing levels of inequality in Europe, which is also likely to be expressed spatially. Governments all over Europe fear that in the future such socio-economic segregation may lead to social unrest, referring to recent riots in several European cities. Although often openly ethno-religious, the deeper underpinnings of such urban unrest stem from rising socio-economic inequalities that are also clustered into urban space (Malmberg et al. 2013). This book will be the first to rigorously compare levels
2 Tiit Tammaru et al. of socio-economic segregation for a large number of European cities, and to use a multi-factor approach to understand segregation that combines structural factors with a context sensitive presentation of each case study city. We ask whether rising inequalities in Europe lead to what Kesteloot (2005) suggests is a shift from a city of social class divisions to a city of socio-spatial divisions, with top, middle and low socio-economic groups being increasingly separated from each other in urban space. By socio-economic segregation we mean residential segregation of population groups based on occupation and income. In the last three decades we have seen some remarkable changes in advanced capitalist countries, characterised by a transformation from industrial to post-industrial societies, accompanied by growing levels of liberalisation and globalisation of capital and labour flows. These changes have impacted on occupational structures and have led to wage inequalities even in the most egalitarian European countries (Sachs 2012; European Commission 2010). The fall of the Iron Curtain in 1989 and the demise of the Soviet Union in 1991 integrated many former communist countries in Central and Eastern Europe (East Europe hereafter2) into ongoing globalisation and neoliberalisation processes. The combination of these processes with transformations from centrally planned to market economies brought about a rapid decline in real per capita income between 1988 and 1993: minus 41 per cent in the Baltic states and minus 25 per cent in the Visegrad countries (Deacon 2000: 148). Before 1989/1991, wage inequalities in East European countries were small but have grown dramatically since (Słomczyński and Shabad 1996; Tsenkova 2006). In addition, in most East European countries housing was supported by state patronage under socialism, but during the 1990s more than 90 per cent of the housing stock was privatised as states withdrew from the costly housing sector (Hegedüs 2013). These fundamental changes were the inspiration for formulating the overarching goal of this book: to provide new insights into the spatial dimension of growing socio-economic inequalities in Europe, in the light of the processes of globalisation, neoliberalisation and welfare state retrenchment. The book delivers a set of theoretically informed, methodologically sound, and policy and planning relevant systematic comparative studies that provide new evidence of the changing levels and patterns of socio-economic segregation across a diverse set of European cities: Amsterdam, Athens, Budapest, London, Milan, Madrid, Oslo, Prague, Riga, Stockholm, Tallinn, Vienna and Vilnius. We focus on these economic and political capital cities because they have been the most influenced by globalisation (Beaverstock et al. 2015). Especially in East Europe, many important changes induced by globalisation occurred in the capital cities first (Marcińczak et al. 2015; Stanilov 2007; Smith and Timár 2010). Although the case study cities are diverse in size, they do share similar positions in their countries as important locations for government services, as centres for education and jobs, and for international investments. The study is based on a multi-factor approach that focuses on key structural indicators shaping socio-economic segregation: globalisation, social inequalities, welfare regimes and housing systems, as well as the occupational structure
Understanding socio-economic segregation 3 of cities (Hamnett 1994; Kemeny 1995; Marcińczak et al. 2015; Musterd and Ostendorf 1998; Sassen 1991). This approach is combined with more nuanced institutional and contextual approaches that have found their way into studies of residential segregation (Burgers and Musterd 2002; Kazepov 2005; Maloutas 2012; Van Kempen and Murie 2009). The latter approaches emphasise the role of local institutional, morphological, historical and spatial contexts in mediating effects of more universal/generic structural factors on patterns of segregation. Since such city-specific factors are very important, along with the more generic ones for understanding segregation, each chapter of this book will deliver a detailed account of the unique features of a given case study city. The next section of this introductory chapter contains a literature review on the key structural factors that shape socio-economic segregation. Because cities in East Europe are still understudied with respect to inequalities and segregation (cf. Van Kempen and Murie 2009), we will briefly elaborate on the urban experiences in the formerly state socialist countries in a separate section. The main focus here will be on the legacies of central planning and some distinct features of the socialist city that are important for understanding socio-economic segregation. The importance of context will be discussed in more detail in the next section. Then we will develop a multi-factor analytical framework that guides the analyses of the thirteen cities in the rest of the book. The operationalisation of this framework leads to a hypothetical ranking of our case study cities by their expected levels of socio-economic segregation. We will then present the data and methods behind our analysis in the next section. In a separate section we introduce the rest of the book chapters, which will each deliver a contextually sensitive and empirically detailed account of socio-economic segregation in one of the thirteen cities in 2001 and 2011 (corresponding with the years of the census in many countries). Finally, we will reflect on the expected levels of segregation in our case study cities. Taken together, this introductory chapter, the thirteen case studies and the concluding chapter of this book will provide new perspectives and insights on the evolution of socio-economic segregation and its contributory factors in major European cities.
Literature review: structural factors shaping socio-economic segregation Cities are both the main drivers of innovation and economic growth, as well as places where the biggest diversity and largest social inequalities can be found. In this review, we focus on the key structural factors that link social and spatial inequalities. Research on patterns of socio-economic residential segregation has followed four important phases: the ecological approach; research on the relationship between social and spatial inequalities inspired by a global city thesis; studies that begin with the impact of welfare regimes on residential segregation; and, most recently, studies that emphasise the importance of the contextual embeddedness of residential segregation (Maloutas 2012; Marcińczak et al. 2015; Musterd and Ostendorf 1998; Van Kempen and Murie 2009).
4 Tiit Tammaru et al. Charles Booth’s (1887) detailed social and spatial description of Tower Hamlets in London could be considered as the beginning of a more systematic research on segregation. Extending from description to explanation, scholars from the Chicago School provided a human ecology framework of invasion and succession to explain the evolving segregation patterns in cities (Park et al. 1925). The ecological approach explained the evolution of segregation by referring to natural forces that are the same in all cities. Consequently, cities develop towards similar spatial structures with different social and ethnic groups clustering into different parts of the city (Häusserman and Haila 2005). The Chicago School developed an important toolbox of segregation indices that are still used in segregation research today (Massey and Denton 1988; Marcińczak et al. 2015; Peach 2009). Applying these indices to real data typically reveals a U-shaped segregation pattern across occupational groups, with the biggest spatial distance being between the highest and lowest social categories or occupations (Duncan and Duncan 1955; Ladányi 1989; Morgan 1975; 1980). The ecological approach developed into a factorial ecology during the post-war positivist research tradition (Berry and Kasarda 1977), and later into GIS-based studies of segregation and advanced spatial modelling (Wong 2003). Methodologically, these studies stressed that for a rigorous spatial analysis, the units used should be internally homogeneous so that the variation of interest, for example the distribution of socio-economic groups across the city, becomes visible between the units as an ecological variation (Janson 1980). This indicated the problem of how to define neighbourhoods (known as the modifiable area unit problem) and raised the question of how the conceptualisation of neighbourhoods affects segregation measures (Fotheringham and Wong 1991). Following the research by Kish (1954) on within-unit and inter-unit variation of a given phenomenon in and across neighbourhoods, Manley et al. (2016) make an important methodological contribution to this book by extending the ecological tradition into a multilevel research setting. It should also be noted that in parallel with the advancements of the ecological approach, behavioural (Wolpert 1965) and institutional (Rex and Moore 1967) approaches towards studying segregation started to emerge. These are beyond the scope of this book. Income inequalities started to grow in advanced capitalist countries in the 1980s (Piketty 2013) and in Eastern Europe in the 1990s (Sztompka 1996), and this reinvigorated the interest in relations between social inequalities and socioeconomic segregation. These relations play a major role in the social polarisation versus professionalisation debate (Manley and Johnston 2014; Hamnett 1994; Sassen 1991). The concentration of higher-order management and coordination and service functions of multinational corporations into large cities is a direct result of globalisation and economic restructuring. According to the global city thesis this leads to social polarisation; a class of well-paid workers in the financial and other higher-order services emerges on the one hand, and since they require consumer services this provides jobs for many low-skilled workers on the other hand (Sassen 1991). Others argue that professionalisation rather than polarisation takes place in the global cities (Hamnett 1994; Préteceille 2000).
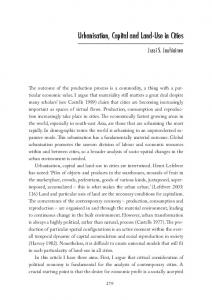
Understanding socio-economic segregation 5 The widespread pursuit of free market efficiency in the housing sector in Europe in tandem with globalisation and economic restructuring since the 1980s, and the retrenching of welfare states, implied significant cuts in universal housing subsidies, privatisation of part of the social housing stock and the promotion of home ownership (Arbaci 2007). Major changes in the housing sector started in the UK with the right-to-buy policy in the 1980s, which led to an increase in home ownership and a decline of the social housing sector, residualising this sector and increasing socio-housing divides (Kleinhans and van Ham 2013). This trend of decreasing importance of social (or public) housing subsequently spread across Western Europe (Jones and Murie 2006), while at the same time people with a lower social status became increasingly overrepresented in social housing (Van Kempen and Murie 2009; van Ham and Manley 2009; Manley et al. 2013). Since social housing is often concentrated in certain parts of cities, the developments in the housing market combined with a growing social polarisation, ceteris paribus, should lead to rising levels of residential segregation.3 Globalisation and economic restructuring thus create socio-housing divisions that become the core drivers of residential segregation (Figure 1.14). Further, since these changes in the housing sector spread across most Western European countries in the 1980s, it has been argued that this leads to increasing convergence of European housing systems (Arbaci 2007). European countries are still characterised by high levels of social protection and income redistribution (although declining) that cushions the effects of globalisation and economic restructuring (Musterd and Ostendorf 1998). This is also the core argument why we find lower levels of residential segregation in
Figure 1.1 Globalisation and socio-economic segregation.
6 Tiit Tammaru et al. Western European cities compared to USA cities (Musterd 2005; Van Kempen and Murie 2009). Essentially, the welfare state helps to lower residential segregation through direct reductions of social inequality, or through housing policy, or through both (Figure 1.2). The cutbacks in welfare and housing benefits across Western Europe directly affect those who are dependent on such benefits, such as unemployed or lower-income groups, increasingly pushing them into lower-cost housing (Marcuse and Van Kempen 2000). Retrenchment of the welfare state, the promotion of home ownership together with social and economic change (professionalisation) and spatial change (gentrification, suburbanisation) thus potentially contribute to increasing levels of socio-economic segregation. The sorting of social groups across housing and neighbourhood types increasingly emerges from market transactions, favouring middle-income and high-income population groups over low-income groups (Van Kempen and Murie 2009; Dewilde and Lancee 2013). Despite converging tendencies, European countries still represent different types of welfare regimes (social democratic, corporatist and liberal; see Esping-Andersen 1990) and housing systems (unitary, dual; see Kemeny 1995). The corporatist (and its distinct Mediterranean variant) and social-democratic welfare types are characterised by a relatively large social housing sector and unitary rental system in which social and private renting are integrated into a single rental market, with high levels of socio-tenure mix and low levels of residential segregation (Arbaci 2007). The liberal and Southern European welfare types are characterised by a dualist rental system, in which the state controls and residualises the social rental sector for vulnerable and low-income groups, leading to higher levels of socio-tenure segmentation and residential segregation but often at a very micro scale (ibid.).
Figure 1.2 Social inequalities, welfare state and socio-economic segregation.
Understanding socio-economic segregation 7 Fenger (2007) found that East European countries are both collectively distinct from the Western countries and different from each other. Namely, Visegrad countries (including the Czech Republic and Hungary represented in this book) could be characterised as post-socialist corporatist regimes, while Baltic countries Estonia, Latvia and Lithuania could be characterised as post-socialist liberal welfare regimes. The main differences between the two country groups relate to the social stratification dimension, with higher social inequalities being found in the Baltic countries compared to the Visegrad countries. Next, we will elaborate more on the specific features of Eastern European cities that stem from their socialist legacy.
Eastern Europe: central planning and the socialist city Cities in Western Europe are generally less segregated than in the USA, and the literature provides some evidence that the communist rule and centrally planned production and consumption policies in East European countries resulted in less socio-economically segregated cities there in comparison to Western Europe (Dangschat 1987; Ladanyi 1989; Musil 1987; Węcławowicz 1979). The socialist states nationalised the means of production and had a central role in the production and redistribution of goods, with housing being one of the most valued (Kornai 1992; Verdery 1996). Urbanisation had a particular significance in the formerly centrally planned countries: on the one hand, it facilitated the fulfilment of ambitions for industrialisation and signified modernisation and progress, and on the other hand it encouraged collective rather than individual identity with the aim of creating a socially just society (Kährik and Tammaru 2010; Smith 1996). A more uniform city with little economising of space and little urban diversity emerged in countries under central planning (Gentile et al. 2012; Szelényi 1996). The high degree of urban homogeneity was a function of the share of the urban fabric constructed under socialism when the focus was on standardised mass construction of high-rise housing estates. In the context of the pool of cities included in this book, the imprint of the socialist legacy, for example in the form of socialist housing estates, is larger in the Baltic capitals in comparison to Visegrad capitals (Marcińczak et al. 2015). When it comes to segregation, the administrative allocation of housing free of charge (apart from cooperative housing that formed a minor part of the new housing construction) became an important tool for building the desired uniform and egalitarian society. The production and administrative allocation of goods, which were either free of charge or heavily subsidised, was broader than housing and characterised many key aspects of society – ranging from subsidised food, transport, guaranteed employment, adequate health and education (Deacon 2000). This implies that state paternalistic welfare, sometimes called the totalitarian corporatist welfare state (Sennett 2003), characterised countries under central planning (Verdery 1996). With time, market elements were introduced in some domains of the economy, first in the Visegrad countries and later, from the mid-1980s, in the Soviet Union in the form of perestroika – the policy to restructure Soviet political and economic systems – introduced by the Soviet leader Gorbachev.
8 Tiit Tammaru et al. Budapest was the first to introduce market-relations in housing (Bodnár and Böröcz 1998) and, interestingly, at the end of socialism it was the most segregated East European capital city among the pool of cities included in this book (Kovács 2009; Marcińczak et al. 2015). Although the mass construction of standardised housing was common in many non-communist Western European countries in the 1960s through the 1980s, the scale was much higher in East European cities (Gentile and Sjöberg 2013). In other words, the redistributive effect of the state in the form of public housing allocation (see Figure 1.2) in countries under central planning was stronger than in the West. As a result of the construction of vast high-rise housing estates, East European cities were characterised by less sprawl than Western cities (Bertaud and Renaud 1997; Tammaru 2001). Moreover, the Iron Curtain sealed off Eastern Europe from the effects of globalisation and economic restructuring, and manufacturing industry remained the main pillar of its economic base. The result was a less segregated and spatially compact city with socially mixed neighbourhoods (Marcińczak et al. 2015). In the literature, it has been labelled as a distinct city type: the socialist city (Sýkora 2009). In comparison to many West European large housing estates, which are often in deprived areas, similar estates in East European cities show a much greater share of higher socio-economic groups (Turkington et al. 2004). In the West such housing estates originally also included middle-class families, and in some areas this is still the case, but in many places downgrading or residualisation occurred. An important question then is whether this downgrading of large housing estates will also occur in high-rise estates in Eastern Europe, as some scholars already envisaged in the 1990s (Szelényi 1996). Important changes to East European cities after the fall of the Iron Curtain twenty-five years ago are related to the economising of space, increased social inequality and increased urban diversity (Gentile et al. 2012; Hirt 2013; Szelényi 1996; Tsenkova and Nedović-Budić 2006). Large-scale privatisation and restitution of properties to pre-World War II owners were the two important specific factors shaping housing markets in East European cities in the 1990s. The concrete spatial manifestations of such changes are under debate. Segregation could be reduced further when those parts of the socialist city that were left in decay under socialism – mainly higher-density, pre-World War II inner-city areas and lower-density outer city areas – go through a process of socio-spatial upgrading, while large housing estates start to lose the relatively high status they used to enjoy under socialism. Eventually, this might cause these large housing estates to take similar positions on the housing market as in the case in many Western European cities. This in turn leads to the paradox of post-socialist transition: despite increasing social inequalities, levels of segregation either decreased from already low levels (Sýkora 2009; Marcińczak et al. 2013) or virtually did not change (Marcińczak et al. 2014) in the 1990s. This paradox, however, could be a temporary phase of urban socio-spatial change; the evolutionary view predicts that, with time, new residential socio-economic segregation patterns will emerge as the residential choices of managers and professionals, as well as in situ demographic and social change (effects of changes on
Understanding socio-economic segregation 9 the labour market were more extensive compared to residential mobility in East Europe in the 1990s), start to redefine the residential geographies of cities (Sýkora and Bouzarovski 2012; Tammaru et al. 2016). The gentrification of inner cities and suburbanisation of the middle class are the most eye-catching manifestations of such spatial change that could ultimately lead to higher levels of segregation. Such paradox is not unique to East European cities, though. Gentrification often lowers levels of segregation in its initial phase as higher socio-economic groups start to move into low-income inner city areas, and evidence of it can be found in many parts of Europe (for example Leal and Sorando 2016; Musterd and Van Gent 2016). Likewise, in situ change in social and demographic structures can also contribute to lowering the levels of segregation in a neighbourhood (Hochstenbach et al. 2014), for example through professionalisation or increase of income of people not moving or as a result of in situ demographic change. The latter can occur as children achieve a higher occupational status than their parents but, later, leave the parental home, move into a different dwelling in the same neighbourhood, or inherit housing from parents. Such social and demographic processes within the neighbourhoods might lead to neighbourhood socio-economic mixing in the initial phases of change. This is especially important in South European countries where spatial proximity of family members is still very common (Leal and Sorando 2016; Maloutas 2016; Petsimeris and Rimoldi 2016). Comparative research on socio-economic residential segregation using recent data is missing for East European countries, with the exception of a study by Marcińczak et al. (2016) of five East European capital cities using data from the 2000 census. The results of this study reveal low levels of socio-economic segregation, reflecting the patterns of the late socialist period. Although social inequalities rose rapidly in the 1990s, they were not directly translated into urban space since residential mobility was still low at this time of institutional reforms and housing privatisation (Hegedüs 2013). This book uses the most recent data available from the 2011 census in many countries to investigate whether and how social inequalities, created mainly in the 1990s and persisting today, start to translate into urban space.
Contextual approach to residential segregation Globalisation and economic restructuring, mediated by welfare regimes and housing systems, affect levels of socio-economic segregation. Yet, the association between structural factors and the level of segregation is not universal; it hinges on cultural differences, and on the historically developed institutional and spatial contexts of cities, where social divisions render spatial patterns in unique ways (Burgers and Musterd 2002; Maloutas 2012). Abstract models and universal factors simply fail to fully consider the rich reality of contemporary cities, with all their different historical layers and contemporary diversity in their key institutions – families, state and markets (Kazepov 2005; Häussermann and Haila 2005). Hence, making deductions from global megatrends to exact spatial patterns in the city should be done with great care.
10 Tiit Tammaru et al. What are the contextual factors that are important in shaping residential segregation, on top of and related to the welfare state and housing systems that we have already discussed? Musterd and Kovács (2013) refer to specific historically grown urban layers, while Maloutas (2012) refers to the spheres that characterise them. The economic layer pertains to labour market changes; the state layer has to do with the redistribution of public services; the social layer pertains to social and family networks; and the fourth layer is about specific local socio-spatial realities such as urban morphology. The institutional approach has made its way into the contextual understanding of segregation patterns, too, since the local institutional arrangements are much more complex and nuanced than the broad welfare regime types or housing systems, including various governance arrangements and other dimensions (Van Kempen and Murie 2009). The local realities relate, in the first place, to historical pathways that city regions have taken and which have led to the contemporary diversity of urban morphology, housing stock, social class structures, etc. (Figure 1.3). Through most of the chapters in this book, the importance of historic pathways of city development in understanding contemporary segregation patterns is repeated. The historic layers are further coloured by the cultural diversity of Europe. For example, the family dimension is very important in the social and spatial relations of Southern European cities (Maloutas 2016; Leal and Sorando 2016; Petsimeris and Rimoldi 2016). Housing in Southern European cities is often more distant from market processes and embedded in family relations (Arbaci 2007). Even then, important differences emerge also between Southern European cities, for example when it comes to the effects of the last cycle of housing boom and bust and their spatial implications in the cities of Athens, Madrid and Milan as included in this book.
Figure 1.3 Contextual approach to socio-economic segregation.
Understanding socio-economic segregation 11 The unique characteristics of place (the genius loci) are an important part of the historic development of the city. It includes, but is not restricted to, differences in attracting various economic activities, the functioning of the welfare regime and housing market, the match between demand and supply, quality of the built environment, the architecture, the urban layout and the state of the urban condition in general. These are all factors which are increasingly important assets that make a difference between cities (Musterd and Kovács 2013). All of these factors shift the attention away from generalised representation of national systems towards the unevenness of policy and capability associated with each city administration (Van Kempen and Murie 2009). The very same characteristics are also important at the intra-urban scale. The more diverse the historic layers of the city are, the greater is the housing and neighbourhood diversity, and the more ‘opportunities’ exist for different population groups to isolate themselves from other groups. Furthermore, the new urban reality, with less public involvement, could be characterised as a shift from government to governance. Various governance levels (state, region, city, neighbourhood) and other actors (private firms, inhabitants) work together in shaping the dynamics of the city and the milieus of the neighbourhoods in increasingly complex and diverse ways (Van Kempen and Murie 2009). The advancement of the contextual approach to residential segregation thus allows us to pay due attention to the historic development and urbanisation pathways, city-specific policies, governance, planning practices and other factors unique to each city. Two of the four contributory factors discussed in previous sections – welfare and housing regimes – have more to do with the contextual factors than the more generic factors of globalisation and social inequalities. Therefore, each of the following chapters includes a section that discusses the context of the city under study. Still, by contrasting the evidence of thirteen cities across Europe, we want to seize the unique opportunity to shed some light on how the key structural factors potentially shape residential segregation. We therefore have developed a multi-factor framework for studying socio-economic segregation in European capital cities.
Multi-factor framework of the study Our analytical framework for understanding social segregation in European capital cities includes four key contributory factors outlined above – socio-economic inequalities, welfare regime, housing regime and the global position of the city in the world economy – combined with a unique profile of each city. Using these factors as a starting point, we develop a theoretical model of levels of social segregation that allows us to predict segregation in each city under study. Following Marcińczak et al. (2016), and based on the literature review in the previous section, for each city we quantify the theoretical level of segregation by attaching one to three points to each factor that contributes to segregation (globalisation, Gini index, welfare regime, housing regime, share of higher occupations). This exercise may be overly simplistic, but it operationalises the conceptual framework
12 Tiit Tammaru et al. underlying this book and, when viewed in a less deterministic way, allows us to advance the debate on how the various structural factors could be related to levels of socio-economic segregation. The first factor that potentially has an important impact on levels of socio-economic segregation is globalisation. The best-known classification system groups cities into three main categories of Alpha, Beta and Gamma cities (Beaverstock et al. 2015). Alpha cities are the most important command-and-control centres in the global economy, and we attach the value 3 to them, indicating the highest expected level of segregation. The least global cities are Gamma cities and we attach the value of 1 to these, indicating the lowest expected segregation level (Table 1.1). Since we are studying capital cities, seven of our case study cities belong to the Alpha category (London, Amsterdam, Madrid, Milan, Prague, and Vienna) and only two to the Gamma category (Tallinn and Vilnius). The second factor potentially shaping levels of socio-economic segregation pertains to socio-economic inequalities. At this point it is important to acknowledge that the five factors we use are not completely independent from each other. The first factor – globalisation – is an important source of socioeconomic inequalities (Marcuse and Van Kempen 2000), but other factors shape inequalities, too, including the type of welfare regime, economic structure and many others. Thus, there is no one-to-one correspondence between the factors we use, and all of them uniquely contribute to segregation levels, as shown in the literature review in the previous sections. The most common indicator for characterising income-based socio-economic inequalities is the Gini index. The values of the index as used in Table 1.1 are obtained from around the year 2010, as is the case with the other variables (Eurostat 2015). The literature does not provide any guidance on which values of the Gini index could relate to high or low levels of segregation. Instead of focusing on the values of the index we therefore opt for a relative approach that contrasts our research cities with each other. We attach the value 3 to those cities where the Gini index is one standard deviation above the average of our thirteen cities, and we attach the value 1 to those cities where the value of the Gini index is one standard deviation below the average. All other cities get the value 2. This way, we classify London, Riga, Madrid and Athens as the most unequal cities, and Stockholm, Milan and Prague as the most equal cities (Table 1.1). The link between socio-economic inequalities and socio-economic segregation is moderated by the type of the welfare regime. We use three main types of welfare regime (Esping-Andersen 1990), and we distinguish the South European or Mediterranean regime within the corporatist type. Arbaci (2007) shows that the liberal welfare regime tends to correlate with higher levels of residential segregation, while corporatist and social-democratic welfare types tend to relate to lower levels of segregation. Interestingly, she further argues that a corporatist (as well as Mediterranean) welfare regime could lead to a more mosaic type of urban spatial structure because of the large number and diversity of urban developers compared to the social-democratic welfare regime. As a consequence, Arbaci argues that the
Alpha++ BetaGamma Alpha Gamma Alpha Alpha Beta+ Beta Beta+ AlphaAlphaAlpha-
Globalisation
3 2 3 1 3 1 3 2 2 2 3 3 3
London Riga Vilnius Madrid Tallinn Milan Amsterdam Budapest Oslo Athens Stockholm Prague Vienna
Indicator values:
London Riga Madrid Vilnius Milan Tallinn Amsterdam Athens Budapest Oslo Stockholm Prague Vienna
3 3 3 2 1 2 2 3 2 1 1 1 2
Gini index
38 35 34 36 32 21 30 29 27 35 24 27 28
Gini index
Notes: * Share of managers and professionals in the workforce. ** Share of elementary occupations in the workforce. *** Post-socialist.
Globalisation
Indicators:
3 3 2 3 2 3 1 1 1 2 2 1 1
Welfare regime
Liberal Liberal-PS*** Liberal-PS Mediterranean Liberal-PS Mediterranean Corporatist Corporatist-PS Social Democratic Mediterranean Social Democratic Corporatist-PS Corporatist
Welfare regime
3 3 2 3 2 3 1 2 3 3 1 1 1
Housing regime
Dual Dual-PS Dual-PS Mediterranean Dual-PS Mediterranean Unitary Dual-PS Dual Mediterranean Unitary Unitary-PS Unitary
Housing regime
2 2 1 3 2 2 3 1 2 2 2 1 1
Higher occupations*
33 33 50 29 34 32 46 34 37 26 33 26 28
Higher occupations*
Table 1.1 �Key structural indicators that shape socio-economic segregation and their corresponding values
2 2 3 2 3 2 2 2 1 1 2 2 1
Lower occupations**
10 10 7 14 8 15 5 7 4 9 6 5 9
Lower occupations**
16 15 14 14 13 13 12 11 11 11 11 9 9
Sum
14 Tiit Tammaru et al. lowest levels of segregation evolve under corporatist welfare regimes. We therefore expect that the welfare regime contributes to higher levels of segregation in London, Riga, Tallinn and Vilnius, and to lower levels of segregation in Amsterdam, Athens, Budapest, Milan, Madrid, Prague and Vienna. The classification of the welfare regimes does not take into account the housing systems – a key element influencing segregation (Maloutas 2012). Socio-economic residential sorting is firmly shaped by the extent of income-based housing markets and policies (Reardon and Bischoff 2011). Although strongly linked, welfare regimes and housing regimes do not necessarily correspond with each other. The best examples in our pool of cities include Oslo and Stockholm. Although both represent a social-democratic welfare regime, the housing sector in Oslo (Wessel 2016) is much more market based compared to Stockholm (Andersson and Kährik 2016). Therefore, as the fourth key contributory factor, we introduce the housing regime into our analytical framework by assuming that marketisation of housing produces a stronger spatial separation of socio-economic groups (Marcińczak et al. 2015). As shown in the literature, the most important division line runs between dual and unitary housing systems (Kemeny 1995). Market-based residential sorting in the dual system can be expected to lead to stronger income-based residential segregation in cities such as Budapest, London, Oslo, Riga, Tallinn and Vilnius (Table 1.1). A lower level of marketisation and a tenure-neutral housing policy under the unitary housing system would lead to weaker income-based residential segregation in cities such as Amsterdam, Prague, Stockholm and Vienna. As with the welfare regimes, we distinguish a South European housing regime which sits in-between the two main types. Athens, Madrid and Milan represent such cities in our study. The level of socio-economic segregation is also a function of the occupational structure of the city. The more socially polarised a city is, the higher the levels of expected segregation (Mollenkopf and Castells 1991) since both the higher-status and lower-status groups tend to be more segregated compared to middle-status groups (Duncan and Duncan 1955; Morgan 1980; Marcińczak et al. 2015). The share of managers and professionals has increased remarkably while the share of people working in elementary occupations (unskilled workers) has decreased to 15 per cent of the workforce or less in our research cities. We use both the share of managers and professionals, as well as the share of people working in elementary occupations to account for the effect of the occupational structure (Table 1.1). We do not prefer one group to another since in some of our case study cities, managers and professionals are the most segregated group while in other cities unskilled workers form the most segregated group. In Amsterdam and Vilnius, the share of managers and professionals is more than one standard deviation above the average, and we expect that this has a strong effect on segregation in those two cities. In the case of unskilled workers, this effect is strongest in Madrid and Milan. In Athens, Prague and Vienna, the share of managers and professionals is one standard deviation below the average, and we expect that this leads to the lowest levels of segregation. In the case of unskilled workers, this is true for Budapest, Oslo and Vienna. As a final step, we calculate the sum of the indicator scores for each city in Table 1.1 (last column of the lower half of the table). We do not weight the various
Understanding socio-economic segregation 15 scores since the literature provides no guidance on how to weight each of them. The result of this exercise is a theoretical ranking of our thirteen case study cities based on the levels of socio-economic segregation. This ranking is obviously sensitive both to the number of factors/indicators included in the analytical framework, as well as to the scores attached to them. However, this is a first attempt to systematically contrast theoretical segregation levels across European capital cities and empirically test them (Marcińczak et al. 2016). The summation itself provides the following hypothetical ranking of cities included in this study (from most to least segregated): London (16 out of 18); Riga (15); Madrid and Vilnius (14); Milan and Tallinn (13); Amsterdam and Athens (12); Budapest, Oslo and Stockholm (11); Prague and Vienna (9). In order to facilitate our comparative study we next discuss data and methods that guide the analysis of the chapters included in this book.
Data and methods In order to undertake a rigorous comparative analysis of socio-economic segregation in thirteen cities, the first task is to produce comparable datasets. This is not easy because of two major obstacles. First, different countries use different key indicators for socio-economic status. Second, different countries have different data policies when it comes to releasing data for small geographic areas, and use different aggregation levels of either socio-economic groups or spatial units/neighbourhoods. These obstacles are beyond our control, but we aimed at a high level of comparability and analytical detail within these two sets of limits. The first data-related challenge pertains to the indicators of socio-economic status. We had to use three different variables for measuring socio-economic status in different cities: occupation, income and education. Occupation, but not income, is available at a detailed geographic resolution in those countries that undertake censuses. The analysis of Athens, Budapest, Madrid, Milan, London, Prague, Riga, Tallinn and Vilnius is thus based on occupational data. Income, but not occupation, is available at a detailed geographic resolution for cities in register-based countries: Amsterdam, Oslo and Stockholm. Finally, the study of Vienna is based on education as Austria switched from census to registers in 2010 with the unfortunate side effect that neither income nor occupation data is available at a detailed geographic resolution in this country for the 2001–2011 period. We use the International Standard Classification of Occupations (ISCO) for defining the major occupational groups in chapters based on occupational data (ILO 2015), and income quintiles are used in chapters based on income data. We excluded two small occupational groups, agricultural workers and armed forces, from the ten major categories in the ISCO classification used in our analysis. This leaves us with the occupational ladder of eight major categories: managers, senior officials and legislators; professionals; technicians and associate professionals; clerks; service and sales workers; craft and related trades workers; plant and machine operators, and assemblers; and elementary occupations.
16 Tiit Tammaru et al. The ISCO classification is generally internationally comparable, although it should be noted that countries do make some minor modifications to the classifications. What is more important is that the classification itself changed between the 2001 and 2011 census rounds. ISCO-08 replaced the ISCO-88 for several reasons, mainly because the latter was seen to be seriously outdated, most notably due to developments in the field technology sectors (ILO 2007). Also, there was a need to better aggregate managerial occupations (ILO 2012). Most of the changes took place within the ten major categories, but some jobs were also shifted from one major category to another (detailed ISCO-88 and ISCO-08 correspondence tables can be found at ILO 2015). Most importantly, managers of small organisations without any sophisticated hierarchical structure, such as small shops, restaurants, cafes and similar establishments, were shifted from the first major group of managers to the fifth major group, service and sales workers. This had an especially important effect on cities with a large number of such small establishments, such as Southern European cities. Occupation and income are strongly related to each other: the higher the job in the occupational ladder the higher the income, with managers and professionals earning the most (Table 1.2). The relationship is not directly linear, though. For example, service sector workers have the lowest income together with the elementary workers. Another general issue to consider is that the extent of the differences between occupational groups varies city by city. For example, differences in the wages between occupational groups are the smallest in Athens (for example, managers earn 2.2 times the salary of elementary workers) and Stockholm, and the largest in Prague, Budapest and Madrid. Despite those differences, it is still safe to
Professionals
Technicians
Clerks
Service workers
Craft workers
Operators
Elementary workers
Amsterdam Athens Budapest London Madrid Milan Oslo Prague Riga Stockholm Tallinn Vienna Vilnius
Managers
Table 1.2 �Income of occupational groups relative to people working in elementary occupations (data from around 2010)
3.3 2.2 5.1 2.7 4.6 3.8 3.0 5.3 2.9 2.3 3.5 3.0 3.1
2.5 2.3 3.2 3.0 2.6 1.9 2.1 3.0 2.4 1.7 2.3 2.1 2.3
2.3 2.0 2.2 3.0 2.2 1.6 1.9 2.3 2.0 1.4 1.9 1.8 1.8
1.5 1.6 1.7 1.7 1.5 1.4 1.4 1.7 1.6 1.2 1.4 1.5 1.5
1.1 1.4 1.1 1.0 1.2 1.1 1.0 1.3 1.1 1.1 1.3 1.1 1.1
1.6 1.3 1.5 1.2 1.6 1.1 1.5 1.6 1.4 1.2 1.9 1.5 1.4
1.5 1.6 1.5 2.0 1.6 1.2 1.5 1.5 1.5 1.2 1.6 1.4 1.5
1.0 1.0 1.0 1.0 1.0 1.0 1.0 1.0 1.0 1.0 1.0 1.0 1.0
Source: Statistical Offices of the countries.
Understanding socio-economic segregation 17 argue that the two variables used in different case studies in this book – income and occupation – are clearly positively related to each other, allowing us to make broad comparisons between the findings. In Vienna, as noted, education has been used as a proxy for socio-economic status. This variable also correlates with income and professional categories, but again this is not a one-to-one relationship. Some caution is required when comparing this city with the others. We used data from the 2000 and 2010 (or any other years close to these) census rounds. Some chapters also use data from the 1990 census round. We define cities as a continuous built-up area that forms a common housing market. In other words, the analysis is not confined to administrative city boundaries. Within this broad definition of a common housing market area, authors had to use different definitions. For example, cities that are more sprawling (many Western European cities without a communist past) adopt an extensive delimitation strategy of the city, while cities that are less sprawling (many East European cities) adopt a more restrictive delimitation strategy. Likewise, in some cities, data was available for the administrative unit only. Again, all these data limitations are beyond our control. Within the cities, the suggested smallest spatial unit of analysis is a neighbourhood of around a thousand inhabitants. We apply the most well-known indices of segregation that measure the residential separation of population subgroups from each other, focusing either on their distributions across the neighbourhoods (evenness dimension) or on the potential to meet each other within each neighbourhood (exposure dimension). While studies of ethnic segregation tend to have a stronger interest towards the exposure dimension of segregation that characterises the potential for interaction between ethnic groups, in this book, our main focus is on the evenness dimension that allows us to understand how equally socio-economic groups are distributed across the neighbourhoods of European capital cities. Yet, we present both. For analysing the evenness dimension, we calculate a dissimilarity index5 (D) that compares the spatial distance between each occupational/income group, and the index of segregation6 (IS) that compares the spatial distance of a given group from the rest of the workforce. Our main focus is on D. The values of the D range from 0 to 100, indicating what percentage of either one or the other group needs to change address across the neighbourhoods in order to achieve a similar residential distribution to the reference group. The D value 0 represents the completely equal distribution of the two groups across the neighbourhoods, while the D value 100 represents complete separation, with some neighbourhoods providing shelter to the members of a given group and other neighbourhoods to the other group. If the D value for the managers compared to professionals is 20, it means that either 20 per cent of managers or professionals have to redistribute in the city in order to achieve their equal distribution across neighbourhoods. In the context of ethnic segregation, index values of D below 30 are interpreted as low and D values above 60 are interpreted as high (Massey and Denton 1993). Since levels of socio-economic segregation tend to be lower than levels of ethnic segregation, Marcińczak et al. (2015) suggest that D values below 20 can be interpreted as low and D values above 40 can be interpreted as high.
18 Tiit Tammaru et al. Next, we capture the exposure dimension of segregation by calculating the index of isolation (II) and the modified index of isolation7 (MII). The meeting potential it captures is important since previous literature argues that when lower socioeconomic groups get isolated, they are cut off from important social networks and positive role models, thereby starting to hamper their other life careers (van Ham and Manley 2012). The II is sensitive to the relative sizes of the groups. If the given group is large in size, its probability for meeting members of the other groups in residential neighbourhoods is small, and if the group is small in size, its probability for meeting members of the other group in residential neighbourhoods is large, regardless of their even distribution across the neighbourhoods. Think of a group A of a thousand people and a group B of a hundred people who have a similar distribution across three neighbourhoods of a city, i.e. 50 per cent, 30 per cent and 20 per cent of the members of both groups live in neighbourhoods X, Y and Z, respectively. Because of differences in size, in each of these neighbourhoods X, Y and Z members of group A have a high potential to meet own-group members, while members of group B have a small potential to meet own-group members. When the group A increases in size, its isolation from the group B increases further, even when the distribution of both groups across the neighbourhoods remains the same. This is exactly the case in cities that are undergoing a process of professionalisation – the share of managers and professionals increases in the urban workforce – which is typical for most of our research cities. Indices that measure the exposure dimension of segregation can thus change without changes taking place in indices that measure the evenness dimension of segregation. In order to also take into account the group size and its change, the modified index of isolation (MII) is used by subtracting the city-wide share of the group from II. We use both the II and MII for analysing the potential to meet members of the other socio-economic categories in their residential neighbourhood. The smaller the MII value, the less isolated the given group is from the rest of workforce and vice versa. For example, if the MII value for the managers is 20, it means that 20 out of the hundred people this person potentially meets within the neighbourhood of residence are also managers. In the context of ethnic segregation, the index values of MII below 30 are interpreted as low and MII values above 60 are interpreted as high (Massey and Denton 1993). Again, since levels of socio-economic segregation tend to be lower than levels of ethnic segregation, we interpret MII values below 20 as low and MII values above 40 as high. This book compares residential distributions of all eight major occupational groups or five income groups to each other to find out how strongly socioeconomic distance is related to spatial distance. All indices presented above are sensitive to the aggregation of workers into occupational/income groups, and the aggregation of addresses into residential neighbourhoods. As a rule of thumb, the larger the groups/neighbourhoods used are, the lower are the values of the dissimilarity index. When it comes aggregating addresses into neighbourhoods, we face zoning and scaling problems (see Flowerdew et al. 2008 on the modifiable area unit problem). The most common way of overcoming these is to define neighbourhoods as small and homogenous spatial units. Obviously, the
Understanding socio-economic segregation 19 aggregation of jobs into major occupational categories faces a similar problem. Here we follow the most common approach as explained above by using the standard major ISCO categories developed by the ILO (2015). Finally, in order to also learn about the local geographies of segregation, we use location quotient8 (LQ) maps that visualise the relative spatial concentration or dispersion of income/occupational groups in the neighbourhoods of the city. In essence, the LQ is a ratio between the share of a given group, such as managers, in a given spatial unit, and the city-wide share of this group. If the ratio is less than 1, the group is underrepresented in the given neighbourhood, and if it is more than 1, the group is overrepresented in the given neighbourhood. These simple but well-known and widely used measures (D, IS, II, MII, LQ) are applied in all cities to 2001 and 2011 (census) data. In addition to this harmonised analysis, each chapter elaborates on the topics which are most relevant in the given city context for the understanding of changing levels and patterns of socio-economic segregation.
Main findings: introduction to the book chapters The 13 cities brought together into this book represent different regions of Europe, as well as different degrees of globalisation, inequality, welfare and housing regimes, and occupational profiles (Table 1.1). The multi-factor approach resulted in the following theoretical ranking of cities with regard to their expected level of socio-economic segregation: London; Riga; Madrid and Vilnius; Milan and Tallinn; Amsterdam and Athens; Budapest, Oslo and Stockholm; and finally Prague and Vienna. The case studies presented in this book revealed a somewhat different ranking based on real data: Madrid and Milan; Tallinn; London; Stockholm; Vienna; Athens; Amsterdam; Budapest; Riga; Vilnius; Prague; and Oslo. Most importantly, Riga and Vilnius are actually much less segregated, while Stockholm and Vienna are much more segregated compared to what we predicted. We will elaborate further on the differences between the theoretical and actual rankings of cities in the conclusion of this book (Marcińczak et al. 2016). Next, we will briefly introduce each city and highlight the main findings from the contributions that follow in the rest of the book. London, Amsterdam and Vienna represent West European cities. Based on factors outlined in Table 1.1, we hypothesised London to be highly segregated, Amsterdam moderately segregated and Vienna weakly segregated. The main findings confirm the hypothesis for London and Amsterdam but not for Vienna, which is highly segregated too. More specifically, the D value between top and bottom socio-economic groups is 42, 33 and 39 in these cities respectively. Also, by applying innovative multivariate extensions of traditional segregation indices for the first time, Manley et al. (2016) modelled occupational segregation in London. They found that although overall segregation decreased slightly in the 2000s, it was not statistically significant and there are still sharp divisions within the city landscape, with growing spatial distance between the top and bottom socio-economic groups. Amsterdam is the only one within our pool of cities where segregation
20 Tiit Tammaru et al. between the top and bottom socio-economic groups decreased in the 2000s. This has happened at times of strong neo-liberalisation tendencies that included an increase in owner occupation and residualisation of social housing that contribute to forces that would increase segregation. Musterd and Van Gent (2016) argue that the still low level of segregation is probably related to the long tradition of a fairly equal income distribution in the Netherlands, but that the recent decrease must be attributed to the 2008 financial and economic crisis, which reduced residential mobility, and a temporary effect of new gentrification processes that initially causes more social mix and thus a decreasing level of segregation. Vienna has long been focused on policies of social equality, with the city constantly working to develop measures aimed at reducing social disparities. Contrary to Amsterdam, Vienna experienced a significant increase in socio-economic segregation in the 2000s. Hatz et al. (2016) link high levels of socio-economic segregation in Vienna with new immigration. There is also evidence that lower socio-economic groups have become more confined to public housing neighbourhoods. Stockholm and Oslo represent North European cities. Based on the factors outlined in Table 1.1, we hypothesised Stockholm to be weakly and Oslo to be modestly segregated. The main findings do not confirm these hypotheses. More specifically, the D value between top and bottom socio-economic groups is as low as 24 in Oslo and as high as 40 in Stockholm. Quite unexpectedly, thus, the two cities with similarly low levels of social inequality are among the most and least segregated cities among our thirteen cities. This can partly be due to differences in measurement: the study of Stockholm is restricted to working age population while no such restriction was applied in Oslo. Still, the high level of segregation in Stockholm comes as a surprise. Andersson and Kährik (2016) argue that despite the long tradition of elaborate public policies in Sweden that have aimed towards neighbourhood social mix, the public sector started to cut back on housing subsidies in the 1990s. Wessel (2016) argues that the emerging pattern of socio-economic segregation in Oslo is a ‘contingent outcome’ of many structural factors rather than a simple reflection of economic transformation and globalisation. An especially generous welfare system due to the Norwegian revenues from natural resources is an important characteristic of Oslo above and beyond the strongly market-based housing system that allows the sustaining of relatively high levels of equality, at least in a comparative perspective. Athens, Milan and Madrid represent South European cities. Based on the factors outlined in Table 1.1, we hypothesised Madrid to be the most segregated, followed by Milan and Athens. The main findings partly confirm these hypotheses. More specifically, the D value between top and bottom socio-economic groups is 49 in Madrid and Milan, and 35 in Athens. Madrid and Milan are also the most segregated cities in our pool of European capitals. Despite high levels of social inequality we find not only moderate levels and stable patterns of socio-economic segregation in Athens but even desegregation between some occupational groups. Maloutas (2016) explains this as a combination of stability in occupational structures, reduced immigration, high rates of homeownership and low levels of residential mobility at time of crisis, as well as vertical segregation
Understanding socio-economic segregation 21 within buildings. According to Leal and Sorando (2016), both professionalisation and residential entrapment of lower socio-economic groups are behind the dramatic growth in levels of segregation in Madrid. Furthermore, the authors argue that the invasion of professionals into new parts of the city, for example as a result of gentrification, as well as in situ inter-generational social mobility both actually exerted lowering effects on levels of segregation. In Milan, Petsimeris and Rimoldi (2016) indicate that some of the important mechanisms behind segregation include self-segregation of business owners into the most exclusive residential areas of the city; in situ intra- and inter-generational social mobility; and the purchase of apartments by working-class households under the right-tobuy schemes and a later selling of their properties to more affluent social groups. In East Europe, we make a distinction between Visegrad and Baltic capitals; Budapest and Prague represent Visegrad cities. Based on the factors outlined in Table 1.1, we hypothesised Budapest to be moderately and Prague to be modestly segregated. The main findings confirm these hypotheses. More specifically, the D value between top and bottom socio-economic groups is as low as 26 in Prague and 32 in Budapest, with a slightly increasing trend in both cities. Budapest used to be the most segregated city in East Europe, but this is not the case anymore. Furthermore, instead of higher socio-economic groups, lower socio-economic groups became most segregated in the 2000s. Kovács and Szabó (2016) think that the most plausible reason for the decreasing segregation level of professionals is their more even distribution across neighbourhoods, triggered by new housing projects developed in the inner city and other areas with previously a high share of lower socio-economic groups. This is quite similar to what is taking place in Prague. Ouředníček et al. (2016) agree that low levels of socio-economic segregation are mainly a consequence of the location of new housing and in-migration of higher socio-economic groups into the formerly poorer neighbourhoods, often in the inner city of Prague. Such changes are common to many other cities included into our analysis beyond Eastern Europe. In other words, the increase of social inequalities often goes hand-in-hand with gentrification, which, at least initially, brings down levels of segregation as different social groups begin to mix in the inner city. Riga, Vilnius and Tallinn represent Baltic cities in East Europe. They share a Soviet past and nation-building since regaining independence in 1991. Based on the factors outlined in Table 1.1, we hypothesised all of them to be highly segregated. The main findings confirm the hypothesis only for Tallinn. More specifically, the D value between top and bottom socio-economic groups is 31 in Riga and Vilnius, and 48 in Tallinn. Tallinn also witnessed the highest growth in socio-economic segregation among our case study cities in the 2000s, matching high social inequalities with high spatial inequalities, and becoming the most segregated East European city within the pool of our research cities. Neither in Riga nor in Vilnius has the combination of large social inequalities and a liberal society led to marked socio-economic divisions in urban space. Both Krišjāne et al. (2016) and Valatka et al. (2016) explain that gentrification has led to the increase of mixed neighbourhoods in the inner city of Vilnius similar to what has
22 Tiit Tammaru et al. happened in Budapest and Prague. Krisjane et al. further argue that the ethnic dimension is more important than the socio-economic dimension in generating segregation in Riga, where the Russian-speaking population forms more than half of the city’s population. Mixed neighbourhoods also characterised Tallinn in 2000. Tammaru et al. (2016) show that the residential relocation of higher socio-economic groups both to the inner city and outer city low-density areas is responsible for the increase in socio-economic segregation in the 2000s, replacing many earlier mixed neighbourhoods with more homogenous neighbourhoods. Thus it seems that gentrification processes have proceeded at a very rapid pace in Tallinn once the institutional transformations of the 1990s were completed. Privatisation in Tallinn was faster and the city is slightly wealthier compared to Riga and Vilnius (Tsenkova 2006), and less regulated and more unequal compared to Budapest and Prague. It remains to be seen whether other Baltic capitals that are as unequal but less segregated follow Tallinn.
Conclusions This introductory chapter has outlined the multi-factor approach for the study of socio-economic segregation in thirteen European political and economic capital cities. Based on a literature review, we distinguished four important structural factors that could help us understand levels of socio-economic segregation: degree of globalisation, level of social inequalities, welfare regimes and housing regimes. As socio-economic segregation is closely related to the occupational structure of cities, a fifth additional factor is the share of managers and professionals. Our main findings show that socio-economic segregation grew across Europe in the 2000s (with the exception of Amsterdam). This provides evidence for a shift from a city of social classes to a city of socio-spatial groups as suggested by Kesteloot (2005), especially when it comes to the residential separation between the top and low socio-economic groups who are increasingly isolated from each other in urban space. There is no simple correlation between the main contributory factors to segregation and the actual levels of segregation; the levels of social inequalities and the levels of socio-economic segregation do not necessarily match up (compare Madrid and Milan). A unitary housing system along with elaborate public policies, as is the case in Stockholm and Vienna, is not a sufficient precondition for low levels of socio-economic segregation. Marketisation of housing does not necessarily lead to high levels of segregation as the case of Oslo shows – if placed into an otherwise generous welfare context. The most common factor characterising highly segregated cities is the level of globalisation. In Western Europe, the most global city, London, is more segregated than Amsterdam and Vienna. In the South of Europe the more global cities of Madrid and Milan are more segregated than Athens despite the fact that social inequalities are much higher in Athens compared to Milan. The only distinct case is Tallinn, which is one of the least global but one of the most segregated cities in our pool of cities. All this leads to a clear message: universal structural factors, especially globalisation, are very important, but they also need to be combined with city-specific factors
Understanding socio-economic segregation 23 to fully understand the variations in the levels and patterns of socio-economic segregation in European capital cities. What follows in the rest of the book, therefore, is a detailed and context-sensitive analysis of each city, which, ultimately leads to a comprehensive synthetic account of our findings in the concluding chapter of the book.
Notes 1 We are very grateful to all the co-authors for their contribution to the book. Wouter Van Gent from the University of Amsterdam and Michael Gentile from the University of Helsinki provided invaluable comments to this introductory chapter. The research leading to the results presented in this chapter has received funding from the Estonian Research Council (Institutional Research Grant IUT no. 2–17 on Spatial Population Mobility and Geographical Changes in Urban Regions); European Research Council under the European Union’s Seventh Framework Programme (FP/2007-2013) / ERC Grant Agreement no. 615159 (ERC Consolidator Grant DEPRIVEDHOODS, Sociospatial Inequality, Deprived Neighbourhoods, and Neighbourhood Effects); and from the Marie Curie programme under the European Union’s Seventh Framework Programme (FP/2007-2013) / Career Integration Grant no. PCIG10-GA-2011-303728 (CIG Grant NBHCHOICE, Neighbourhood Choice, Neighbourhood Sorting, and Neighbourhood Effects). 2 We use the term East Europe for countries that used to be part of the state socialist, centrally planned bloc of countries for the five decades after World War II (Czech Republic, Estonia, Hungary, Latvia and Lihtuania in this book), and West Europe for the rest of Europe (Austria, Greece, Italy, Netherlands, Norway, Spain, Sweden, and the United Kingdom in this book). 3 We should also recognise that besides polarisation processes, spatial and social mismatch processes may also occur and contribute to inequality and segregation (Wilson 1987). Mismatches between jobs supplied and jobs demanded will create unemployment (over the past decades more in former local economies dominated by manufacturing industries, and less in service oriented economies). This produces cleavages between employed and unemployed that will eventually also be reflected in segregation between these categories. 4 Figures 1.1 through 1.3 are inspired by work from Maloutas 2012. 5 We first use the index of dissimilarity (Duncan and Duncan 1955), which is calculated as follows: l 1 n h D= ∑ i − i , 2 i =1 H T LT where n is the number of spatial units/neighbourhoods; hi is the number of members of one group (for example, highest socio-economic group) in neighbourhood i; HT is the total number of this group members in the city; li is the number of the other group (for example. lowest socio-economic group) in neighbourhood i; and LT is the total number of this group members in the city. 6 The index of segregation is a variant of the dissimilarity index and it is calculated as follows: n x t −x IS = ∑ i − i i , T −X X i =1 T
where n is the number of neighbourhoods; xi is the number of people in the given group (for example highest socio-economic group) living in neighbourhood i; XT is the total
24 Tiit Tammaru et al. number of this group in the city; ti is the number of all other groups’ members (for example. the rest of the workforce) in the neighbourhood i; and TT is the total number of them in the city. In other words, IS indicates how much the residential distribution of the given group, such as the highest socio-economic group, differs from residential distribution of the rest of the workforce across the neighbourhoods of a city. 7 The MII is calculated as follows: x x x MII = ∑ in=1 i × i − i x ti ti
x 1− T
where n is the number of neighbourhoods; xi is the number of people of a given group living in a neighbourhood i; X is the total number of people in this category; ti is the total number of people living in a given neighbourhood i; and T is the total number of people living in the city. The equation reduces to II when we remove the group size correction from the MII equation. 8 The LQ is calculated as follows: LQ = ( xi / ti ) / ( X / T ) , where xi is the number of people of a given socio-economic group in the neighbourhood i; ti is the total population of this neighbourhood i; X is the total number of the given socioeconomic group in the city, and is the total population T (workforce) of a city. If the ratio is 1, the share of the given group in the given neighbourhood is exactly the same as her city-wide average.
References Andersson, R and A Kährik 2016, ‘Widening gaps: Segregation dynamics during two decades of economic and institutional change in Stockholm’ in Socio-Economic Segregation in European Capital Cities. East meets West, eds T Tammaru, S Marcińczak, M van Ham and S Musterd, Routledge: London. Arbaci, S 2007, ‘Ethnic segregation, housing systems and welfare regimes in Europe’ International Journal of Housing Policy 7(4), 401–433. Beaverstock, J, Smith, R and Taylor, P 2015, Global City Network. http://www.lboro. ac.uk/gawc/ (last accessed 15 January 2015). Berry, B and Kasarda, J 1977, Contemporary Urban Ecology. Macmillan: New York. Bertaud, A and Renaud, B 1997, ‘Socialist cities without land markets’ Journal of Urban Economics 41(1), 137–151. Bodnár, J, and Böröcz, J 1998, ‘Housing advantages for the 1300 better connected? Institutional segmentation, settlement type, and social network effects in Hungary’s late state socialist housing nequalities’ Social Forces 76(4), 1275–1304. Booth, C 1887, ‘The inhabitants of Tower Hamlets (School Board Division), their condition and occupations’ Journal of the Royal Statistical Society 50(2), 326–401. Burgers, J and Musterd, S 2002, ‘Understanding urban inequality: A model based on existing theories and an empirical illustration’ International Journal of Urban and Regional Research 26(2), 403–413. Dangschat, J 1987, ‘Sociospatial disparities in a “socialist” city: The case of Warsaw at the end of the 1970s’ International Journal of Urban and Regional Research 11(1), 37–60. Deacon, B 2000, ‘Eastern European welfare states: The impact of the politics of globalisation’ Journal of European Social Policy 10(2), 146–161.
Understanding socio-economic segregation 25 Dewilde, C and Lancee, B 2013, ‘Income inequality and access to housing in Europe’ European Sociological Review 29(6), 1189–1200. Duncan, O and Duncan, B 1955, ‘Residential distribution and occupational stratification’ American Journal of Sociology 60(5), 493–503. Esping-Andersen, G 1990, The Three Worlds of Welfare Capitalism, Polity Press: Cambridge. European Commission 2010 Why Socio-economic Inequalities Increase? Facts and Policy Responses in Europe, Publication Office of the European Union: Luxembourg. Eurostat 2015, ‘Eurostat Electronic Database.’ Luxembourg: European Commission. http://ec.europa.eu/eurostat/data/database. Last accessed 7 May 2015. Fenger, H 2007, ‘Welfare regimes in central and Eastern Europe: Incorporating postcommunist countries in a welfare regime typology.’ http://journal.ciiss.net/index.php/ ciiss/article/viewPDFInterstitial/45/37 Last accessed 15 January 2015. Flowerdew, R, Manley, D and Sabel, C 2008, ‘Neighbourhood effects on health: Does it matter where you draw the boundaries?’ Social Science and Medicine 66(6), 1241–1245 Fotheringham, A and Wong, D 1991, ‘The modifiable areal unit problem in multivariate statistical analysis’ Environment and Planning A 23(7) 1025–1044. Gentile, M and Sjöberg, Ö 2013, ‘Housing allocation under socialism: The Soviet case revisited’ Post-Soviet Affairs 29(2), 173–195. Gentile M, Tammaru, T and Van Kempen, R 2012, ‘Heteropolitanization: Social and spatial change in Central and Eastern Europe’ Cities 29(5), 291–299. Hamnett, C 1994, ‘Social polarisation in global cities: Theory and evidence’ Urban Studies 31(3), 401–424. Hatz, G, Kohlbacher, J and Reeger, U 2016, ‘Socio-economic segregation in Vienna: A social-oriented approach to urban planning and housing’ in Socio-Economic Segregation in European Capital Cities. East meets West, eds T Tammaru, S Marcińczak, M van Ham and S Musterd, Routledge: London. Hirt, S 2103, ‘Whatever happened to the (post) socialist city? Cities 32(1), 29–38. Häussermann, H and Haila, A 2005, ‘The European city: A conceptual framework and normative project’ in Cities of Europe: Changing Contexts, Local Arrangements, and the Challenge to Urban Cohesion, ed. Y Kazepov, Blackwell Publishing: Oxford, pp. 43–64. Hegedüs, J 2013, ‘Housing privatisation and restitution’ in Social Housing in Transition Countries, eds J Hegedüs, N Teller and M Lux, Routledge: New York, pp. 33–49. Hochstenbach C, Musterd, S and Teernstra, A 2014, ‘Gentrification in Amsterdam: Assessing the importance of context’ Population, Space and Place. http://www.academia. edu/6873989/Gentrification_in_Amsterdam_assessing_the_importance_of_context_2014_with_S_Musterd_and_A_Teernstra_published_in_Population_Space_and_ Place. Last accessed 16 April 2015. ILO 2007, Updating the International Standard Classification of Occupations (ISCO). International Labour Organization: Geneva. ILO 2012, International Standard Classification of Occupations. International Labour Organization: Geneva. ILO 2015, International Labour Organization Webpage. http://www.ilo.org/global/lang–en/ index.htm. Last accessed 15 January 2015. Janson, C-G 1980, ‘Factorial social ecology: An attempt at summary and evaluation’ Annual Review of Sociology 6, 433–456. Jones, C and Murie, A 2006, The Right to Buy. Blackwell Publishing: Oxford.
26 Tiit Tammaru et al. Kährik, A and Tammaru, T 2010, ‘Soviet prefabricated panel housing estates: Areas of continued social mix or decline? The case of Tallinn’ Housing Studies 25(2), 201–219. Kazepov, J 2005, ‘Introduction’, in Cities of Europe: Changing Contexts, Local Arrangements, and the Challenge to Social Cohesion, ed. Y Kazepov, Blackwell Publishing: Oxford, pp. 3–42. Kemeny, J 1995 From Public Housing to the Social Market: Rental Policy Strategies in Comparative Perspective, London: Routledge. Kesteloot, C 2005, ‘Urban socio-spatial configurations and the future of European cities’ in Cities of Europe: Changing Contexts, Local Arrangements, and the Challenge to Urban Cohesion, ed. Y. Kazepov, Blackwell Publishing: Oxford, pp 123–148. Kish, L 1954, ‘Differentiation in metropolitan areas’ American Sociological Review 19(4), 388–398. Kleinhans R and van Ham M 2013, ‘Lessons learned from the largest tenure mix operation in the world: Right to buy in the United Kingdom’ Cityscape: A Journal of Policy Development and Research 15(2), 101–118. Kornai, J 1992, The Socialist System: The Political Economy of Communism, Princeton University Press: Princeton: NJ. Kovács, Z 2009, ‘Social and economic transformation of the historical neighbourhoods in Budapest’ Tijdschrift voor Economische en Sociale Geografie 100(4), 399–416. Kovács, Z and Herfert, G 2012, Development pathways of large housing estates in postsocialist cities: An international comparison Housing Studies 27(3), 324–342. Kovács, Z and Szabó, B 2016, ‘Urban restructuring and changing patterns of socioeconomic segregation in Budapest’ in Socio-Economic Segregation in European Capital Cities: East Meets West, eds T Tammaru, S Marcińczak, M van Ham and S Musterd, Routledge: London Krišjāne, Z Bērziņš, M and Kratovitš, K 2016, ‘Occupation and ethnicity: Patterns of residential segregation in Riga two decades after socialism’ in Socio-Economic Segregation in European Capital Cities: East Meets West, eds T Tammaru, S Marcińczak, M van Ham and S Musterd, Routledge: London. Ladányi J 1989, ‘Changing patterns of residential segregation in Budapest’ International Journal of Urban and Regional Research 13, 555–572. Leal, J and Sorando D 2016, ‘Economic crisis, social change and segregation processes in Madrid’ in Socio-Economic Segregation in European Capital Cities: East Meets West, eds T Tammaru, S Marcińczak, M van Ham and S Musterd, Routledge: London. Malmberg, B, Andersson, E, and Östh, J 2013, ‘Segregation and urban unrest in Sweden’ Urban Geography 34(7), 1031–1046. Maloutas, T 2012, ‘Introduction’, in Residential Segregation in Comparative Perspective. Making Sense of Contextual Diversity, eds T Maloutas and K Fujita, City and Society Series, Ashgate: Farnham, UK, pp. 1–36. Maloutas, T 2016, ‘Socioeconomic segregation in Athens at the beginning of the 21st century’ in Socio-Economic Segregation in European Capital Cities: East Meets West, eds T Tammaru, S Marcińczak, M van Ham and S Musterd, Routledge: London. Manley, D and Johnston, R 2001, ‘London: A dividing city, 2001–11?’ City 18(6), 633–643. Manley, D, van Ham M, Bailey N, Simpson L and Maclennan D eds 2013, Neighbourhood Effects or Neighbourhood Based Problems? A Policy Context, Springer: Dordrecht. Manley, D, Johnston, R, Jones, K and Owen, D 2016, ‘Occupational segregation in London: A multilevel framework for modelling segregation’ in Socio-Economic Segregation in European Capital Cities. East meets West, eds T Tammaru, S Marcińczak, M van Ham and S Musterd, Routledge: London.
Understanding socio-economic segregation 27 Marcińczak, S, Gentile, M, Rufat, S and Chelcea, L 2014, ‘Urban geographies of hesitant transition: Tracing socio-economic segregation in post-Ceausescu Bucharest’ Inter national Journal of Urban and Regional Research 38(4), 1399–1417. Marcińczak, S, Gentile, M and Stępniak, M 2013, ‘Paradoxes of (post) socialist segregation: Metropolitan sociospatial divisions under socialism and after in Poland’ Urban Geography 34(3), 327–352. Marcińczak, S, Musterd, S, van Ham, M and Tammaru, T 2016, ‘Inequality and rising levels of socio-economic segregation: Lessons from a pan-European comparative study’ in Socio-Economic Segregation in European Capital Cities: East Meets West, eds T Tammaru, S Marcińczak, M van Ham and S Musterd, Routledge: London. Marcińczak, S, Tammaru, T, Novák, J, Gentile, M, Kovács, Z, Temelová, J, Valatka, V, Kährik, A and Szabó, B 2015, ‘Patterns of socioeconomic segregation in the capital cities of fast-track reforming postsocialist countries’ Annals of the American Association of Geographers 105(1), 183–202. Marcuse, P and Van Kempen, R 2000, ‘Introduction’ in Globalizing Cities: A New Spatial Order?, eds P Marcuse and R Van Kempen, Blackwell Publishing: Oxford, pp. 1–21. Massey, D and Denton, N 1988, ‘The dimensions of residential segregation’ Social Forces 67(2), 281–315. Massey, D and Denton, N 1993, American Apartheid: Segregation and the Making of the Underclass, Harvard University Press: Cambridge, MA. Mollenkopf, J H and Castells, M eds 1991, Dual City: Restructuring New York. Russell Sage Foundation: New York. Morgan, B 1975, ‘The segregation of socio-economic groups in urban areas: A comparative analysis’ Urban Studies 12(1), 47–60. Morgan, B 1980, ‘Occupational segregation in metropolitan areas in the United States, 1970’ Urban Studies 17(1), 63–69. Musil, J 1987, ‘Housing policy and the socio-spatial structure of cities in a socialist country: The example of Prague’ International Journal of Urban and Regional Research 11(1), 27–36. Musterd, S 2005, ‘Social and ethnic segregation in Europe: Levels, causes and effects’ Journal of Urban Affairs 27(3), 331–348. Musterd, S and Kovács, Z 2013, Place-making and Policies for Competitive Cities, Wiley-Blackwell: Oxford. Musterd, S and W Ostendorf eds 1998, Urban Segregation and the Welfare State: Inequality and Exclusion in Western Cities, Routledge: London. Musterd, S and van Gent, W 2016, ‘Changing welfare context and income segregation in Amsterdam and its metropolitan area’ in Socio-Economic Segregation in European Capital Cities: East Meets West, eds T Tammaru, S Marcińczak, M van Ham and S Musterd, Routledge: London. Ouředníček, M, Pospíšilová, L, Špačková, P, Kopecká, Z and Novák, J 2016, ‘The velvet and mild: Socio-spatial differentiation in Prague after transition’ in Socio-Economic Segregation in European Capital Cities: East Meets West, eds T Tammaru, S Marcińczak, M van Ham and S Musterd, Routledge: London. Park, E, Burgess, E and McKenzie, R 1925, The City: Suggestions for Investigation of Human Behavior in the Urban Environment, University of Chicago Press: Chicago. Peach, C 2009, ‘Slippery segregation: Discovering or manufacturing ghettos?’ Journal of Ethnic and Migration Studies 35(9), 1381–1395. Petsimeris, P and Rimoldi S 2016, ‘Socio-economic divisions of space in Milan in the post-Fordist era’ in Socio-Economic Segregation in European Capital Cities: East
28 Tiit Tammaru et al. Meets West, eds T Tammaru, S Marcińczak, M van Ham and S Musterd, Routledge: London. Piketty, T 2013, Capital in the Twenty-First Century, Harvard University Press: Cambridge, MA. Préteceille, E 2000, ‘Segregation, class and politics in large cities’ in Cities in Contemporary Europe, eds A Bagnasco and P Le Gales, Cambridge University Press: Cambridge, pp. 74–97. Reardon, S and Bischoff, K 2011, ‘Income inequality and income segregation’ American Journal of Sociology 116(4), 1092–1153. Rex, J and Moore R 1967, Race, Community and Conflict, Oxford University Press: Oxford. Sachs, S 2012, The Price of Civilization: Reawakening Virtue and Prosperity after the Economic Fall, Vintage: London. Sassen, S 1991, The Global City: New York, London, Tokyo, Princeton University Press: Princeton, NJ. Sennnett, R 2003, Respect in a World of Inequality, WW Norton and Company: New York. Słomczyński, K and Shabad G 1996, ‘Systemic transformation and the salience of class structure in East-Central Europe’ East European Politics and Societies 11(1), 155–189. Smith, D 1996, ‘The socialist city’ in Cities after Transition, eds G Andrusz, M Harloe, and I Szelenyi, Blackwell: Oxford, pp. 70–99. Smith, A and Timár, J 2010, ‘Uneven transformations: Space, economy and society 20 years after the collapse of state socialism’ European Urban and Regional Studies 17(2), 115–125. Stanilov, K ed. 2007, The Post-Socialist City: Urban Form and Space Transformations in Central and Eastern Europe after Socialism, Springer: Dordrecht. Sýkora, L 2009, ‘Post-socialist cities’ in International Encyclopedia of Human Geography eds R Kitchin and N Thrift, Elsevier: Oxford, pp. 387–395. Sýkora, L and Bouzarovski, S 2012, ‘Multiple transformations: Conceptualising the postcommunist urban transition’ Urban Studies 49(1), 43–60. Szelényi, I 1996, ‘Cities under socialism – and after’ in Cities after Socialism: Urban and Regional Change and Conflict in Post-Socialist Societies, eds G Andrusz, M Harloe and I Szelényi, Blackwell Publishers: Oxford, pp. 286–317. Sztompka, P 1996, ‘Looking back: The year 1989 as a cultural and civilizational break’ Communist and Post-Communist Studies 29(2), 115–129. Tammaru, T 2001, ‘Suburban growth and suburbanisation under central planning: The case of Soviet Estonia’ Urban Studies 38(8), 1341–1357. Tammaru, T, Kährik, A, Mägi, K Novák, J and Leetmaa, K 2016, ‘The “market experiment”: Increasing socio-economic segregation in the inherited bi-ethnic context of Tallinn’ in Socio-Economic Segregation in European Capital Cities: East Meets West, eds T Tammaru, S Marcińczak, M van Ham and S Musterd, Routledge: London. Tsenkova, S and Nedović-Budić, Z eds 2006, The Urban Mosaic of Post-Socialist Cities, Physica-Verlag Heidelberg: New York, pp. 21–50. Tsenkova, S 2006, ‘Beyond transitions: Understanding urban change in post-socialist cities’ in The Urban Mosaic of Post-Socialist Cities, eds. S Tsenkova and Z Nedović-Budić, Physica-Verlag Heidelberg: New York, pp. 21–50. Turkington, R, van Kempen, R and Wassenberg, F eds 2004, High-Rise Housing in Europe: Current Trends and Future Prospects. Housing and Urban Policy Studies, Delft University Press: Delft. Valatka, V, Burneika, D and Ubarevičienė R, 2016, ‘Large social inequalities and low levels of socio-economic segregation in Vilnius’ in Socio-Economic Segregation in
Understanding socio-economic segregation 29 European Capital Cities: East Meets West, eds T Tammaru, S Marcińczak, M van Ham and S Musterd, Routledge: London. van Ham, M and Manley, D 2009, ‘Social housing allocation, choice and neighbourhood ethnic mix in England’ Journal of Housing and the Built Environment 24, 407–422. van Ham, M and Manley, D 2012, ‘Neighbourhood effects research at a crossroads: Ten challenges for future research’ Environment and Planning A 44(12), 2787–2793. van Kempen, R, and Murie, A 2009, ‘The new divided city: Changing patterns in European Cities’ Tijdschrift voor Economische en Sociale Geografie 100(4), 377–398. Verdery, K 1996, What Was Socialism and What Comes Next? Cambridge University Press: Cambridge. Węcławowicz, G 1979, ‘The structure of socio-economic space in Warsaw in 1931 and 1970: A study in factorial ecology’ in The Socialist City: Spatial Structure and Urban Policy, eds R French and F Hamilton, John Willey and Sons: Chichester, pp. 387–424. Wessel, T 2016, ‘Economic segregation in Oslo: polarisation as a contingent outcome’ in Socio-Economic Segregation in European Capital Cities. East meets West, eds T Tammaru, S Marcińczak, M van Ham and S Musterd, Routledge: London. Wilson, W J 1987, The Truly Disadvantaged: The Inner City, the Underclass, and Public Policy, University of Chicago Press: Chicago. Wolpert, J 1965, ‘Behavioral aspects of the decision to migrate’ Papers in Regional Science 15(1), 159–169. Wong, D 2003, ‘Spatial decomposition of segregation indices: A framework toward measuring segregation at multiple levels’ Geographical Analysis 35(3), 179–194.