Data mining using Decision Tree Classifier has emerged as one of the major research ... capital by compromising on other necessary expenditures, and when it is still insufficient they resort to ... is the process of determining the soil types or.
SOIL DATA MINING USING DECISION TREE CLASSIFIER Soumadip Ghosh1, Susanta Biswas2, Debasree Sarkar2, Partha Pratim Sarkar2 Dept. of CSE, Academy of Technology, Aedconagar, Hooghly, Pin-712121, WB, India. 2 DETS, University of Kalyani, Nadia, Pin-741235, WB, India.
1
Abstract: Databases are enriched with hidden information that can be used for intelligent decision making. Classification is an important data mining technique that can be used to discover models describing different data classes. Such analysis can help provide us with a better understanding of the datasets at large. The problem of knowledge acquisition and efficient knowledge exploitation is also very popular in agricultural field. Data mining with Agricultural soil datasets is a relatively novel research field. In agricultural decision making process, weather conditions and soil characteristics play a major role. Efficient data mining techniques can be developed and applied to complex soil datasets to establish if meaningful relationships can be found. Soil Data mining using Decision Tree Classifier has emerged as one of the major research domain in the recent decades in order to extract implicit and useful knowledge from existing agricultural databases.
Keywords: Data Mining, Classification, Soil Database, Decision Tree. 1. INTRODUCTION Data mining consists of the extraction of interesting novel knowledge from real-world databases. The software applications related with data mining includes various methodologies that have been developed by both commercial and research centers. These techniques have been used for industrial, commercial and scientific purposes [1]. For example, data mining has been used to analyze large datasets and establish useful classification and patterns in the datasets. Agricultural and biological research studies have used various techniques of data analysis including, natural trees, statistical machine learning and other analysis methods [7]. This paper outlines research which may establish if new data mining techniques will improve the effectiveness and accuracy of the Classification of large soil datasets. In particularly, this research work aims to compare the performance of the data mining algorithms with soil limitations and soil conditions in respect of the following characteristics: Acidity, Alkalinity and solidity, Salinity, Low caution exchange capacity, Phosphorus fixation, Cracking and swelling
properties, Depth, Soil density and Nutrient content. The use of standard statistical analysis techniques is both time consuming and expensive. If alternative techniques can be found to improve this process, an improvement in the classification of soils may result. Agriculture or farming forms the backbone of any country economy, since a large population lives in rural areas and is directly or indirectly dependent on agriculture for a living. Income from farming forms the main source for the farming community. The essential requirements for crop harvesting are water resources and capital to buy seeds, fertilizers, pesticides, labour etc. Most farmers raise the required capital by compromising on other necessary expenditures, and when it is still insufficient they resort to credit from sources like banks and private financial organizations. In such a situation, the repayment is dependent on the success of the crop. If the crop fails even once due to several factors, like bad weather pattern; soil type; improper, excessive, and untimely application of both fertilizers and pesticides; adulterated seeds and pesticides etc., then the farmer is pushed into an acute crisis causing
Computer Science and Engineering Research Journal severe stress [8]. In addition, the plant growth depends on multiple factors such as soil type, crop type, and weather. Due to lack of plant growth information and expert advice, most of the farmers fail to get a good yield. Most knowledge of soil in nature comes from soil survey efforts. Soil survey, or soil mapping, is the process of determining the soil types or other properties of the soil cover over a landscape, and mapping them for others to understand and use [6]. Primary data for the soil survey are acquired by field sampling and supported by remote sensing. In this paper the decision tree analysis method has been used in the prediction of natural datasets in agriculture and is found to be useful in prediction of soil depth for a dataset. The use of slope angle, elevation, temperature and other factors are analyzed and models created for prediction of soil depth across a sample area.
2. RELATED WORK Soil data mining is a field in data mining that has received a lot of attention in recent years. A number of studies have been carried out on the application of data mining techniques for agricultural data sets. For example, a study by Ibrahim (1999) on a sample data set applied six classification algorithms to 59 data sets and then six clustering algorithms were subsequently applied to the data generated. The results were studied and the patterns and properties of the clusters were formed to provide a basis for the research. The research provided a comparison of performance for the 6 classification algorithms set to their default parameter settings. The study utilized the WEKA data mining benchmark program. The main objectives of the research conducted by Ibrahim was to apply unsupervised clustering to the file built to analyze the generated clusters and determine whether there are any significant patterns. The research conducted by Ibrahim has provided a platform from which further work in this field might be undertaken. The scope of the research was limited and the investigation revealed a number of interesting clusters in machine learning performance data. It can be concluded that a larger investigation is required which uses more data sets and data set characteristics [3, 6]. In another study WEKA was used to develop a classification system for the sorting and grading
of mushrooms. The system developed a classification system that could sort mushrooms into grades and attained a level of accuracy equal to or greater than the human inspectors. The process involved the pre-processing of the data, not just cleaning the data, but also creating a test dataset in conjunction with agricultural researchers. The attributes used to create the set included both objective and subjective measurement. The total dataset used a total of 282 mushroom types, criteria and attributes. The objective attributes were weight, firmness and percentage of cap opening. The subjective attributes were used to estimate the degree of dirt, stalk damage brushing, shrivel and bacterial blotch. The above data was collected and then compared with the grading of the three human inspectors and allocated a grade 1st, 2nd or 3rd. The data, a total of 68 attributes including photo images, was used by the J4.8 algorithm classifier within WEKA to create a model for the human inspectors and the automated system. The model created using the human rules showed that each inspector used different combinations of attributes when assigning grades to Mushrooms. The application of data mining techniques provided within the WEKA software application created a model that analyzed all attributes and created a model that was faster and more accurate than the human system [5].
3. CLASSIFICATION Classification is the process of finding a model that describes and distinguishes data classes or concepts, for the purpose of being able to use the model to predict the class of objects whose class label is unknown. The derived model is based on the analysis of a set of training data. The derived model may be represented in various forms, such as classification rules, decision trees, mathematical formulae, or neural networks. Basically data classification is a twostep process, in the first step; a classifier is built describing a predetermined set of data classes or concepts. This is the learning step (or training phase), where a classification algorithm builds the classifier by analyzing or “learning from” a training set made up of database tuples and their associated class labels. A tuple, X, is represented by an n-dimensional attribute vector, X = (x1, x2, ……… , xn), depicting n measurements made on the tuple from n database attributes, respectively, A1, A2, …, An. Each tuple, X, is
Computer Science and Engineering Research Journal assumed to belong to a predefined class as determined by another database attribute called the class label attribute. The class label attribute is discrete-valued and unordered. It is categorical in that each value serves as a category or class. The individual tuples making up the training set are referred to as training tuples and are selected from the database under analysis. In the context of classification, data tuples can be referred to as samples, examples, instances, data points, or objects. Because the class label of each training tuple is provided, this step is also known as supervised learning [2, 10]. In the second step the model is used for classification. First, the predictive accuracy of the classifier is estimated. If we were to use the training set to measure the accuracy of the classifier, this estimate would likely be optimistic, because the classifier tends to over fit the data. Therefore, a test set is used, made up of test tuples and their associated class labels. These tuples are randomly selected from the general data set. They are independent of the training tuples, meaning that they are not used to construct the classifier. The accuracy of a classifier on a given test set is the percentage of test set tuples that are correctly classified by the classifier. The associated class label of each test tuple is compared with the learned classifier’s class prediction for that tuple. If the accuracy of the classifier is considered acceptable, the classifier can be used to classify future data tuples for which the class label is not known [2].
would suggest that one of the two could be removed from further analysis. A database may also contain irrelevant attributes. Attribute subset selection4 can be used in these cases to find a reduced set of attributes such that the resulting probability distribution of the data classes is as close as possible to the original distribution obtained using all attributes. Data transformation and reduction: The data may be transformed by normalization, particularly when neural networks or methods involving distance measurements are used in the learning step. Normalization involves scaling all values for a given attribute so that they fall within a small specified range, such as -1.0 to 1.0, or 0.0 to 1.0. 4. DECISION TREE CLASSIFIER A decision tree is a flowchart-like tree structure, where each internal node (non-leaf node) denotes a test on an attribute, each branch represents an outcome of the test, and each leaf node (or terminal node) holds a class label. The topmost node in a tree is the root node. Decision tree can easily be converted to classification rules. Decision tree induction is the learning of decision trees from class-labeled training tuples. The figure below shows a sample decision tree with two class labels— ‘P’ and ‘N’ respectively.
The following pre-processing steps may be applied to the data to help improve the accuracy, efficiency, and scalability of the classification or prediction process— Data cleaning: This refers to the preprocessing of data in order to remove or reduce noise (by applying smoothing techniques, for example) and the treatment of missing values (e.g., by replacing a missing value with the most commonly occurring value for that attribute, or with the most probable value based on statistics). Relevance analysis: Many of the attributes in the data may be redundant. Correlation analysis can be used to identify whether any two given attributes are statistically related. For example, a strong correlation between attributes A1 and A2
Fig. 1 A sample decision tree During tree construction, attribute selection measures are used to select the attribute that best partitions the tuples into distinct classes. Popular measures of attribute selection are information gain, gain ratio, and gini index. When decision trees are built, many of the branches may reflect noise or outliers in the training data. Tree pruning attempts to identify
Computer Science and Engineering Research Journal and remove such branches, with the goal of improving classification accuracy on unseen data. Well-known algorithms for decision tree induction like ID3, C4.5, and CART adopt a greedy (i.e., non-backtracking) approach in which decision trees are constructed in a topdown recursive divide-and-conquer manner [4]. Most algorithms for decision tree induction also follow such a top-down approach, which starts with a training set of tuples and their associated class labels. The training set is recursively partitioned into smaller subsets as the tree is being built.
5. METHODOLOGY Of soil characteristics, soil classification is the most important one. It influences many other properties of great significance to land use and management. The Soil texture is an important property for agriculture soil classification. It influences fertility, drainage, water holding capacity, aeration, tillage, and strength of soils. A set of soil properties are diagnostic for differentiation of various components. The differentiating characters are the soil properties that can be observed in the field or measured in the laboratory or can be inferred in the field. Some diagnostic soil horizons, both surface and sub- surfaces, soil moisture regimes, soil temperature regimes and physical, physiochemical and chemical properties of soils determined were used as criteria for classifying soils. The soils of various regions are classified into different orders, sub-orders, great groups, sub-groups, families and finally into series as per USDA Soil Taxonomy [9]. The texture of the surface varied from sand to silty clay loam where as in sub-surface horizons it varied from sand to clay [7, 11]. The solid phase of soil can be divided into mineral matter and organic matter. The mineral particles can be further subdivided into classes based on size. The classification of soil particles according to size are Sand, Silt, Clay. The proposition of Sand, Silt, and Clay present in soil determines its texture. In this paper Soil data consists of attributes like (i.e., Depth, Sand, Silt, Clay, Sandbysilt, Sandbyclay, Sandbysiltclay, and TextureClass). The texture of the Soil data is varied from sand to silty clay loam where as in sub-surface horizons it varied from sand to clay.
Table 1 below shows the different soil survey symbols. Table 1 Soil survey symbols. S Sicl Sic C Sl Cl Sil L Ls Scl Sc
Sand Silty Clay Loam Silty Clay Clay Sandy Loam Clay Loam Silty Loam Loam Loamy Sand Sand Clay Loam Sand Clay
In our work, C4.5 Decision Tree classifier is applied on normalized datasets to discover the class-labels. We first collected agricultural database and then made a decision tree classifier using gain ratio as the attribute selection measure. For a given tuple from the dataset for which the associated class label is unknown, the attribute values of the tuple are tested against the decision tree. A path is traced from the root to a leaf node, which holds the class prediction for that tuple.
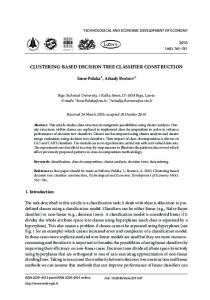
6. RESULTS We investigate the role of different soil profiles using the UNSODA soil database [12]. The database consists of 791 soil samples with water retention, saturated and unsaturated hydraulic conductivity data measured in the field or laboratory, as well as particle size distribution and bulk density data. We used a subset of 235 laboratory samples and the classification in four textural groups.
Fig. 2 Textural distribution of the 235 samples and the classification in four textural groups
Computer Science and Engineering Research Journal The proposed technique was implemented on the different soil datasets with satisfactory results. For example, when we tested our proposed method on huge dataset of 791 soil samples we also achieved success in terms of soil classification which surely proves the effectiveness of the proposed method.
7. CONCLUSION This paper discusses on how decision tree algorithm can be applied to soil database to generate the best decision tree. Applying C4.5 algorithm helps one to classify soil texture based on soil properties effectively, which influences fertility, drainage, water holding capacity, aeration, tillage, and bearing strength of soils and also helps in knowing the accuracy of a decision tree along with accurate rules. We can say that the average accuracy gets improved for bigger decision trees with more number of nodes than a smaller decision tree with less number of nodes. Further we can conclude that the C4.5 algorithm was applied on smaller soil data set to classify soil texture. In the future we can try applying CART algorithm on bigger population size for soil data set and can be tried to check whether we get accurate results to classify soil texture and whether more accurate rules can be generated than the previous classification algorithm.
REFERENCES 1. Fayyad, U.M., Piattetsky-Shapiro, G., and Smyth, P., “From data mining to knowledge discovery: an overview Advances in Knowledge Discovery and Data”, 1996. 2. Han J., Kamber M., “Data Mining: Concepts & Techniques”, Morgan & Kaufmann, 2000. 3. Leisa J. Armstrong, Dean Diepeveen, Rowan Maddern, “The application of data mining techniques to characterize agricultural soil profile”, School of Computer and Information Sciences, Edith Cowan University, Bradford Street, Mt Lawley 6050, Western Australia. Department of Agriculture and Food, Western Australia, BaronHay Court South Perth, 6151 Western Australia, 2007.
4. Breiman, L., J.H. Freidman, R.A. Olshen and C.J. Stone, “Classification and Regression Trees”, Belmont, Wadsworth, 1984. 5. Mining, 1-34. AAAI/MIT Press. P.Bhargavi and Dr.S.Jyothi,”Applying Naive Bayes Data Mining Technique for Classification of Agricultural Land Soils”, Madanapalli Institue of Tecnology and Science,Madanapalli, Sri Padmavathi Mahila Viswa Vidyalayam,Tirupati, 2009. 6. V. Ramesh and K. Ramar, “Classification of Agricultural Land Soils: A Data Mining Approach”, Agricultural Journal 6(3): pp. 82-86, ISSN: 1816-9155, 2011. 7. Cunningham S. J and Holmes G., “Developing innovative applications in agriculture using data mining”, In the Proceedings of the Southeast Asia regional Computer Confederation Conference, 1999. 8. Sudarshan Reddy S, Vedantha S, Venkateshwar Rao B, Sundar Ram Reddy and Venkat Reddy, “Gathering Agrarian Crisis Farmers Suicides in Warangal district”, Citizens Report, 1998. 9. Soil Survey Staff, “Keys to soil taxonomy”, Eight Edition, Natural Resource Conservation Services, USDA, Blacksburg, Virginia, 1998. 10. Pujari A.K., “Data Mining Techniques”, Universities Press, 2001. 11. Tripathi S, Srinivas VV, Nanjudiah RS) “Downscaling of precipitation for climate change scenarios : a support vector machine approach”, J. Hydrol 330 : pp. 621 – 640, 2006. 12. Database URL: http://soildatamart.nrcs.usda.gov/