Mapping Monthly Average Global Solar Radiation over Iraq Using GIS .... z as a function of both lag distance or separation distance (h); N(h) is the number.
ISSN 2277-3061 Volume 15 Number 05 INTERNATIONAL JOURNAL OF COMPUTERS & TECHNOLOGY
Mapping Monthly Average Global Solar Radiation over Iraq Using GIS and Heliosat Model Hussain Z. Ali 1, Ali. M. AL-Salihi2, Ahmed. K. AL-Abodee2 1
2
Ministry of Sciences and Technology Department of Atmospheric Science, Collage of Science, AL-Mustansiriyah University
Abstract The mapping of global solar radiation is important in designing of solar energy system and renewable energy applications, also the global solar radiation estimation and mapping will facilitate engineers and architect purposes and applications. In present paper measured and estimated global solar radiation data was employed. The estimation of global radiation data can give results with acceptable accuracy to establish solar maps of monthly radiation using Geographic Information Systems (GIS) software. Simple Kriging interpolation was used to derive radiation maps over Iraq. Different models were employed, namely Spherical, Circular, and Gaussian. Solar radiation data for the years 1985,1990,1995,2000 and 2005 were used for the production of solar radiation maps over Iraq. On average, Iraq 2 receives (5000) kWh/m of global solar radiation in year 2005. The highest global solar radiation is estimated at 2 2 6790kWh/m in September while the lowest is 1660 kWh/m in December. Cross validation was used to find the best model by comparing the error criteria, namely MPE, RMS, MSPE, RMSS, and ASE. It was found the Spherical model gives best results according to the cross validation error criteria.
Keywords renewable energy, solar radiation; GIS; Simple kriging; Iraq; Geostatistics.
1. Introduction Energy is one of the most important factors for economic growth and human development. The sustainability of future energy systems is critical for sustainable development. Renewable energy is a key element for any sustainable solution. One of the first steps for the exploitation of any energy source is its estimation and mapping to identify the most suitable areas in terms of energy potential. To understand the current trend of the renewable energy, it is important to analyze the spatial variation of resources and their deployment. Every second, the Sun transforms about 4 million tons of its mass into 11 energy. For the earth, this enormous quantity represents an energy focus of 1.779×10 MW that is directly or indirectly used by the biosphere. Studying the solar radiation that reaches the Earth surface is very interesting in ecological and economic terms, since the Sun provides 99.8% of the energy used for all natural processes. In the field of Earth sciences, mapping solar radiation is important for two reasons. Firstly, it is a climatic factor that can be used when modelling and mapping climatic elements such as air temperature, evapotranspiration or snow cover. Secondly, it is a variable that directly influences biological processes such as photoperiods (flowering and growing seasons, etc.) or biochemical reactions [1]. Solar radiation is one of the important fields of scientific research in renewable energy uses. Daily solar radiation reaching earth surface is very important for different applications of solar energy including assessment for heating and electricity generation, solar system design, and agriculture meteorology [2]. Solar radiation measurements in our country are not easily available because of not being able to afford the measuring equipments and techniques involved, in order to overcome this shortage of solar radiation measurements. Many researchers developed models to estimate the values of solar radiation reaching the earth surface by employing different relations such as linear, multi linear, fourth order and polynomial for different location in Iraq and surrounding country [3]. On other hand, researchers of the neighboring countries such as turkey, Syria, Jordan, Saudi Arabia, Iran investigated empirical and statistical models [4]. Heliosat method was developed to generate solar radiation data from Meteosat-8 images. The main procedure of Heliosat is that the solar radiation for an area is statistically calculated using cloud cover and the albedo of the same area. In present paper monthly average of daily solar radiation were employed in order to create solar radiation maps over Iraq using Kriging interpolation technique, estimating variable at an unmeasured location from observed values at nearer locations [5].
2. Materials and Methods Heliosat method The Heliosat-2 method is described in details by many authors [6]. The summery of Heliosat-2 can be explained by the following steps; recording the ground albedo maps for each month, computing the cloud index, calculating the clear sky index, and finally estimating the daily global solar radiation. The monthly t albedo (p ) maps obtain from the daily albedo values is calculated for each pixel of Meteosat-8 images (pg) the cloud index is standard measure of cloud cover and can be computed as follows:
p r t (i , j ) p gt (i , j ) n i , j t p cloud (i , j ) p gt (i , j ) t
6724 | P a g e March 2016
(1)
council for Innovative Research www.cirworld.com
ISSN 2277-3061 Volume 15 Number 05 INTERNATIONAL JOURNAL OF COMPUTERS & TECHNOLOGY Where
n t i , j
clouds and
is the cloud index for the time (t ) , pixel
(i , j ) , p t cloud (i , j ) is the apparent albedo of the brightest
p r t (i , j ) is the reflectance.
Clear sky index
K ch
is calculated according to different levels of cloud index:
K ch 1.2
if n t 0.2
K ch 1 n
if 0.2 n t 0.8
K ch 2.0667 3.6667n t 1.667
if 0.8 n t 11
The global solar radiation (Gd) is computed as follows:
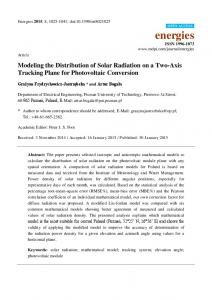
Gd k chGch Where Gch is the clear sky global solar radiation and can be calculated through ESRA clear sky model [7]. Figure (1) summarizes the methods and techniques applied in this paper for spatial prediction and comparative evaluation of the used models.
Figure (1): The block diagram representing the methodology adopted in present paper.
Geostatistics Geostatistics is study of phenomena that vary in space and time. Geostatistics can be regarded as a collection of numerical techniques that deal with the characterization of spatial attributes. Employing primarily random models in a manner similar to the way in which time series analysis characterizes temporal data. Geostatistics offers a way of describing the spatial continuity of natural phenomena and provides adaptations of classical regression techniques to take advantage of this continuity [8]. The first step in kriging is to calculate the experimental semivariogram using the following equation [9]: 6725 | P a g e March 2016
council for Innovative Research www.cirworld.com
ISSN 2277-3061 Volume 15 Number 05 INTERNATIONAL JOURNAL OF COMPUTERS & TECHNOLOGY
1 N (h ) (h ) z x k z x k h 2N (h ) k 1
2
(2)
Where γ(h) is the semi-variance of variable z as a function of both lag distance or separation distance (h); N(h) is the number of observation pairs of points separated by (h) used in each summation; and z(xk) is the random variable at location xk. The most commonly used variogram model is spherical [10]:
Spherical model The spherical function is one of the most frequently used models in geostatistics .The spherical model is good choice when the nugget variance is important but not too large, and there is a clear range and sill.
h (h ) C o C 1.5 Ao
3 h 0.5 for h Ao Ao
(3)
Where: γ(h) = semivariance for interval distance class h; h = the separation distance interval C0 = nugget variance ≥ 0 C = structural variance ≥ C0, A0= range parameter. The selection of the best-fit semi-variogram model was based on the five error statistics of leave one out cross-validation: the mean prediction error (MPE), the root mean square prediction error (RMSPE), the average kriging standard error (AKSE), the mean standardized prediction error (MSPE), the root mean square standardized prediction error (RMSSPE), as follows:
1 MPE N
z k 1
MSPE
z k 1
ok
(4)
z pk
2
(5)
N
1 N 1 N
ok
N
1 RMSPE N AKSE
z pk
N
k k 1
N
z
k 1
1 RMSSPE N
ok
z pk
k
(6)
z ok z pk k k 1
(7) 2
N
(8)
Where zok is the observed value at location k, zpk is the predicted value at k through the ordinary kriging method, N is the number of pairs of observed and predicted values, and σ (k) is the prediction standard error for location k. As an indicator of prediction errors, the MPE and MSPE values reveal the degree of bias in model predictions and should be close to zero. In the assessment of uncertainty (variability in predictions), the RMSPE and AKSE values show the precision of prediction and should be equal to one another. Overestimation and underestimation of variability in predictions occur when the AKSE > and < the RMSPE, respectively. [11].
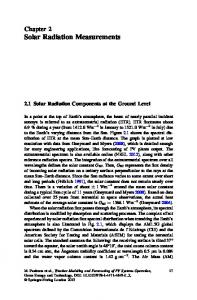
3. Results and Discussion Maps of global solar radiation are very useful especially in design of solar energy system as well as interior illumination of a building. Figure 2 shows the yearly average daily global solar radiation map of Iraq, for the year 2005.
6726 | P a g e March 2016
council for Innovative Research www.cirworld.com
ISSN 2277-3061 Volume 15 Number 05 INTERNATIONAL JOURNAL OF COMPUTERS & TECHNOLOGY
Figure (2): The yearly average daily global solar radiation map of Iraq for the year 2005. 2 The map shows that, Iraq receives about 5000. kWh/m /year of yearly global solar radiation. The maximum 2 value of solar radiation received is 5596 kWh/m /day mostly in south western regions of Iraq, while the minimum 2 value of solar radiations received is 4266 kWh/m /day . The Southern and Northeast region of Iraq as well as most parts receives the lowest global solar radiation. The monthly average of daily global solar radiation data for months from January to December in Iraq were presented as a map form employing GIS with Spherical model as shown in figure (3), which shows the monthly average of daily global solar radiation of Iraq for the month of January until December.
6727 | P a g e March 2016
council for Innovative Research www.cirworld.com
ISSN 2277-3061 Volume 15 Number 05 INTERNATIONAL JOURNAL OF COMPUTERS & TECHNOLOGY
6728 | P a g e March 2016
council for Innovative Research www.cirworld.com
ISSN 2277-3061 Volume 15 Number 05 INTERNATIONAL JOURNAL OF COMPUTERS & TECHNOLOGY
Figure (3): Surface maps of monthly average daily global solar radiation over Iraq for the months (January –December) year 2005 based on spherical semi-variogram model for simple kriging. In general, the constructions of monthly average daily global solar radiation maps provide a clearer picture of the changes in global solar radiation throughout the year. The following table (1) summarizes the results of Spherical model for year (2005) and for all months.
Table (1): Cross validation results of spherical model for year (2005) and for all months.
6729 | P a g e March 2016
Months
MPE
RMS
MSPE
RMSS
ASE
January
0.56
141.04
-0.009
0.86
200.74
February
-0.73
192.42
-0.002
0.98
195.60
March
1.36
212.01
-0.004
1.01
208.66
April
-4.15
242.67
-0.012
0.92
250.85
May
-2.72
204.03
-0.009
1.02
199.87
June
-1.41
179.65
-0.001
0.81
221.61
July
-2.24
183.97
-0.005
0.99
180.70
August
-1.41
178.13
-0.001
0.92
192.58
September
-2.38
165.03
0.015
0.94
194.01
October
2.88
169.72
0.01
0.98
170.55
November
2.81
128.88
0.027
1.05
133.03
December
1.26
144.19
0.007
0.93
140.78
council for Innovative Research www.cirworld.com
ISSN 2277-3061 Volume 15 Number 05 INTERNATIONAL JOURNAL OF COMPUTERS & TECHNOLOGY The selection of the optimal interpolated prediction, for each of the three models, was done by comparing the parameters of the cross-validation characteristics in conformity with the description: Optimal prediction has to be unbiased (centered on the true values). If the prediction errors are unbiased, the mean prediction error (MPE) should be near zero. If the average standard errors (ASE) are close to the root-mean-squared prediction errors (RMS), the variability in prediction It is correctly assessed. If the average standard errors (ASE) are greater than the root-mean-squared prediction errors (RMS), it is overestimated the variability of the predictions; If the average standard errors (ASE) are less than the root-mean-squared prediction errors (RMS), it is underestimating the variability in the predictions. Table (2) below represent the comparison between the three models adopted in this paper (Cross validation criteria for the three models); it is clear the spherical model gives better results than the other two models.
Table(2): Cross Validation Values for the Models Adopted in the Paper. Type Model
Month
Year
MPE
RMS
MSPE
RMSS
ASE
Spherical
July
1985
0.62
156.29
0.004
1.06
140.72
Circular
July
1985
0.58
157.77
0.003
1.02
148.30
Gaussian
July
1985
1.69
164.61
0.011
1.02
155.19
Spherical
July
1990
-0.17
161.11
0.019
1.09
143.53
Circular
July
1990
-0.15
161.71
0.018
1.05
148.98
Gaussian
July
1990
1.07
164.49
0.026
1.05
151.32
Spherical
July
1995
-0.17
167.74
0.008
1.04
155.81
Circular
July
1995
-0.39
167.91
0.007
1.08
150.47
Gaussian
July
1995
-0.29
177.71
0.023
1.01
170.63
Spherical
July
2000
-2.33
220.02
0.013
0.75
310.30
Circular
July
2000
2.65
220.40
0.012
0.78
298.83
Gaussian
July
2000
2.27
227.30
0.032
0.92
267.20
Spherical
July
2005
-2.24
183.97
-0.005
0.99
180.70
Circular
July
2005
-2.20
184.23
-0.005
1.03
174.29
Gaussian
July
2005
1.21
186.53
0.013
1.04
175.06
In general, the explanation of monthly average daily global solar radiation maps provides a clearer picture of the variation in global solar radiation throughout the year with a latitudinal variability from maximum to minimum values of monthly average daily global solar radiation from north regions to south and south western regions overall Iraq. The average values ranged from 2 2 1660 wh/m during January in the north up to 7240 wh/m in the south during May, whereas during the months June, July, August and September the mentioned behavior will be opposite where the maximum values appears in the north region (8230 2 2 wh/m ) during July and the minimum values of global solar radiation (5090 wh/m ) during September over southern regions. This opposite behavior could be attributed to the factors such as high aerosols loading which were an output of the frequent dust storm are common during summer and early fall seasons [12].
5. Conclusion The estimation of global solar radiation from global solar radiation data can give results at satisfactory accuracy and low cost. The optimal proposed methods are applicable especially for developing countries in manipulating global solar radiation
6730 | P a g e March 2016
council for Innovative Research www.cirworld.com
ISSN 2277-3061 Volume 15 Number 05 INTERNATIONAL JOURNAL OF COMPUTERS & TECHNOLOGY 2
data for various purposes. On average (5000) kwh/m receive of global solar radiation in a year. The highest global solar 2 2 radiation is estimated at 6790 kwh/m in June while the lowest is 1660 kwh/m in December.
Reference [1]
Vidal JM. 1989. Energia solar. Gran Enciclop`edia Catalana, Vol. 18. Fundaci´o Enciclop`edia Catalana: Barcelona.
[2]
Fadai, D. (January 01, 2007). Utilization of renewable energy sources for power generation in Iran. Renewable and Sustainable Energy Reviews, 11, 1, 173-181.
[3]
AL-Salihi, A. M., M, K. M., & Mohammed, A. J. (April 01, 2010). Estimation of Global Solar Radiation on Horizontal Surface Using Routine Meteorological Measurements for Different Cities in Iraq. Asian Journal of Scientific Research, 3, 4, 240-248.
[4]
Ali Naci CELIK," Analysis of Ankara's Exposure to solar radiation: Evaluation of the distribution parameters using long –term Hourly Measured global solar radiation data" Turkish. J. Eng. Envy. Sci., 30, (115-126), 2006.
[5]
Shad, R., Mesgari, M. S., abkar, A., & Shad, A. (November 01, 2009). Predicting air pollution using fuzzy genetic linear membership kriging in GIS. Computers, Environment and Urban Systems, 33, 6, 472-481.
[6]
Diabate L., Demarcq H., Michaud N., Wald L.: Estimating incident solar radiation at the surface from images of the earth transmitted by geostationary satellites: the Heliosat project, Int. J. Remote Sens, 1988, 5, 261– 278.
[7]
Geiger, M., Diabaté, L., Ménard, L., & Wald, L. (January 01, 2002). A web service for controlling the quality of measurements of global solar irradiation. Solar Energy, 73, 6, 475-480.
[8]
C.V. Deutsch, 2002, Geostatistical Reservoir Modeling, Oxford University Press, 376 pages.
[9]
Isaaks, E. H., & Srivastava, R. M. (1989). Applied geostatistics. Oxford: Oxford University Press.
[10]
Webster, R., & Oliver, M. A. (1999). Geostatistics for environmental scientists. Chichester: Wiley.
[11]
Evrendilek, F., & Ertekin, C. (August 01, 2008). Assessing solar radiation models using multiple variables over Turkey. Climate Dynamics, 31, 131-149.
[12]
AL-Salihi A.M, (2015). “Possible linkage between Absorbing Aerosols index and Rainfall over Iraq” Sylwan Vol.159, Issue. 10 of Sylwan journal (ISSN: 0039-7660).
6731 | P a g e March 2016
council for Innovative Research www.cirworld.com