Solid State Ionics 321 (2018) 75–82
Contents lists available at ScienceDirect
Solid State Ionics journal homepage: www.elsevier.com/locate/ssi
Probing the electrical properties and energy storage performance of electrospun ZnMn2O4 nanofibers Jai Bhagwana, Nagesh Kumara, K.L. Yadava,b, Yogesh Sharmaa,b, a b
T
⁎
Centre of Nanotechnology/Indian Institute of Technology Roorkee, India Department of Physics/Indian Institute of Technology Roorkee, India
A R T I C LE I N FO
A B S T R A C T
Keywords: Electrospinning ZnMn2O4 nanofibers Supercapacitor
Spinel structure ZnMn2O4 (ZMO) nanofibers with specific surface area of 30 m2 g−1 are fabricated by simplistic, adaptable and cost effective electrospinning process. ZMO nanofibers are characterized by various characterization techniques, namely TGA, XRD, FTIR, BET surface area analyzer, FESEM and TEM techniques. Dielectric studies of ZMO nanofibers are performed in the frequency range of 20 Hz to 1 MHz at room temperature, which follows the Maxwell-Wagner model. Electrochemical performance of ZMO nanofibers has been probed via cyclic voltammetry (CV), galvanostatic charging-discharging (GCD) and electrochemical impedance spectroscopy (EIS) for supercapacitor applications. Spinel ZMO nanofiber is found to be a prospective electrode material due to the presence of structural voids/gaps in it, which contribute effectively to the energy storage performance of the material. Furthermore, the nanofibric network of interconnected nanoparticles with high surface area is expected to facilitate the foreign ions transportation into electrode material which improves the energy storage performance. The observed specific capacitance of ZMO is found to be 240 ( ± 5) F g−1 at current density of 1 A g−1. The specific energy density and the power density of ZMO are come out to be 33.3 W h kg−1 and 500 W kg−1, respectively, at current density of 1 A g−1. Impedance study demonstrates the low resistance and short diffusion path for electrolytic ions within the material. These remarkable results demonstrate that ZMO can be utilized in the designing of practical high performance supercapacitor devices.
1. Introduction
separation at the electrode/electrolyte interface give rise the electric double layer capacitance and ii) pseudocapacitor or Faradic supercapacitor (FSC) in which Faradaic process i.e. electron transfer reactions between electrode active material and electrolyte develops the specific capacitance (Cs) [8–16]. Carbonaceous materials of different forms (carbon nanotube, mesoporous carbon, activated carbon etc.) have been intensively studied as the electrode materials for electric double layer capacitors (EDLCs) [17–19], whereas various transition metal oxides, hydroxides, sulfides, nitrides and their combinations have been reported to exhibit pseudocapacitance [20–26]. However, both the charge storage mechanisms coexist in a sample, but in a particular supercapacitor system one dominants the other [27]. EDLCs are known for their higher power density and longer charge-discharge cycles (durability), while FSCs exhibit higher specific capacitance and better energy density. In view of futuristic demand, current researchers are focused on transition metal oxide with special emphasis owing to their high electrochemical performance in terms of specific capacitance and energy density [28]. Ruthenium oxide (RuO2) has been reported as an ideal transition metal oxide electrode material for FSCs giving high
Due to global warming and other environmental issues, the worldwide scientific research community is looking towards the available natural resources of energy such as wind, tidal electric, geothermal heat, solar power and biofuels [1,2]. In order to receive interminable energy supply from the natural energy resources, it is required to connect them with some efficient portable energy storage devices. Therefore, enormous efforts have been devoted worldwide to develop portable, secure and low cost energy storage and deliver systems [3,4]. Secondary batteries such as Li-ion batteries have captured the portable electronic market, but these require high performance in terms of power densities to fulfill the futuristic demand like hybrid vehicles. In this regards, supercapacitors which exhibit long cycle life, fast charge/ discharge characteristics along with good energy density and higher power density have become center of attraction for the major world powers and scientific research community [5–7]. On the basis of charge storage mechanism, supercapacitors have been classified into two categories; i) electric double layer capacitor (EDLC) in which charge
⁎
Corresponding author at: Centre of Nanotechnology/Indian Institute of Technology Roorkee, India. E-mail address:
[email protected] (Y. Sharma).
https://doi.org/10.1016/j.ssi.2018.04.007 Received 17 October 2017; Received in revised form 3 April 2018; Accepted 11 April 2018 0167-2738/ © 2018 Elsevier B.V. All rights reserved.
Solid State Ionics 321 (2018) 75–82
J. Bhagwan et al.
of zero dimension (0D) nanostructures in two nanoscaled dimension. In the present work, 1D ZMO nanofibers have been fabricated by facile, robust, versatile and cost effective electrospinning technique. Mesoporous ZMO nanofibers composed of inter-connected nanoparticles with good amount of open pores/voids are subjected to thermal, structural and electrochemical characterization to evaluate their ability for supercapacitor applications. ZMO nanofibers exhibit high Cs of 240 ( ± 5) F g−1 at current density of 1 A g−1. The specific energy density and power density of ZMO active electrode material are found to be 33.3 W h kg−1 and 500 W kg−1, respectively at current density of 1 A g−1. Dielectric studies of ZMO are deliberated at different frequencies varying from 20 Hz to 1 MHz at room temperature.
capacitance and good cyclability, but high cost, toxic nature and big agglomerates during electrochemical redox reactions restricts its commercialization [29–32]. Similar to RuO2, manganese based oxides such as MnO2, Mn2O3 and Mn3O4 also exhibit noticeable pseudocapacitive behavior. Being abundance in nature and non-toxic behavior, these could be promising candidate for futuristic supercapacitive devices [33–36]. However, low electrical conductivity (10−7–10−8 S cm−1), poor cyclability and lower rate capability are the major problems that hinder commercialization of manganese based FSCs [37–39]. Many efforts have been done to short out these issues by synthesizing composites of manganese based materials (particularly Mn3O4) with different conducting materials such as graphene, activated carbon, carbon nanotube and polymers [38,40–42]. The electrochemical performance of Mn3O4 may further be increased by inserting and/or substituting other metal cations in place of one Mn cation at tetrahedral and/or octahedral position in the spinel structures of manganese oxide [43]. These substituted metal cations in manganese oxide may work as buffering matrix to accommodate stress/strain produced during long term cycling [44,45]. Therefore, substitution of cations (Cd, Zn, Co, Ni etc) for one Mn in Mn3O4 will be favorable for improving its conductivity, cyclability and specific capacitance [45,46]. Besides good electronic conduction, mixed transition metal oxides may undergo richer redox reactions which improve capacitive behavior of the material [47]. The electrochemical performance of various mixed transition metal oxides with different morphologies have been investigated extensively and the variety of interesting facts have been observed due to accommodation of different cations with one or more oxidation states. For example, Li et al. synthesized porous urchin-like MnCo2O4.5 hierarchical architectures by hydrothermal route and obtained Cs of 119 F g−1 at 1 A g−1 [48]. Ren et al. prepared flower-like CoMn2O4 by solvothermal method and obtained Cs value of ~188 F g−1 at 1 A g−1 [49]. Zhu et al. fabricated ZnFe2O4 microsphere by solvothermal and reported Cs of 124 F g−1 at 1 A g−1 [50]. Sankar et al. synthesized sub-micron sized polyhedral shaped NiMn2O4 particles by combustion method and obtained Cs of 202 F g−1 at 0.5 mA cm−2 [51]. Zhang et al. documented the Cs of 243 F g−1 at 5 mV s−1 for sol-gel routed mesoporous NiMn2O4 [52]. Further, Pang et al. synthesized porous nickel magnetite material by oxalate precursors calcination in air and obtained Cs of 180 F g−1 at 0.25 A g−1 [53]. As discussed above, nanostructured materials with different morphologies, which possess large surface areas and short diffusion path length, are found to be good for supercapacitive performance. However, mass production of nanomaterials with desired morphology and good reproducibility is still a challenging task. There are some critical issues associated with most of the synthesis methods discussed above such as poor reproducibility, inhomogeneous nanostructures, lengthy process, utilize corrosive and flammable chemical substances, involvement of expensive and sophisticated instruments. Therefore, a synthesis procedure that could overcome the above mentioned problems, up to some extent, is of great interest. In view of this, electrospinning is a simple, versatile, adaptable and fast emerging technique to fabricate the reproducible nanostructures of uniform size. Electrospinning routed one dimensional (1D) nanofibers are the most alluring material due to their high interfacial area and interconnected nanoparticles in a fibric network, which make them especially suitable for energy storage devices. The longitudinal axis of 1D nanostructure can provide efficient transport pathways for both electrons as well as ions with greater electrochemical reversibility, cycle stability and improved mechanical stability. One dimensional nanofiber has received considerable attention due to their unique microstructural properties that can effectively decline the surface energy, which reduces the aggregation possibility of active materials and relieves the side reactions between electrode and electrolyte. In addition, nanofibers having high surface area, good porosity, high electrical conductivity and faster ionic transport enable the better reversibility and cyclic stability of electrodes while maintaining the similar benefits
2. Experimental section 2.1. Preparation of nanofibers In the typical process, 0.001 mol of Zn(CH3COO)2·2H2O and 0.002 mol of Mn(CH3COO)2·4H2O were mixed together in 1 mL distilled water, followed by vigorously stirred for 20–30 min to get a homogeneous solution. Separately, polyvinylpyrrolidone (PVP) was dissolved in ethanol to make 10 wt% PVP solution. Metal precursor solution was mixed with PVP/ethanol solution and stirred for 12 h to get clear and homogenous solution. PVP in ethanol serves as a polymer backbone to hold the metallic precursor particles. Thereafter, 200 μL acetic acid was added into the mixture and stirred for 12 h before electrospinning. Prepared solution was loaded onto 3 mL hypodermic syringe with a 25gauge stainless steel needle. The electric field intensity of 1.5 kV cm−1 was kept between needle and collector. Collector was covered with aluminum foil to collect as-spun nanofibers. The solution was ejected from the tip of the needle through the syringe pump with constant flow rate of 2 mL h−1. The ambient parameters such as relative humidity and temperature inside the electrospinning setup were kept at 15–20% and 40–45 °C, respectively. Detailed optimization and synthesis procedure of nanofibers via electrospinning has been reported in our earlier report [54]. The obtained as-spun nanofibers were dried at 70 °C under vacuum for 12 h, and then sintered to 400 °C at a ramping rate of 1 °C min−1 followed by dwelled at 400 °C for 4 h in muffle furnace. Henceforth, sintered dark brown ZMO nanofibers were kept in a desiccator before further characterization. 2.2. Physico-chemical characterization Surface morphology and inner information about the ZMO nanofibers were obtained through field emission scanning electron microscope (FESEM: MIRA3 Tescan) and transmission electron microscope (TEM: FEI Tecnai G2 S-twin), respectively. X-Ray diffraction pattern of the material was obtained from X-ray diffractometer (XRD: Ultima IV Rigaku). Thermal gravimetric analysis (TGA) was performed in air environment from 25 to 920 °C at the ramping rate of 5 °C min−1 using SII 6300 EXSTAR. Fourier transform infrared (FTIR) spectra of as-spun nanofiber and sintered sample were recorded at different wave numbers ranging from 4000 to 400 cm−1 using PerkinElmer C91158 spectrometer. Surface area of the sample was determined by Brunauer-EmmettTeller (BET) principle and the pore size distribution was obtained by Barrett-Joyner-Halenda (BJH) method with the help of Quantachrome ASIQWIN at 77 K. Dielectric studies of ZMO were deliberated at different frequencies varying from 20 Hz to 1 MHz at 300 K using LCR meter (WAYNE KERR, Model: 6500P). 2.3. Preparation of electrode and electrochemical test To test the electrochemical performance of ZMO nanofibers, working electrode was prepared using active material (ZMO nanofibers), super P (carbon black) and polyvinylidene difluoride (PVDF) binder in the ratio of 70:15:15, and N-methyl-2-pyrrolidone (NMP) was 76
Solid State Ionics 321 (2018) 75–82
J. Bhagwan et al.
degradation of PVP side chain. The last step (weight loss 42%) occurred above 360 to 421 °C owing to further decomposition of PVP main chain. The plateau observed between 421 °C to 915 °C in the curve indicates the formation of nanocrystalline ZMO as confirmed by XRD and FT-IR, in Fig. 1c and d, respectively. FTIR analysis (Fig. 1d), verifies the presence of some residue (may be carbon) in the sintered ZMO nanofibers. TG analysis can be utilized to estimate the weight of possible carbon present in the sintered ZMO sample. As evident from the TGA graph of sintered ZMO (Fig. 1b), a small weight loss (~1.16 wt%) is observed from RT to 915 °C that can be accredited to the removal of adsorbed moisture/water molecules from the surface of the material. Moreover, this is the temperature range where left over carbon react with oxygen to form CO2 or CO gaseous product and thereby the weight loss in the sample appears. However, in the present case, the sintered sample does not show any significant weight loss in the aforementioned temperature range (RT to 915 °C). Therefore, based on TG analysis, the contribution of left over carbon to the specific capacitance (particularly to the value) of ZMO can be neglected. Powder XRD pattern of ZMO nanofibers sintered at 400 °C is shown in Fig. 1c. All the peak positions are perfectly indexed with the tetragonal structure indicating the formation of pure phase ZnMn2O4 (JCPDS Card no. 24-1133). The d-spacing corresponding to the maximum intensity is found to be 2.46 ( ± 0.01) Å with the lattice parameter of a = b = 5.72 ( ± 0.01) Å and c = 9.24 ( ± 0.01) Å and good agreement with literature [55]. The average crystallite size is found to be 16 nm, which has been determined utilizing Scherrer's formula; t = 0.9λ/βcosθ, where t is the mean crystallite size, λ is the wavelength of the X-ray (0.154 nm), β is the full width at half maximum for a diffraction peak that corresponds to (211) plane and θ is the corresponding angle for Bragg diffraction. In order to understand the transformation of functional groups before and after sintering process, FTIR spectra analysis of as-spun and sintered nanofibers have been performed (Fig. 1d). In comparison to sintered nanofibers, several predominant peaks are observed in as-spun
used as a solvent to make homogeneous slurry. For electrodes preparation, slurry was coated on graphite sheet and dried in hot air oven at 80 °C for 12 h to remove the NMP solvent. The electrochemical properties were tested at room temperature in a three electrode system, which was composed of a saturated calomel reference electrode (SCE), Pt wire counter electrode and active material coated working electrode. The effective area of the Pt counter electrode and the effective surface area (coated with active material) of working electrode were ~0.394 cm2 and 1 cm2, respectively. The loading weight of active material was 1 mg cm−2. The electrochemical performance of ZMO nanofibers was examined by CV and GCD cycling using a multichannel Potentiostat/Galvanostat MAC-80039 AUTOLAB under normal atmospheric conditions. For electrochemical measurement, aqueous solution of 1 M Na2SO4 was used as an electrolyte. For electrical conductivity and dielectric measurements, ZMO nanofibers were ground well in a mortar-pestle, and pressed into pallets of diameter 0.92 cm and thickness 0.14 cm via hydraulic press after applying uniaxial pressure of about 4 tons. Before electrical/dielectric measurements, pellet was sintered at 400 °C for 2 h and then coated with silver paste from both sides. The baking temperature for the silver coated pellet was 100 °C for 1 h.
3. Results and discussion 3.1. Thermal, morphological, structural and surface area characterization Fig. 1a represents the FESEM micrograph of long continuous and smooth as-spun nanofibers having diameter of about 250–300 nm. Thermogravimetric study was carried out to understand the phase transition, decomposition, crystallization, and thermal stability details of as-prepared sample. Fig. 1b shows that as-spun nanofibers degrade through three steps; the first step of weight loss about 20%, in the range of 26–260 °C, is attributed to the evaporation of water and solvent. The second weight loss (~18%) between 260 and 360 °C represents the
Fig. 1. (a) FESEM image of as-spun ZMO/PVP composite, (b) TGA curves of as-spun ZMO/PVP and sintered ZMO nanofibers, (c) XRD pattern of the synthesized ZMO and (d) FTIR spectra of as-spun and sintered ZMO nanofibers. 77
Solid State Ionics 321 (2018) 75–82
J. Bhagwan et al.
Fig. 2. (a) FESEM image and (b) TEM image of porous, high aspect ratio sintered nanofibers showing morphological voids and inset shows the EDAX spercrum of ZMO, (c) SAED and (d) HRTEM patterns of sintered ZMO nanofiber.
nanofibers. Peaks observed at 3435 cm−1 and 2964 cm−1 can be interpreted as OeH vibration and symmetric stretching of CH2 groups, respectively [56]. Peak at 1662 cm−1 is attributed to either CeN or C] O functional groups [57]. CH2 scissoring and wagging appear at 1427 cm−1 and 1296 cm−1, respectively [58]. Peak at about 1025 cm−1 can be ascribed to CeOH stretching modes [59]. All these functional groups are contributed by the presence of PVP in the nanofibers. Peaks at about 648 cm−1, 520 cm−1 and 430 cm−1 indicate the formation of metal‑oxygen bonds in ZMO [60,61]. Fig. 2a and b are the FESEM and TEM images of sintered ZMO nanofibers having diameter of 200 to 300 nm. Both images disclose the interconnectivity of the nanoparticles in the fibric shape. The voids/ gaps traits among the particles (encircled) may provide more intercalation/de-intercalation sites for foreign ions. From the FESEM and TEM images it can be concluded that during electrospinning process in the as-spun nanofiber, the composite of metal precursor and PVP form a rigid outer shell with a fluid like interior core and a large amount of solvent ions forming a gel layer on the surface of the fiber. This gel layer maintains the fiber texture and when as-spun nanofibers are sintered, PVP and solvents are evaporated, simultaneously evolution of CO2 and H2O take place and the formation of voids/gaps among the particles of the nanofiber appear. In order to obtain crystalline nanofibric structure of the ZMO, slow heating rate of 1 °C min−1 during sintering process would be beneficial. These voids/gaps might have resulted in better charge propagation and provide more interaction of counter ions at the electrode/electrolyte interface to improve the specific capacitance of ZMO nanofibers. Selected area electron diffraction (SAED) demonstrates the concentric rings with contrast bright spot indicative of well polycrystallinity of ZMO (Fig. 2c). High resolution TEM (HRTEM) enlightened the clear lattice fringes of ZMO (Fig. 2d).
Typically, pseudocapacitive performance of an electrode is closely related with the distribution of the pore size and the specific surface area of the active electrode material. In general, supercapacitor electrode materials with higher specific surface area exhibit better electrochemical performance. Therefore, ZMO nanofiber was further characterized by surface area analyzer using nitrogen adsorption/ desorption isotherms. Fig. 3a shows that the N2 adsorption/desorption isotherm belongs to a typical type-IV profile measured at 77 K and the calculated BET specific surface area of ZMO nanofiber is found to be 30 m2 g−1 with pore volume of 0.052 cm3 g−1. The presence of noticeable gap in the isotherm between relative pressures (P/Po) 0.049 and 0.98 indicates the existence of mesopores in the ZMO nanofibers. Fig. 3b represents the pore size distribution curve, which demonstrates that diameters of most of the pores in our synthesized sample lie in the range 1.7 nm to 6.4 nm, whereas a sharp peak located at 2.8 nm in the distribution curve implies that maximum pores have diameters around 2.8 nm. It has been reported that the size of most of the hydrated ions in the electrolytes lie in the range of 6–7.6 Å, therefore presence of pores in the material having diameter between 1.7 nm to 6.4 nm and typically around 2.8 nm would facilitate the fast diffusion of foreign ions by producing the easy sites for intercalation/de-intercalation to the ions be an effective factor to enhance the electrochemical performance of the material [62]. 3.2. Dielectric constant and dielectric loss of ZnMn2O4 Dielectric properties of the materials depend on numerous factors, namely method of sample preparation, substitution of cations, average grain size etc. The polycrystalline materials behave as inhomogeneous dielectric materials, where individual high-conducting grains are separated by low conducting grain boundary [63]. The dielectric constant 78
Solid State Ionics 321 (2018) 75–82
J. Bhagwan et al.
Fig. 3. (a) N2 adsorption-desorption isotherm of sintered ZMO nanofiber and (b) pore size distribution curve.
Fig. 4. Variation of (a) dielectric constant (ε), (b) loss tangent (tanδ) with frequency for different temperature of ZnMn2O4, (c) Nyquist plot of impedance data at different temperatures and (d) I–V curve of ZMO nanofibers at room temperature.
homogeneities in the material may arise due to porosity, oxygen vacancies and grain structure or defects in the grain boundaries. However, at higher frequencies, the dielectric constant arises due to the electronic polarization. Dielectric constant of the ZMO nanofibers was found to be higher as compared to reported value [66]. Fig. 4b shows dielectric loss tangent (tanδ) versus frequency. This also shows the decreasing behavior with increasing the frequency values. Nyquist plots of ZMO pellets at different temperatures in the frequency range of 20 mHz to 1 MHz are shown in Fig. 4c. Nyquist plots consist of two semi-circles in the temperature range from room temperature (RT) to 50 °C indicating the grain boundary and grain conduction. At higher temperatures hopping of ions within the Mn site results in the suppression of semicircular arc into one arc. From Nyquist plots, it is clear that diameter of the semicircles decreases when temperature increases, which proves that conduction process is thermally activated [67]. The conductivity of ZMO is found to be 2.32 × 10⁻⁷ S cm−1 at room temperature. To confirm the conductivity of the pellet of ZMO nanofiber, I–V characteristic has also been
and dielectric loss of pellet of ZMO nanofibers as a function of frequency have been measured using LCR meter and shown in Fig. 4a. The dielectric constant (ε) decreases steadily with increasing in the frequency and becomes almost independent of the frequency in the high frequency region. It follows the Maxwell-Wagner model [64]. According to this, when an electric field is applied on a dielectric material, its atoms need a finite time to align themselves in the direction of the field. This time is known as relaxation time and its precise value is around 10−9 s. When the frequency of an electric field increases, at typical value, charge carriers of the dielectric do not align themselves in accordance with the field and therefore polarization cannot achieve its saturation value. The value of dielectric constant decreases and if we further increase the frequency, the dielectric constant becomes independent of frequency [65]. At lower frequencies, different types of polarizations contribute to the dielectric constant such as electronic, ionic, atomic and interfacial polarizations, etc. Furthermore, in-homogeneity in the structure and resistivity of the dielectric compounds contribute to the dielectric constant of the material. The in79
Solid State Ionics 321 (2018) 75–82
J. Bhagwan et al.
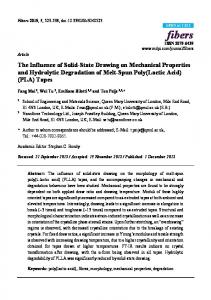
Fig. 5. (a) CV curves at different scan rates, (b) galvanostatic charge–discharge curves at different current densities, (c) specific capacitance as a function of cycle number at 1 A g−1 and inset shows the Ragone plot, (d) Nyquist plots of the electrode material and inset shows the equivalent circuit and high frequency region (after zooming).
Whereas, at higher current densities, limited diffusion of ions occurs into the interior parts of the active electrode material results in lesser Cs. However, in the present scenario, decrement in Cs value of 40 F g−1 is observed even if the current density is increased 3-fold. This justifies the importance of porous, aligned and high aspect ratio nanofibers, which provide more active sites for electrolytic ions even at high current density. The proposed possible reaction mechanism regarding the intercalation/de-intercalation of Na+ into ZMO is given below [51,69];
performed (Fig. 4d), which follows Ohm's law. The conductivity from I–V curve is calculated to be 2.0 × 10⁻⁷ S cm−1 at room temperature which is higher than previously reported value of 5.75 × 10⁻¹¹ S cm−1 for pristine ZnMn2O4, however conductivity of 8.55 × 10⁻⁸ S cm−1 was reported from reduced graphene oxide (rGO)-wrapped ZnMn2O4 [68].
3.3. Electrochemical studies of ZMO nanofibers To investigate the supercapacitor performance of ZMO nanofibers, electrochemical characterizations such as CV and GCD have been carried out. The CV curves, recorded at different scan rates i.e. 3, 10, 30 and 50 mV s−1 in three electrodes configuration, are shown in Fig. 5a. Almost identical shape of CV curves from low to high scan rates indicates the unrestricted motion of electrolytic ions through the voids/ gaps between adjacent nanofibers, and also results the small ohmic resistance for migration of electrolytic ions in the nanofabric morphology. This high performance of ZMO nanofibers can be ascribed to the unique morphology of the nanofibers, where small nanoparticles are interconnected with good amount of open voids/gaps. These voids/ gaps work as reaction sites that enable high charge storage mechanism for foreign ions. Moreover, percolation of electrolytic ions even to the inner parts of nanofibers further increases the importance of ZMO nanofibers for high rate performing supercapacitors. The subsequent analysis of supercapacitive performance of electrode material is carried out using GCD and corresponding charge-discharge curves are shown in Fig. 5b. Almost triangle shape of GCD curves are obtained. Using discharging time, the calculated specific capacitances are found to be 240 ( ± 5) F g−1, 215 ( ± 5) F g−1 and 200 F g−1 at 1 A g−1, 2 A g−1 and 3 A g−1 current densities, respectively. It shows that the rate capability of nanofabric ZMO is quite good, which can be assigned to smaller contact resistance and special nanofabric morphology. Furthermore, it can be seen that charging/discharging time decreases with increasing the current density value (A g−1), which is a common phenomenon observed in supercapacitors and it occurs because at lower current density values, ions diffuse sufficiently deeper into the electrode material and results in a higher Cs.
(ZnMn2 O4 )surface + Na+ + e− ↔ [NaZnMn2 O4 ]surface
(1)
ZnMn2 O4 + Na+ + e‐ ↔ [ZnMn2 O4 ]Na
(2)
The surface adsorption of electrolyte cations (Na+) and/or intercalation/de-intercalation of Na+ in the voids of spinel structure may occur at the interface of active material (ZMO) and electrolyte. Usually, redox reactions are the consequence of insertion/de-insertion of Na+ ions into holes/voids of electrode material from/to the electrolyte. The obtained results in terms of Cs are well compared with literature reports. For example, Sahoo et al. obtained Cs of 60 F g−1 at 0.5 A g−1 from nanostructured ternary ZnMn2O4 [69]. Wang et al. synthesized Cd-doped ZnMn2O4 microsphere and reported Cs of about 364 F g−1 at scan rate of 2 mV s−1 [70]. Guo et al. synthesized porous ZnMn2O4 microsphere and reported Cs of 155 F g−1 at scan rate of 2 mV s−1 [71]. Wei et al. demonstrated the Cs of 54 F g−1 at 20 mV s−1 for ZMO nanosphere [72]. In the present work, high value of Cs is ascribed to the electrode integrity composed of interconnected nanoparticles forming an aligned, high aspect ratio nanofiber of ZMO. The cycle performance is one of the most important factor that represents the electrochemical stability of the sample. The long term cyclability of ZMO nanofiber has been tested by GCD cycling at 1 A g−1 and results are shown in Fig. 5c. It is observed that Cs for ZMO decreases from 240 ( ± 5) F g−1 to 235 ( ± 5) F g−1 over 2000 cycles. These results demonstrate that ZMO possesses excellent cyclability. The ex-situ FESEM images of cycled electrode are shown in Fig. S1a and S1b. We observe that after 2000 successive cycles @1 A g−1 the shape of nanofibers remain intact but the morphology of the nanoparticles constituting the nanofiber has changed from particle shape into nanosheet like structure. Further, the excellent performance of 80
Solid State Ionics 321 (2018) 75–82
J. Bhagwan et al.
3.48 × 10⁻¹¹ cm2 s−1. The higher value of diffusion coefficient implies the existence of efficient ionic pathway in the synthesized ZMO nanofibres, which leads to the fast ionic transportation in the system [46].
supercapacitor can be understood by two important parameters: energy and power densities. Specific energy density and power density of the ZMO nanofibers are found to be 33.3 W h kg−1 and 500 W kg−1, respectively, at current density of 1 A g−1. It maintains high energy density of 25 W h kg−1 at power density of 2.5 kW kg−1 even at high current density of 5 A g−1 (inset of Fig. 5c). We observe that the energy density of the electrochemical system depends on the current density. Here, it is also worth to mention that useful energy (free energy) produced by an electrochemical system is a state function and depends on the identity of the materials used in the construction of the electrodes and on the initial and final states of the related electrochemical reactions [73]. However, the total amount of charge transferred during the course of a reaction must also be taken into consideration as it has strong relationship with the free energy through the relation, ΔG = −nF Ecell, where Ecell is the cell potential, n is the number of electron per mole of active material and F is Faraday constant. Here, term nF, also known as capacity/capacitance factor, represents the amount of current produced and strongly depends on the availability of the active material for the electrochemical reactions [73]. Thus, at lower current density, foreign ions diffuse/penetrate sufficiently deeper into the electrode material and maximum part of active material will be available for storage and thus transfer of more electron takes place. As a result, nF increases and hence the free energy of the system increases. However, at higher current densities, ions do not have sufficient time to get into the material and hence accessibility of the material decreases which results the decrease of free energy of the system [74]. Electrochemical impedance spectroscopy (EIS) is used to determine resistance between electrode and electrolyte, and the internal resistance of the active electrode material [75]. The Nyquist plots of the nanofibric ZMO electrode in 1 M Na2SO4 are shown in Fig. 5d, which clearly indicates a small semicircle in the higher to medium frequency region followed by a slopping line making an angle (~45°) with the x-axis. Intercept in the high frequency region is termed as effective series resistance (ESR) or solution resistance (Rs), which is the combination of ionic resistance of electrolyte, intrinsic resistance of current collector and active electrode material, and contact resistance at the electrode and current collector interface [75]. The diameter of semicircle in high to medium frequency region corresponds to the charge transfer resistance (Rct), which is the result of Faradaic reactions and electronic double layer capacitance (Cdl) at the electrode electrolyte interface. The slanted line with slop of ~45° demonstrates the frequency dependent Warburg impedance (W) caused by ions diffusion process inside the active electrode material [76,77]. To distinguish the individual process and corresponding impedance parameters, an equivalent circuit comprising series and parallel combination of equivalent total resistance (Rs), electric double layer capacitance (Cdl), charge transfer resistance (Rct) and frequency dependent Warburg impedance (W) is fitted (inset of Fig. 5d). The fitted value of Rs and Rct of ZMO are found to be 660 mΩ and 3.76 Ω, respectively. These lower values suggest that nanofibric morphology of ZMO exhibits very small resistance which facilitates the easy movement of electrolytic ions. As evident from the Nyquist plots, the values of Rs and Rct have changed only slightly even after 2000 cycles. The smaller values of Rs and Rct with unnoticeable Warburg impedance are considered to be good for improving supercapacitive performance and further justify the suitability of high aspect ratio ZMO nanofiber. The diffusion coefficient of the electrolyte ions (Na+ cation) in ZMO electrode has been calculated using the formula D = πfLL2, where fL is the limiting frequency extracted from the Nyquist plot (Fig. S2), D is the diffusion coefficient (cm2 s−1) and L is the maximum length in the diffusion pathway in the electrode system. In order to calculate diffusion coefficient, thickness of the film in thin film electrode and diameter of the fine particle (nano size) can be considered as the reasonable value of L [78]. Here the value of L is diameter of the particle ~43 nm and the observed limiting frequency (fL) from Nyquist plot is 0.599 Hz. Therefore, the calculated value of the diffusion coefficient of the Na+ cation in ZMO electrode come out to be
4. Conclusions In the present work, we have demonstrated simple, versatile and cost effective way to synthesize ZMO nanofibers. Synthesized samples were characterized by TGA, XRD, FTIR, BET surface area analyzer, FESEM and TEM techniques. High aspect ratio ZMO nanofibers with high surface area (30 m2 g−1) were tested as electrode material for supercapacitor. Dielectric studies of ZMO nanofibers were investigated in the frequency range of 20 Hz to 1 MHz at the room temperature, which follows the Maxwell-Wagner model. The Cs of 240 ( ± 5) F g−1 at current density of 1 A g−1 was observed employing 1 M Na2SO4 aqueous electrolyte solution. Impedance study demonstrates the low resistance and fast kinetics of foreign ions within the electrode material. The improved performance of ZMO nanofibers could be attributed to unique morphology of ZMO consisting of interconnected nanoparticles with suitable voids/gaps in between, which provide more accessibility of the material for foreign ions. High specific energy density of 33.3 W h kg−1 was observed at power density of 500 W kg−1. Our results offer tantalizing combination of high rate and high energy density of ZMO nanofibers. We believe that ZMO nanofibers have the potential to overcome the low energy density limitations of electrochemical supercapacitor. Acknowledgements We are thankful to DAE-BRNS, Govt. of India for providing the research grant to support our research through Grant No. 2012/34/44/ BRNS. Appendix A. Supplementary data Supplementary data to this article can be found online at https:// doi.org/10.1016/j.ssi.2018.04.007. References [1] A. González, E. Goikolea, J.A. Barrena, R. Mysyk, Renew. Sust. Energ. Rev. 58 (2016) 1189–1206. [2] P. Simon, Y. Gogotsi, Nat. Mater. 7 (2008) 845–854. [3] X. Lu, M. Yu, G. Wang, Y. Tong, Y. Li, Energy Environ. Sci. 7 (2014) 2160–2181. [4] I.H. Lo, J.Y. Wang, K.Y. Huang, J.H. Huang, W.P. Kang, J. Power Sources 308 (2016) 29–36. [5] Y. Huang, J. Liang, Y. Chen, Small 8 (2012) 1805–1834. [6] D. Pech, M. Brunet, H. Durou, P. Huang, V. Mochalin, Y. Gogotsi, P.-L. Taberna, P. Simon, Nature Nanotech. 5 (2010) 651–654. [7] X. Liu, Q. Li, Y. Zhao, Y. Dong, Q. Fan, Q. Kuang, J. Mater. Sci. 52 (2017) 13552–13560. [8] Y. Zhang, L. Li, H. Su, W. Huang, X. Dong, J. Mater. Chem. A 3 (2015) 43–59. [9] M.A. Azam, N.S.A. Manaf, E. Talib, M.S.A. Bistamam, Ionics 19 (2013) 1455–1476. [10] S. Patra, N. Munichandraiah, J. Appl. Polym. Sci. 106 (2007) 1160–1171. [11] Q. Ke, J. Wang, J. Mater. 2 (2016) 37–54. [12] Y.H. Dai, L. Bin Kong, K. Yan, M. Shi, Y.C. Luo, L. Kang, Ionics (2016) 1461–1469. [13] J. Bhagwan, V. Sivasankaran, K.L. Yadav, Y. Sharma, J. Power, Sources 327 (2016) 29–37. [14] B. Djurfors, J.N. Broughton, M.J. Brett, D.G. Ivey, J. Mater. Sci. 8 (2003) 4817–4830. [15] P. Howli, S. Das, S. Sarkar, M. Samanta, K. Panigrahi, N.S. Das, K.K. Chattopadhyay, ACS Omega 2 (2017) 4216–4226. [16] Y. Zhang, S. Yu, G. Lou, Y. Shen, H. Chen, Z. Shen, S. Zhao, J. Zhang, S. Chai, Q. Zou, J. Mater. Sci. 52 (2017) 11201–11228. [17] Z. Chen, D. Yu, W. Xiong, P. Liu, Y. Liu, L. Dai, Langmuir 30 (2014) 3567–3571. [18] D. Bhattacharjya, J.S. Yu, J. Power, Sources 262 (2014) 224–231. [19] H. Tamai, M. Hakoda, T. Shiono, H. Yasuda, J. Mater. Sci. (2007) 1293–1298. [20] N. Kumar, Y.C. Yu, Y.H. Lu, T.Y. Tseng, J. Mater. Sci. 51 (2016) 2320–2329. [21] P. Xu, C. Miao, J. Feng, K. Cheng, K. Ye, J. Yin, D. Cao, G. Wang, Z. Cai, Q. Li, Electrochim. Acta 232 (2017) 445–455. [22] L. Zhang, Q. Ding, Y. Huang, H. Gu, Y.-E. Miao, T. Liu, ACS Appl. Mater. Interfaces 7 (2015) 22669–22677. [23] W. Hu, R. Chen, W. Xie, L. Zou, N. Qin, D. Bao, ACS Appl. Mater. Interfaces 6 (2014)
81
Solid State Ionics 321 (2018) 75–82
J. Bhagwan et al.
RSC Adv. 5 (2015) 27649–27656. [52] M. Zhang, S. Guo, L. Zheng, G. Zhang, Z. Hao, L. Kang, Z.-H. Liu, Electrochim. Acta 87 (2013) 546–553. [53] H. Pang, J. Deng, S. Wang, S. Li, J. Du, J. Zhang, RSC Adv. 2 (2012) 5930–5934. [54] J. Bhagwan, A. Sahoo, K.L. Yadav, Y. Sharma, Electrochim. Acta 174 (2015) 992–1001. [55] L. Luo, R. Cui, H. Qiao, K. Chen, Y. Fei, D. Li, Z. Pang, K. Liu, Q. Wei, Electrochim. Acta 144 (2014) 85–91. [56] P.F. Teh, Y. Sharma, Y.W. Ko, S.S. Pramana, M. Srinivasan, RSC Adv. 3 (2013) 2812. [57] P.F. Teh, Y. Sharma, S.S. Pramana, M. Srinivasan, J. Mater. Chem. 21 (2011) 14999–15008. [58] Y. Borodko, S.E. Habas, M. Koebel, P. Yang, H. Frei, G.A. Somorjai, J. Phys, Chem. B 110 (2006) 23052–23059. [59] L. Pereira, A. Sousa, H. Coelho, A.M. Amado, P.J.A. Ribeiro-Claro, Biomol. Eng. 20 (2003) 223–228. [60] S.A. Hosseini, D. Salari, A. Niaei, F. Deganello, G. Pantaleo, P. Hojati, J. Environ, Sci. Heal. Part A 46 (2011) 291–297. [61] S. Chaudhari, M. Srinivasan, J. Mater. Chem. 22 (2012) 23049–23056. [62] S. Kondrat, C.R. Perez, V. Presser, Y. Gogotsi, A.A. Kornyshev, Energy Environ. Sci. 5 (2012) 6474–6479. [63] F. Ca, D. Nd, L. Ti, M.R. Shah, A.K.M.A. Hossain, J. Mater. Sci. Technol. 29 (2013) 323–329. [64] R. Zhang, J.F. Li, D. Viehland, J. Am. Ceram. Soc. 87 (2004) 864–870. [65] M.Z. Ansar, S. Atiq, K. Alamgir, S. Nadeem, J. Sci. Res. 6 (2014) 399–406. [66] L.S. Lobo, A.R. Kumar, J. Mater. Sci. Mater. Electron. 27 (2016) 7398–7406. [67] H. Rahmouni, M. Smari, B. Cherif, E. Dhahri, K. Khirouni, Dalton Trans. 44 (2015) 10457–10466. [68] T. Zhang, H. Yue, H. Qiu, K. Zhu, L. Zhang, Y. Wei, F. Du, G. Chen, D. Zhang, RSC Adv. 5 (2015) 99107–99114. [69] A. Sahoo, Y. Sharma, Mater. Chem. Phys. 149–150 (2014) 721–727. [70] Y.L. Wang, X.Q. Wei, N. Guo, X.L. Deng, X.J. Xu, J. Mater. Sci. Mater. Electron. 28 (2017) 1223–1228. [71] N. Guo, X.Q. Wei, X.L. Deng, X.J. Xu, Appl. Surf. Sci. 356 (2015) 1127–1134. [72] X.Q. Wei, Y.L. Wang, N. Guo, X.L. Deng, X.J. Xu, Ionics 23 (2017) 2443–2448. [73] M. Winter, R.J. Brodd, Chem. Rev. 104 (2004) 4245–4269. [74] S. Chen, J. Zhu, X. Wu, Q. Han, X. Wang, ACS Nano 4 (2010) 2822–2830. [75] J. Xu, G. Wang, J. Cao, Y. Xue, Y. Li, W. Wang, Z. Chen, Ionics 22 (2016) 1177–1184. [76] S. Sahoo, S. Zhang, J.-J. Shim, Electrochim. Acta 216 (2016) 386–396. [77] A. Pockett, G.E. Eperon, N. Sakai, H.J. Snaith, L.M. Peter, P.J. Cameron, Phys. Chem. Chem. Phys. 19 (2017) 5959–5970. [78] B. Garcia, J. Farcy, J.-P. Pereira-Ramos, J. Electrochem. Soc. 144 (1997) 1179–1184.
19318–19326. [24] H. Chen, J. Jiang, L. Zhang, H. Wan, T. Qi, D. Xia, Nano 5 (2013) 8879–8883. [25] D. Ghosh, C.K. Das, ACS Appl. Mater. Interfaces 7 (2015) 1122–1131. [26] C. Zhu, P. Yang, D. Chao, X. Wang, X. Zhang, S. Chen, B.K. Tay, H. Huang, H. Zhang, W. Mai, H.J. Fan, Adv. Mater. 27 (2015) 4566–4571. [27] B.E. Conway, W.G. Pell, J. Solid State, Electrochemistry 7 (2003) 637–644. [28] P.Y. Chan, S.R. Majid, Solid State Ionics 262 (2014) 226–229. [29] H. Wang, Q. Gao, L. Jiang, Small 7 (2011) 2454–2459. [30] A.N. Naveen, S. Selladurai, Ionics 22 (2016) 1471–1483. [31] Z.-S. Wu, D.-W. Wang, W. Ren, J. Zhao, G. Zhou, F. Li, H.-M. Cheng, Adv. Funct. Mater. 20 (2010) 3595–3602. [32] H. Wang, L. Zhang, X. Tan, C.M.B. Holt, B. Zahiri, B.C. Olsen, D. Mitlin, J. Phys. Chem. C 115 (2011) 17599–17605. [33] P. Yu, X. Zhang, Y. Chen, Y. Ma, Mater. Lett. 64 (2010) 1480–1482. [34] W. Li, J. Shao, Q. Liu, X. Liu, X. Zhou, J. Hu, Electrochim. Acta 157 (2015) 108–114. [35] D. Yan, H. Zhang, L. Chen, G. Zhu, Z. Wang, H. Xu, A. Yu, RSC Adv. 4 (2014) 23649–23652. [36] A. Vázquez-Olmos, R. Redón, G. Rodríguez-Gattorno, M.E. Mata-Zamora, F. Morales-Leal, A.L. Fernández-Osorio, J.M. Saniger, J. Colloid Interface Sci. 291 (2005) 175–180. [37] L. Li, K.H. Seng, H. Liu, I.P. Nevirkovets, Z. Guo, Electrochim. Acta 87 (2013) 801–808. [38] X. Zhang, X. Sun, Y. Chen, D. Zhang, Y. Ma, Mater. Lett. 68 (2012) 336–339. [39] K. Subramani, D. Jeyakumar, M. Sathish, Phys. Chem. Chem. Phys. 16 (2014) 4952–4961. [40] K.-S. Kim, S.-J. Park, Bull. Kor. Chem. Soc. 34 (2013) 2343–2347. [41] X. Cui, F. Hu, W. Wei, W. Chen, Carbon 49 (2011) 1225–1234. [42] T. Xiong, W.S.V. Lee, X. Huang, J.M. Xue, J. Mater. Chem. A 5 (2017) 12762–12768. [43] H. Wei, J. Wang, L. Yu, Y. Zhang, D. Hou, T. Li, Ceram. Int. 42 (2016) 14963–14969. [44] H. Hwang, H. Shin, W.-J. Lee, Sci. Rep. 7 (2017) 46378–46387. [45] H. Bordeneuve, C. Tenailleau, S. Guillemet-Fritsch, R. Smith, E. Suard, A. Rousset, Solid State Sci. 12 (2010) 379–386. [46] J. Bhagwan, S. Rani, V. Sivasankaran, K.L. Yadav, Y. Sharma, Appl. Surf. Sci. 426 (2017) 913–923. [47] P. Ahuja, S.K. Ujjain, R.K. Sharma, G. Singh, RSC Adv. 4 (2014) 57192–57199. [48] W. Li, K. Xu, G. Song, X. Zhou, R. Zou, J. Yang, Z. Chen, J. Hu, CrystEngComm 16 (2014) 2335–2339. [49] L. Ren, J. Chen, X. Wang, M. Zhi, J. Wu, X. Zhang, RSC Adv. 5 (2015) 30963–30969. [50] M. Zhu, X. Zhang, Y. Zhou, C. Zhuo, J. Huang, S. Li, RSC Adv. 5 (2015) 39270–39277. [51] K.V. Sankar, S. Surendran, K. Pandi, A.M. Allin, V.D. Nithya, Y.S. Lee, R.K. Selvan,
82