ISSN : 0974 - 7494
Volume 8 Issue 3
Nano Science and Nano Technology
An Indian Journal Full Paper
NSNTAIJ, 8(3), 2014 [83-91]
Solid-state synthesis of ZnS nanoparticle via mechanical milling process M.S.Al-Kotb1*, H.Selim2, H.H.Amer2, M.M.Khalil3, M.F.Kotkata1 1
Semiconductors Technology Lab., Faculty of Science, Ain Shams University, Cairo-11566, (EGYPT) 2 Solid State Department, National Centre for Radiation Research and Technology (NCRT), Atomic Energy Authority (AEA), Cairo, (EGYPT) 3 Chemistry Department, Faculty of Science, Ain Shams University, Cairo-11566, (EGYPT) E-mail :
[email protected]
ABSTRACT
KEYWORDS
Zinc sulfide (ZnS) quantum dots (QDs) were prepared via a novel solid– state reaction by milling appropriate amounts of zinc acetate and thioacetamide at room temperature. The structural nature and optical properties of the as-synthesized nanoparticles were characterized by using:X-ray diffraction (XRD), energy dispersive X-rays analysis (EDX), transmission electron microscopy (TEM), Fourier transform infrared (FTIR) and thermo gravimetric analysis (TGA).The particle size of the produced ZnS lies in the range of 2.95±0.13–4.23±0.039 nm, depending on the milling period (1: 4 hrs), and in comparison to the Bohr radius of ZnS (2.5 nm).The TGA revealed stability of all products up to ~500oC, after which ZnS were found to react with O2 to produce ZnO as confirmed by XRD and FT-IR. The optical properties were studied by analyzing the recorded UV-Vis and photoluminescence (PL) spectra. The optical band gap of the assynthesized ZnS QDs lies in the range of 4.24–4.60 eV depending on the milling period. PL excitation peak shows a blue shift for ZnS-QDs obtained by milling. This blue shift could be attributed to a secondary effect of photo- corrosion process, which is in other words attributed as reduction in diameter of the ZnS QDs. 2014 Trade Science Inc. - INDIA
INTRODUCTION Due to the ‘quantum confinement effects’, optical, electronic as well as other properties of the semiconductor (SC) nanoparticles (NPs) are different than those of their bulk materials[1]. Generally, the SC nanoclusters or quantum dots (QDs) exhibit size dependent properties[2]. Particles in nano-metric sizes show unique physical properties; for example, with the decrease of par-
II-VI semiconductors; Nanostructures; ZnS nanoparticles; Quantum dots; Solid-state reaction.
ticle size, extremely high surface area to volume ratio is obtained leading to an increase in surface specific active sites for chemical reactions and photon absorption to enhance the reaction and absorption efficiency. As QDs have very high surface to volume ratio, so surface defects play an important role in their properties[3]. Family of the II-VI nano-scale chalcogenide SCs represents an interesting group of SC materials; this is because of their fundamental electronic and optical prop-
84
Solid-state synthesis of ZnS nanoparticle via mechanical milling process
NSNTAIJ, 8(3) 2014
Full Paper erties that lead to various technological applications. Examples of II-VI SCs are: ZnS[4,5], CdS[6,7], ZnO[8] and CdSe[9]. Among those SCs, ZnS NPs is found to exhibit excellent optical and optoelectronic properties that differ greatly from the corresponding bulk form[10,11]. ZnS, a typical II–VI compound semiconductor, with a direct band gap of 3.6 eV at room temperature and 40 meV as exciton binding energy is a very good luminescent material used in displays, sensors, and lasers[12], and has Bohr exciton radius (aB) of ~2.5 nm[13]. In addition, ZnS of such size is very interesting as small biomolecular probes for fluorescence and laser scanning microscopy. In the last decade, ZnS NPs has been a subject of extensive experimental and theoretical studies due to its extends application range [c.f.[14,15] and references cited therein]. In literature, there are many reported methods for the preparation of ZnS NPs that can be divided into two broad categories: i) The physical methods that mainly include molecular beam epitaxial (MBE) and laser ablation. These methods, generally, need high reaction temperature, vast use of organic solvents, high cost of equipment operation as well as complex process control[16]. Besides, particles prepared by such methods are, in most cases, of poor uniformity and agglomerate easily[17,18]. ii) The chemical methods that mainly includethermal decomposition, micro-emulsion, sol-gel, aqueous chemical and the solid state reaction method. Nevertheless, the solid-state reactions are particularly suitable for large-scale production of NPs because of their relative simplicity and low cost. Since such reactions do not involve organic solvents, Therefore, it attracts much attention from an environmental point of view. The aim of this work is to study the structural characterization and optical properties of non-contaminated nano-scale ZnS phase that synthesized via an easy and efficient method. Herein, the used method is an easy, rapid and economic, beside it carried out at room temperature (RT). It represents solid-state chemical reaction between zinc acetate and thioacetamide throughout a milling process for different grinding periods (1:4 hrs) of the mixture. Through this method, ZnS QDs of grinding period size dependent were produced.The produced materials were characterized by various techniques: X-ray diffraction (XRD), energy dispersive XNano Sci enc e and Nano Te chnolo gy An Indian Journal
rays analysis (EDX), transmission electron microscopy (TEM), Fourier transform infrared (FT-IR), thermogravimetric analysis (TGA), as well as UV-visible and photoluminescence (PL) spectra. EXPERIMENTAL Synthesis of ZnS QDs It is worth mentioning that the considered arguments in selecting a method, among several others, for preparing nano-size material, include: non-toxic, rather easy, fast and low-cost as well as producing small particle sizes, low agglomeration and narrow-size distribution with uniformity of crystal structure and morphology. Here, the investigated ZnS NPs were prepared via a solid state chemical method reaction at RT. The chemicals used are: zinc acetate (Zn (CH3COO)2.2H2O, Sigma) and thioacetamide (TAA, Sigma). All of them were of analytical grade and used as received without any further purification. Each of the two constituents is firstly ball milled separately for 15 min before the stoichiometrically mixing process of their powdered appropriate required quantities. The synthesized reaction is, then, takes place between the two constituent mixtures by milling for different periods (1, 2, 3 and 4 hrs) at RT. The powdered ground mixture of each milling period is heated in an electric oven for 1hr at 70±0.5oC. Finally, the powder was washed by distilled water for several times before drying at 80oC for ~20 hrs. The color of the zinc sulfide powder nanoparticles products was found as light yellow. Measurement techniques The final products (ZnS) were characterized by different techniques; including: powder X-ray diffraction (XRD) using a Phillip’s computerized diffractometer (type: X’pert-MPDUC PW 3040) with CuKá radiation source (ë=0.15406 nm) at a power of 1600 W (40 kV and 40 mA), in the 2è diffracting angle range from 10o to 80o. An energy-dispersive X-ray analysis (EDX) unit attached to FEI-INSPECTS environmental scanning electron microscope, with operating voltage up to 30 kV, was used for elemental analysis of the synthesized powders. The morphology and microstructures of the synthesized powders were investigated by using transmis-
NSNTAIJ, 8(3) 2014
M.S.Al-Kotb et al.
85
Full Paper sion electron microscope (TEM) of JEOL (type: JEM 100 CX) operated at an accelerating voltage of 200 kV. The TEM samples were prepared by dispersing small amount of the as-product powder in ethanol, and a drop of dispersion was then transferred onto a carbon-coated copper grid that was dried for observation. Thermogravimetric analysis (TGA) for ~10 mg of the powder were conducted on a micro-TG apparatus (type: Shimadzu TG-50) in N2 atmosphere at different heating rates of 5-20 deg/min. Fourier transform infrared (FT–IR) measurements were carried out using FT–IR Raman spectrophotometer (Type: JASCO A-6300) in the spectral range of 400-4000 cm-1 with resolution of 4 cm-1. UV-Vis spectra of the as-synthesized ZnS QDs were recorded on UVIKON 860 double beam spectrophotometer. Also, the photoluminescence (PL) spectrum was recorded on a Perkin Elmer LS 50B fluorescence spectrophotometer.
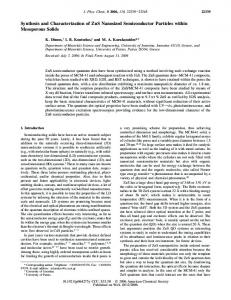
Figure 1 : EDAX spectrumof ZnS as-prepared sample milled for 1 hr at RT.
RESULTS AND DISCUSSION Composition and structure characterization EDX spectrum analysis showed the composition as well as the homogeneity of the prepared ZnS that the respective percentage of the constituent elements Zn and S are found to be: 49.25± 0.18 at.% and 50.75± 0.18 at.% (Figure 1). The structural evolution of milled (ZnS) powder with increasing milling time is recognized in the XRD spectra of Figure 2. XRD analysis of the samples with milling time is shown increasing broadened due to the nano-sized effects. This figure indicated that all studied samples exhibited pure cubic Zinc-blende crystal structure. The peaks appeared at 2è values of 28.6o, 47.5o and 56.3o, respectively, belong to (111), (220) and (311) Miller indices of the ZnS cubic (zincblend) structural type, [JCPDS file # 05-0566]. No other crystalline impurities were detected within the recorded 2è-limit indicating high purity of the as-synthesized ZnS product. The 2 and of the peak (002) were determined by profile fitting technique using Pseudo-Voigt function. The best-fit results were chosen taking into account the minimum error as well as the realistic values for the fitting parameters. The average particles size of the as-
Figure 2 : XRD patterns for as-prepared ZnS Nps grinded for different milling periods at RT.
prepared ZnS powder for each ball milling period has been calculated from the full-width at half-maximum () of the three recorded diffraction peaks of the corresponding XRD pattern of Figure 2, using WilliamsonHall’s formula[19]: âcos(è)=[0.94×ë/D]+[4Ssin(è)] (1) Nano Sci enc e and Nano Te chnolo gy An Indian Journal
Solid-state synthesis of ZnS nanoparticle via mechanical milling process
86
NSNTAIJ, 8(3) 2014
Full Paper where â is the integral width of the analyzed diffraction line in radians, ë is wavelength of X-rays, è is scattering Bragg angle, D is particle diameter, and S is the strain. Here, the values of â were determined by the profile fitting technique using Pseudo-Voigt function. According to Eqn. (1), the average value of D for each grinding period can be estimated from the slope of least-squares fit of the plot of â cos è versus 4 sin è. As can be seen from the results in TABLE 1, the values of the average values of D as a function of the milling time indicate that the increasing milling time reducing the average particle size of the produced ZnS nanocrystals from 4.23±0.039 TABLE 1 : Average particle size of ZnS NPs were determined from Williamson-Hull’s formula (Eqn. 1) as a function of grinding period.
Grinding period,(hrs) 1 2 3 4
Figure 3 : TEM images of ZnS NPs milled for 3 hrs, and the inset shows Foucs magnified of ZnS NPs.
D, (nm) 4.23±0.039 3.98±0.48 3.21±0.75 2.95±0.13
nm to 2.95±0.13 nm. FT-IR analysis The FT-IR spectrum for the ZnS NPs as recorded in the rangeof 400-4000 cm-1is presented in Figure 4 for grinding periods investigated. The spectrum shows IR absorption due to the various vibrations involved. The major peaks appeared at 622.2, 1006.5, 1126.7, 1405, 1543, 1621.2, 3001, 3284.3 and 3457 cm-1. Strong interaction of water with the surface of ZnS could be the reason for the respective observed peaks at 3457 and 1621.2 cm-1 due to O-H stretching and O-H bending modes[22]. In fact, the absorbed water is common to all powder samples, which have been exposed to the atmosphere and is more pronounced for high surface area samples as in the present case where the materials are in the nano-scale. The main peak of Zn-S stretching band has been observed at 622.2 cm-1[23]. Nevertheless, the absorption peaks show the presence of different ligands adsorbed on surface of ZnS nanoparticles; e.g., the respective absorption bands at 3284.3 and 3001cm-1 are assigned to N-H stretching and C-H stretching vibration modes. The band at 1006.5 cm-1 is assigned to the deformation and rocking mode of CH3 group[24-27], and the two bands at 1543 and 1405 cm-1 are respectively atNano Sci enc e and Nano Te chnolo gy An Indian Journal
Figure 4 : FT-IR spectra of ZnS NPs milled for different milling periods.
tributed to anti-symmetric COO- stretching and symmetric COO- stretching modes[28]. Thermal characterization To provide more information about the formation mechanism of ZnS NPs, the weight loss (TGA technique) is carried out as a thermal study on the effect of milling period of the as-prepared samples investigated. The samples were analyzed in a platinum pan under N2 atmosphere where the temperature was linearly increased at different rates of 5, 10, 15 and 20 deg/min over the temperature range of 20-800oC. Figure 5 shows the thermogravimetric plots displayed at 10 degree /min as recorded for the as-prepared ZnS NPs at all grinding periods investigated. Figure 6 shows the
NSNTAIJ, 8(3) 2014
M.S.Al-Kotb et al.
87
Full Paper TGA curves for ZnS NPs grinding for 4 hrs as displayed at different rates 5, 10, 15 and 20 deg/min. Two resolved well-defined decomposition steps in the temperature range 36.21- 636.35oC, as shown in Figure 7. The first decomposition step occurred in the temperature range 36.21-74.60 oC with a net weight loss of 3.01 % (Cal.4.5%) which corresponds to the elimination of adsorbed 2H2O molecules on the particle surface, due to the strong water absorption of ZnS. When the temperature is over 200 oC, the mass of sample is almost constant until 490 oC displayed at 10 deg /min
Figure 7 : A scheme of the thermal decomposition steps of ZnS NPs.
as shown in Figure 5, and then the second decomposition step occurred in the temperature range 589.84636.35oC with a weight loss of 15.04% (Calc.16.4%) which corresponds to ZnS is oxidized to ZnO. It can be concluded that ZnS particles possess good thermal stability up to 490 0C. The reaction may describe as follows: Zn (CH3COO)2 + CH3CSNH2 ZnS + CH3COOH + by product
(2)
Thermal stability of ZnS NPs
Figure 5 : TGA at 10 oC/min for ZnS NPs of different milling period.
This section aims at finding the stability condition of the prepared ZnS NPs by milling process. This has been achieved via analyzing the FT-IR (Figure 8a) spectrum and the XRD pattern (Figure 8b) recorded for as-prepared ZnS nano-powders subjected to a heating process under N2 atmosphere in the TGA apparatus up to the first decomposition temperature (490 oC, Figure 8c) at 10 deg/min, before allow to cool to RT. Here, the XRD pattern shown in Figure 8b indicates the presence of the three characteristic diffraction peaks belong to the cubic ZnS phase without any appearance for the presence of ZnO peaks. This means that the ZnS phase is not oxidized to ZnO when heated up to 490oC. This concluding remark is confirmed by the FTIR spectra recorded for the same thermally treated ZnS sample, Figure 8a. Besides, the spectrum shows the absence of C-H stretching peaks, the decrease in O-H stretching, N-H stretching and CH3 rock, and increase in C-N stretch. These modes indicate the presence of resonance interaction between vibrational modes of legend ions and ZnS. ZnO NPs
Figure 6 : TGA of ZnS NPs milled for 4 hrs at different rates.
The structural characterization has, also, been investigated after finishing the decomposition process of the as-prepared ZnS nano-powders; i.e., where the TG Nano Sci enc e and Nano Te chnolo gy An Indian Journal
Solid-state synthesis of ZnS nanoparticle via mechanical milling process
88
NSNTAIJ, 8(3) 2014
Full Paper heating process proceeds up to 800oC. This has been achieved by collecting the residual materials regarding each grinding period that subjected to different heating rates through the TGA scans. Hence, XRD and FT-IR were used for such investigation. The XRD patterns recorded for such treated ZnS materials are shown in Figure 9a for the four grinding periods investigated. The identification of the recorded diffraction peaks refers to a transformation of the zinc blende structure into zincite (ZnO).That is, the diffraction peaks appeared at planes (100), (002), (101), (102), (110) and (103) Figure 9a. represents the six strong diffraction peaks consisted with the standard zinc oxide powder diffraction, file(ZnO, JCPDS file # 77-0191). Such oxidation of ZnS occurred with the exchange reaction between oxygen and sulfur; i.e., 2 ZnS + 3 O2 2 ZnO +2 SO2
(3)
The FT-IR spectra of the same decomposed materials are shown in Figure 9b. The latter refers to a decrease in all legends, absence of Zn-S peak at 622.2 cm-1, and Zn-O peak appears at 447cm-1[14]. Optical characterization Figure 8 : FT-IR spectra of ZnS NPs (a), XRD pattern of ZnS NPs (b) and TGA scan of as-prepared ZnS NPs (c) for 1 hr milling as heated up to 490 oC at 10 deg/min.
Quantum confinement effect Figure 10 shows the optical absorption spectra of the synthesized ZnS QDs grounding in an oscillating
Figure 9 : Grinding-period dependence of XRD patterns (a) and FT-IR (b) for ZnS NPs heated up to 800 oC Nano Sci enc e and Nano Te chnolo gy An Indian Journal
NSNTAIJ, 8(3) 2014
M.S.Al-Kotb et al.
89
Full Paper mill at different grinding period, 1, 2, 3, and 4 hrs. This spectra decleare that all four samples exhibited absorption edges that are blue-shifted with decreasing particle size with grinding period. Such blue shift of the absorption edges for different sized nanocrystals (4.23-2.95) in comparison with that of bulk ZnS (3.68eV) is due to quantum confinement effect of ZnS nanoparticles.So, here and hereafter we will speak about ZnS QDs.
nanoparticles of size 7 nm and 15 nm respectively. Tamrakar et al.[32] reported values of 5.39 eV and 5.63 eV for ZnS prepared with particle size 2.8 nm and 1.63 nm respectively. Selim et al.[21] obtained Eg value 4.30 eV for ZnS QDs with average size of 5.3±0.2 nm in diameter.
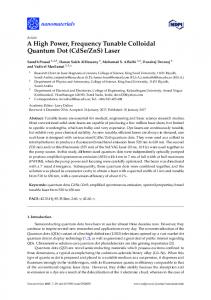
Figure 11 : Least-squares fit for the variation of particle size versus optical band gap (Eg).
Figure 12 illustrates the variation of particle size versus optical band gap as reported by different authors[21,31,32] together with the present. This behavior is related to size quantization effect due to the small size Figure 10: The optical band gap determination of ZnS QDs of the particles. milled for different grinding periods and the inset shows the Photoluminescence (PL) spectra absorption spectra of ZnS QDs. The PL emission spectra of the as-synthesized ZnS The fundamental absorption, which corresponds to QDs milled for 1, 2, 3 and 4 hours were performed and electron excitation from the valence band to conduc- given in Figures 13. Analysis of the spectra indicates strong tion band, can be used to determine the value of the emission bands at about 350 nm and 425 nm and the optical band gap (Eg). The relation between the ab- excitation wavelength was 320 nm. Usually for semisorption coefficient (á) and the incident photon energy conductor nanocrystals, two emission peaks can be ob(hí) can be written by Tauc[29] as: served at the exciton and the trapped luminescence[33]. n áhí=A(hí- Eg) (4) The emission bands shown in the spectra can be attribwhere, A is a constant and the exponent n depends on uted to band gap emission and the strong band gap emisthe type of transition[30] and for direct transitions: n=1/ sion demonstrates the high crystalline nature of the as2. According to Tauc’s relation (Eqn.4), Figure 10 gives synthesized particles, where sample milled for four hours the relation between (áhí)2 and the incident photon showed the strongest PL intensity. It suggested that the energy (hí). Extrapolation of the least-squares fit of smaller the particle diameter was the larger particle surthe linear high absorption portion of the function (áhí)2 face become. And the larger surface caused the stronger = f (hí) to (áhí)2 = 0, defines the value of Eg. Figure photoluminescence intensity. The trapped emission of ZnS 11 illustrates the relation between Eg and particle size QDs shifts to the blue, compared with bulk ZnS. This of the synthesized ZnS QDs at different grinding peri- result is consistent with that observed by[34]. The size ods. This figure respects the increasing rate of Eg with effects of the surface states have been discussed by decreasing particle size. Similarly, the results reported Chestnoy et al.[35]. While the band gap increases as the by Mahamuni et al.[31] and showed absorption peak at particle size decreases, the separation between the elec238 nm (5.2eV) and 258 nm (4.8eV) for ZnS tron-hole states increases. This results in the blue shift of Nano Sci enc e and Nano Te chnolo gy An Indian Journal
90
Solid-state synthesis of ZnS nanoparticle via mechanical milling process
NSNTAIJ, 8(3) 2014
Full Paper abroad blue emission band suggests the defect ZnS structure with sulfur and zinc vacancies[38]. It is believed that these ZnS QDs have promised candidate for potential applications in displays, sensors and lasers. CONCLUSION
Figure 12 : The variation of particle size versus optical band gap for present results together with those published[21, 31,32].
A novel solid–state method is carried out for preparing QDs. Using this method, cubic zinc sulfide QDs of various sizes were prepared simply via grinding the output of the reaction between zinc acetate and TAA powders for different periods (1-4 hrs) at low temperature (RT). Various techniques were used to characterize the structural nature and properties of the product powders. The particle size of the nanoparticles calculated from the XRD patterns has been found to lie in the range 2.95±0.13–4.23±0.039 nm depending on the grinding period. TGA showed that all samples were stable up to 490oC, after which ZnS NPs were found to react with O2 to produce ZnO; this last result is confirmed by XRD and FT-IR analysis. Absorption spectra have been obtained using UV–vis spectrophotometer to find the optical band gap and the obtained values have been found to be in the range 4.24–4.60 eV. The PL of ZnS QDs exhibited blue shift emission, which attributed to size quantization effect due to the small size of the particles. REFERENCES
Figure 13 : Photoluminescence spectrum of ZnS QDs milled for different milling periodsat ëex = 320 nm
the luminescence. Appearance of a broad peak centered at 425 nm is attributed to the presence of sulfur vacancies in the lattice[36]. The other peak centered at 350 nm is due to band to band transition of nanocrystalline ZnS; i.e., to the recombination of electrons at the sulfur vacancy with holes at the valence band[37]. It is seen that, when the size of the nanocrystallites decreases, the luminescence has been found to be dominated by the band impurity. Also, surface passivation by sulfur has resulted in reduced emission intensity of this band indicating involvement of surface defects arising from surface states. The presence of Nano Sci enc e and Nano Te chnolo gy An Indian Journal
[1] L.E.Brus; J.Phy.Chem., 90, 2555 (1986). [2] R.Seoudi, A.Shabaka, W.H.Eisa, B.Anies, N.M.Farage; Physica B, 405, 919 (2010). [3] M.Sharma, S.Kumar, O.pandy; Digest Journal of Nanomaterials and Biostructures, 3, 189 (2008). [4] A.D.Dinsmore, D.S.Hsu, H.F.Gray, S.B.Qadri, Y.Tian, B.R.Ratna; Appl.Phys.Lett., 75, 802 (1999). [5] R.Maity, K.K.Chattopadhyay; Nanotechnology, 15, 812 (2004). [6] J.Tittel, W.Gohde, F.Koberling, Th.Basche, A.Kornowski, H.Weller, A.Eychmuller; J.Phys. Chem.B, 101, 3013 (1997). [7] M.F.Kotkata, A.E.Masoud, M.B.Mohamed, E.A.Mahmoud; Physica E, 41, 1457 (2009). [8] S.Mahamuni, K.Borgohain, B.S.Bendre, V.J.Leppert, S.H.Risbud; J.Appl.Phys., 85, 2861 (1999).
NSNTAIJ, 8(3) 2014
M.S.Al-Kotb et al.
91
Full Paper [9] M.F.Kotkata, A.E.Masoud, M.B.Mohamed, E.A.Mahmoud; Physica E, 41, 640 (2009). [10] D.Denzler, M.Olschewski, K.Sattler; J.Appl.Phys., 84, 2841 (1998). [11] Y.W.Wang, L.D.Zhang, C.H.Liang, G.Z.Wang, X.S.Peng; Chem.Phys.Lett., 357, 314 (2002). [12] J.Cao, J.Yang, Y.Zhang, L.Yang, Y.Wang, M.Wei, Y.Liu, M.Gao, X.Liu, Z.Xie; Journal of Alloys and Compounds, 486, 890 (2009). [13] B.Bhattacharjee, D.Ganguli, K.Iakoubovskii, A.Stesmans, S.Chaudhuri; Bull.Mater.Sci., 25, 175 (2002). [14] H.R.Shakur; Physica E, 44, 641 (2011). [15] W.Tang, D.C.Cameron; Thin Solid Films, 280, 221 (1996). [16] S.Yuan-Yuan, Y.Juan, Q.Ke-Qiang; Trans.Nanferrous Met.Soc., China, 20, 211 (2010). [17] Y.Zhao, J.Hong, J.Zhu; J.Crys.Growth, 270, 438 (2004). [18] L.Chail, Y.C.Zhu, J.Du, G.F.Zou, K.Xiong, Y.T.Qian; J.Chemistry Letters, 34, 1324 (2005). [19] G.K.Williamson, W.H.Hall; Acta Metall., 1, 22 (1953). [20] H.Lu, S.Chu, S.Tan; J.Cryst.Growth, 296, 385 (2004). [21] H.Selim, M.S.Al-Kotb, H.H.Amer, M.F.Kotkata, M.M.H.Khalil; Journal of Radiation Research and Applied Science, 6, in press (2012). [22] N.Goswami, P.Sen; Solid State Comm., 132, 791 (2004). [23] B.S.Rema Devi, R.Raveendran, A.V.Vaidyan; J.Phys., 68, (2007). [24] P.Baraldi, G.Fabbri; Spectrochim.Acta. A Mol.Biomol.Spectrosc., 37, 89 (1981).
[25] K.Scott, Y.Zhang, R.Wang, A.Clearfield; Chem.Mater., 7, 1095 (1995). [26] K.Nakamoto; ‘Infrared and Raman Spectra of Inorganic and Coordination Compounds’, 4th Edition, Wiley, New York, (1986). [27] A.S.Milev, G.S.K.Kannangara, M.A.Wilson; Langmuir, 20, 1888 (2004). [28] Y.Zhang, F.Zhu, J.Zhang, L.Xia; Nanoscale Res.Lett., 3, 201 (2008). [29] J.Tauc, A.Menth; Non-Cryst.Solids, 8, 569 (1972). [30] G.P.Joshi, N.S.Saxena, T.P.Sharma V.Dixit, S.C.K.Mishra; Ind.J.Pure.Appl.Phys., 41, 462 (2003). [31] S.Mahamuni, A.A.Khosravi, M.Kundu, A.Kshirsagar, A.Bedekar, D.B.Avasare, P.Singh, S.K.Kulkarni; J.Appl.Phys., 73, 5237 (1993). [32] R.Tamrakar, M.Ramrakhiani, B.P.Chandra; The Open Nanoscience J., 2, 12 (2008). [33] L.P.Wang, C.Y.Hong; Matr.Res.Bull., 35, 695 (2000). [34] W.Chen, Z.Wang, Z.Lin, L.Lin; Appl.Phys.Lett., 70, 1465 (1997). [35] N.Chestnoy, T.D.Harris, R.Hull, L.E.Brus; J.Phys.Chem., 90, 3393 (1986). [36] P.H.Brose, N.Deshmukh; Mater.Sci., 34, 6087 (1999). [37] S.Kumar, M.A.Khadar, S.K.Dhara, T.R.Ravindran, K.G.M.Nair; Nucl.Instr. and Meth, In Phy.Res.B, 251, 435 (2006). [38] O.Kozak, P.Praus, R.Dvorsky; Chalcogenide Letters, 9, 417 (2012).
Nano Sci enc e and Nano Te chnolo gy An Indian Journal