measuring beam was obtained from a Bausch & Lomb grating monochromator, the normal measuring beam source for the in- strument. Between the sample and ...
Plant Physiol. (1970) 45, 679-683
Some Spectral Properties of Pea Phytochrome in Vivo and in Vitro Received for publication December 22, 1969
MARYLEE S. EVERETr1 AND WINSLOW R. BRIGGS2 Biological Laboratories, Harvard University, Cambridge, Massachusetts 02138 ABSTRACT The transformation difference spectrum for phytochrome (Pr spectrum minus Pfr spectrum) in pea tissue is determined below 560 nanometers and compared with similar data on phytochrome in vitro The difference spectrum in vivo between phytochrome intermediates and Pfr is also shown for comparison with the data on phytochrome solu. tions. These comparisons show that the peaks in the spectra occurring in the blue wave lengths are shifted to shorter wave lengths and are much enhanced when phytochrome is extracted from the cell and placed in solution. The results indicate that the physicochemical state of phytochrome in the cell may be different from that of the extracted pigment.
about 0.1 OD per A (A OD) of phytochrome. A typical tissue sample for spectrophotometric observation could contain 0.2 A (A OD); thus the change in optical density to be expected is of the order of 0.02 OD in a region where the total optical density is between 2 and 3. Since we had available a spectrophotometer designed to measure small absorbancy changes in dense tissue samples, we attempted to observe absorbancy changes related both to phytochrome transformation and to the long-lived phytochrome intermediates described by Briggs and Fork (3, 4) at wave lengths below 560 nm. Such observations might provide information on the state of phytochrome in vivo and could partially explain the difference in the relative effectiveness of blue light for transformation in vivo and in vitro.
MATERUILS AND METHODS Plant Material. Peas (Piswn sativum L. cv Alaska) were soaked in tap water for 4 hr and planted on moist cellulose packing material, Kimpak 6223 (Kimberly-Clark), in plastic refrigerator In many physiological responses mediated by phytochrome, it boxes. The plants were grown in complete darkness at 25 C and has been shown that blue light can evoke reactions similar to 80% relative humidity for 3 days, although occasionally 2- or those caused by red and far red light (1, 2, 13). Such observations 4-day-old plants were used. To prepare a sample, the apical hook led to the hypothesis that both forms of phytochrome, Pr and regions (5 mm) were harvested under dim green light, the Pfr, absorb blue light (1, 2). With the development of methods for plumules were removed, and the sections were placed in a beaker extracting phytochrome, it was indeed found that the pigment on ice. Approximately 150 such sections were chopped into has absorption maxima in the blue spectral regions -Pr at about pieces about 1 mm3 and placed in a chilled cuvette 1.6 cm in diameter. The sections were gently packed so that light attenua370 nm and Pfr at about 400 nm (7, 11, 16). The only detailed observation of the effect of blue light di- tion through the sample was uniform. Total phytochrome conrectly on phytochrome in vivo is Pratt and Briggs' (14) action tent uncorrected for incomplete photoconversion by red light spectrum for phytochrome transformation in corn. This spec- was measured from absorption spectra of the samples after satutrum has peaks for conversion of Pr to Pfr and of Pfr to Pr at rating red and far red irradiation. The average photoreversible about 400 nm and shows that red light is 100 times more efficient phytochrome content of such samples varied between 0.15 and in converting Pr and far red light is 25 times more efficient in 0.20 A (A OD). Phytochrome Isolation. Phytochrome from peas was obtained converting Pfr than blue light. The transformation action spectrum in vitro (7) has peaks in a similar position, but red light is by minor modification of methods described elsewhere (6). only about 6 times more effective in converting Pr and far red is Briefly, 5-day-old etiolated pea seedlings were extracted in 0.05 M about 4 times more effective in converting Pfr than blue light. tris buffer, pH 8.5, with 0.7% 2-mercaptoethanol by brief grindThus, blue light is relatively more effective in vitro than in vivo. ing (30 sec) in a Waring Blendor. The brei was filtered through There have not been reports of red-far red reversible absorb- cheesecloth, and the liquid was centrifuged to remove cell debris. ancy changes in the blue region of the spectrum in vivo. One might The supernatant was brought to 0.01 M with respect to calcium expect observation of such changes to be difficult. Light absorp- chloride to precipitate pectic compounds and recentrifuged. The tion and scattering by plant tissue is high at these shorter wave lengths, and the expected change in absorbancy is small. In fact, final supernatant was then chromatographed on calcium phosan approximation from the published absorption spectra (7, 11, phate gel (brushite), and the active fractions were pooled and 16) indicates that the maximum absorbancy change that might precipitated with ammonium sulfate (40% saturation). Following be expected in the region of the blue phytochrome peaks is centrifugation, the pellet was taken up in a small volume of 0.07 M buffer, dialyzed overnight, centrifuged for clarification, and then used for experimentation. All operations were carried out under 1 Supported by a National Institutes of Health postdoctoral fellowdim green light at 4 C. ship. 2 Supported by National Science Foundation Grants GB-2846 and Approximately the same procedure was used to obtain oat GB-6683 and a grant from the Research Corporation. phytochrome (Avena sativa L., USDA C12020) as was reported 679
680
EVERETT AND BRIGGS
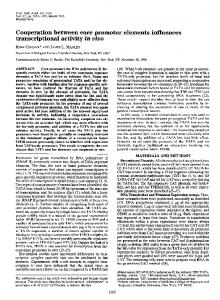
previously (6). The details of the purification procedure will elsewhere, though no differences were noted between samples of greatly differing levels of purity. Spectrophotometry. A single beam spectrophotometer (Biospect 61, Agricultural Speciality Co.) was used to obtain all of the spectral data presented below. The instrument employs a compensator to correct for system response and light scattering, not only enabling one to obtain absorption measurements of tissue, but also allowing one to monitor small absorbancy changes at any given wave length in the visible and near infrared. The basic instrument was modified, as shown in Figure 1, to allow irradiation of the sample with high intensity red or far red light, or a mixture, while simultaneously monitoring spectral changes in the blue region of the spectrum. The low intensity measuring beam was reflected from a half surface mirror through the sample while the high intensity, longer wave length actinic beam came from directly above the sample, passing through the mirror. The actinic light was obtained from a 650-w tungsten iodide lamp (Sylvania DVY) and passed through 5 cm of circulating chilled water. Red light was obtained with Corning filters 2-78 and 2-59, and far red light with Corning filters 7-69 and 2-58. Mixed high intensity red and far red light was obtained with Corning filter 2-64. A manual shutter was placed just below the filters. The measuring beam was obtained from a Bausch & Lomb grating monochromator, the normal measuring beam source for the instrument. Between the sample and the photocell were placed Corning filters 4-96 and 5-59. These filters completely excluded the actinic beam from the photocell but allowed transmittance of the measuring beam at wave lengths between 380 and 570 nm. With this arrangement of light sources and filters, one could readily observe the appearance of phytochrome intermediates upon illumination with mixed red and far red light (3, 4) and could also monitor spectral changes in this spectral region brought about by transformation of phytochrome by red or far red light. The spectrophotometer output was monitored with a Varian F80 x-y recorder. For each experiment, a calibration for optical density was obtained for each wave length with the sample in place, by interposing a known neutral density filter into the measuring beam. Optical density changes of between 2.5 and 5.0 X 10⁻⁴ were above the noise level of the instrument. appear
Plant Physiol. Vol. 45, 1970
RESULTS In Vivo Absorption Spectrum. Pea hook tissue was used for the investigations in vivo since it contains a high concentration of phytochrome (5) and preparation of a sample is relatively easy. Absorption spectra of a sample of pea hooks after saturation with red and with far red light are shown in Figure 2. Most of the effect of light scattering on the spectrum has been compensated for, but the absolute optical densities cannot be determined with this system. Despite the large optical density differences between the red and the far red light-saturated sample above 550 nm, no such differences are detectable below this wave length although from spectra in vitro, as mentioned above, one would expect a change of about 0.02 unit around 420 nm. The peaks in the spectrum below 570 nm probably represent carotenoid, cytochrome, and some chlorophyll absorption. Difference and Intermediate Spectra. Red-far red reversible changes in absorbancy can be observed from 400 to 560 nm in samples of pea tissue by continuous monitoring of each wave length individually; in the same samples long-lived phytochrome intermediates described by Briggs and Fork (3, 4) are produced by cycling the phytochrome with a mixture of high intensity red and far red light. Examples of the reversible absorbancy changes and of the formation and decay of the intermediate signals are presented in Figure 3. In calculations from the data on the reversible absorbancy changes, measurements are always made on the change caused on exposure to far red light rather than to red light for two reasons. First, the absorbancy change on exposing 420
PEA IN VIVO
T
'0.1
O.D.
42 665
A
0
0
~~~735
0
0:~~~~~~~~~~
700
600
500
400
Wavelength (nm)
FIG. 2. Absorption spectra of 0.64 g of pea hook tissue. Spectra measured after saturating red or far red light.
PEA IN VIVO TRANSFORMATION
INTERMEDIATES
x3- R+F I0
4
4 i
I
R F
4 i
#I+
R I
F 44
F ~~~~~R
5x R+F FIG. 1. Diagram of the modified biospect. AL: Tungsten iodide actinic light; WF: circulating cooled water filter; F1: filters to produce red, far red, or mixed red and far red actinic light (see text); SH: shutter; HM: half surface mirror; M: monochromator; S: sample in cuvette; CH: cuvette holder; F2: filters to block actinic beam (see text); PM: photomultiplier.
560
A?
MIN.1
Fio. 3. Examples of the signals observed when the tissue is irradiated with red plus far red light, or red followed by far red light. Absorbancy changes monitored continuously at 430 or 560 nm. T indicates light on; I indicates light off.
Plant Physiol. Vol.
681
PROPERTIES OF PEA PHYTOCHROME
45, 1970
a sample to far red light is completed more rapidly than that on exposure to red light, and second, red light does cause some pigment cycling (3). In these experiments, it is impossible to make observations below 400 nm because the high optical density and light scattering of the tissue drastically reduce the amount of light reaching the photocell. The following arguments indicate that the observed changes in optical density are caused by phytochrome. Placing a tissue sample at room temperature under continuous red light for several hours causes destruction of the phytochrome. In samples treated this way, the extent of loss of photoreversibility measured at 660 and 730 nm was matched by the loss in photoreversible and intermediate signal height at and below 560 nm. Furthermore, absorbancy changes caused by the photosynthetic system seemed not to be a problem in these tissue samples. Although some chlorophyll is formed from the protochlorophyll in the etiolated pea tissue, the absorption spectrum (Fig. 2) shows that chlorophyll is not present in detectable concentration. In addition, the samples were kept in ice-cooled vessels, and a single sample was never used longer than 3 hr so that it is unlikely that functioning photosynthetic units and electron transport chains were formed and present in these samples during experimentation (10, 17). Chlorophyll fluorescence was excluded by the filters placed below the sample. Figure 4 presents the transformation difference spectra for pea phytochrome in vivo and in vitro; the data are plotted as the absorbancy of Pr minus that of Pfr. As noted above, the change in vitro at 420 nm is about 0.1 per A (A OD) of phytochrome. The change in vivo is about 10 times smaller, and the wave length of the minimum in the spectrum is shifted from about 430 nm .n vivo to 413 nm in vitro. Despite these changes, the signal size at 560 nm is about the same in both spectra. Thus, the data indicate that in the absorption spectrum of pea tissue, Figure 2, the change in optical density on phytochrome transformation should be about 0.002 at 430 nm. This change is too small to be observed in recording an absorption spectrum but can be clearly seen with continuous monitoring, at higher sensitivity, of the optical density changes at an individual wave length (Fig. 3). The spectra of the intermediates that form as phytochrome cycles between Pr and Pfr in vivo and in vitro are given in Figure 5. The spectrum for pea phytochrome in solution is very similar to that for oat phytochrome published by Briggs and Fork
Wavelength (nm)
FIG. 4. The transformation difference spectra, Pr Pfr, for extracted pea phytochrome in pH 7.8 phosphate buffer (solid line) and for phytochrome in pea hook tissue, the average of observations on nine tissue samples (broken line).
Wavelength (nm)
FIG. 5. The intermediate spectra observed as phytochrome cycles between Pr and Pfr under mixed red and far red light. In vitro (solid line) extracted pea phytochrome in pH 7.8 phosphate. In vivo (broken line) the average of the signals observed in six different pea hook samples.
(4); the crossover points and minimum are at about 399, 420, and 490 nm for pea phytochrome and at 398, 418, and 485 for oat phytochrome. In comparing the spectra in vivo and in vitro, it again appears that the minimum in vivo falls around 430 nm while in vitro it is at 420 nm and is twice as large. That the small size of the signal in vivo at the minima in both spectra is not an artifact caused, perhaps, by the denseness of the tissue sample, or by low phototube response at low light level, or by stray light is shown in the following way. A cuvette containing a liquid sample of phytochrome having a large, known, photoreversible signal at 420 nm was placed over a tissue sample having a known signal size at 420 nm; the measured photoreversible optical density change of this combination at 420 nm was equal to that expected from the sum of the two separate optical density changes. Another possibility which had to be tested was that a close association of phytochrome both with the lightscattering system of the tissue and with other pigments such as carotenoids, absorbing more at 420 than at 560 nm, might alter the apparent ratio of absorption by phytochrome at the two different wave lengths. To test for this possibility, two samples were prepared, one of hook tissue and one liquid. The reversible absorbancy of both samples following red and far red light was measured at 420 and 560 nm. Then the two samples were combined, and the tissue was thoroughly crushed. The reversible absorbancy of the resulting slurry was then measured at the same two wave lengths. The addition of the light-scattering medium to the liquid sample did indeed differentially amplify the apparent absorption at the two wave lengths, with slightly more amplification at 560 than at 420 nm, but this difference was not nearly enough to account for the almost 10-fold difference in signal height at 420 nm between the transformation difference spectra in vivo and in vitro. Thus, distortion or diminution of signal size by the relatively dense tissue samples appears not to account for the spectral differences observed, though an artifactual explanation cannot be totally eliminated. For comparison with the data already presented, Figure 6 shows the transformation difference spectrum and intermediate spectrum for oat phytochrome. Similar data on such spectra have already been published (4, 9). Extracted oat and pea phytochrome clearly have closely similar spectral properties.
682
EVERETIT AND BRIGGS
50
INTERMEDIATE
-50 ~~
418
TRANSFORMATION
-100
150 413-
Wavelength (nm)
The intermediate and transformation difference sample of oat phytochrome in pH 9 tris buffer. Solid line: FiG. 6.
tion difference spectrum, Pr
int.
spectra for
a
Transforma-
Pfr; broken line: intermediate spectrum,
Pfr.
DISCUSSION A comparison of phytochrome in vivo
the
transformation
difference
spectra for
and in vitro in the red and far red
regions
of the spectrum shows that the two correspond fairly closely (see Fig. 2 and Ref. 9). However, in this laboratory it has been observed that the maxima in the transformation difference spectra for extracted pea and oat phytochrome fall at 665 and 725 nm (H. Rice, personal communication), while in vivo, the peaks are at 665 and 735 (Fig. 2 and Ref. 6). Other differences in the transformation spectra appear in the region of the blue absorption band of phytochrome where the difference spectrum in vivo has a minimum that is much reduced in size and which falls at longer wave lengths compared with that in vitro. This reduction in size provides a partial explanation for the relative ineffectiveness of blue light in transforming phytochrome in vivo (14) and for the approximately 100-fold reduction of the effectiveness
of blue light
as
compared with red light in bringing about
physiological responses mediated by phytochrome (2). Briggs and Fork's studies (3, 4) of the long-lived phytochrome intermediates in extracted oat phytochrome and in oat coleoptiles indicated that there were two species of intermediates present. Since experiments on the kinetics of the signal formation and decay could not be carried out with the experimental arrangement used here, we have no evidence on this point. However, the intermediate spectrum of extracted pea phytochrome closely matches that of extracted oat phytochrome, and so it would appear that similar phenomena are being observed. The difference between the intermediate signals in vivo and in vitro is similar to the difference observed for the transformation spectra in that the minimum in the blue wave lengths is reduced in size and falls at longer wave lengths in vivo.
Plant Physiol. Vol. 45, 1970
intermediates. In addition, the absolute size of the 380 nm signal is smaller than that of the minimum at 413 nm for transformation while the reverse is true for the intermediate signals. These differences indicate that in the intermediate studies we are dealing with absorbing species distinct from Pr and Pfr. The differences between the spectra in vivo and in vitro suggest that phytochrome in the cell is not in the same state as the extracted pigment. The major difference in vivo is the great decrease in signal height below 500 nm relative to the reversibility measured at 665 and 735 nm. One cause that can be proposed for the reduced height of the transformation signal is a reduction in the height of the blue absorption peaks of Pr and Pfr in vivo. This hypothesis is supported by the data of Pratt and Briggs (14) on the action spectrum for phytochrome transformation in corn in which the blue peaks are much reduced in height over those in vitro. However, the effects of light scattering and masking by other pigments could also account for some of the reduction in size of the blue phytochrome peaks observed by Pratt and Briggs. The shift, on extraction, of the minimum of the transformation difference spectrum from approximately 430 nm to below 420 nm suggests that the absorption spectrum of one or both of the forms of phytochrome is altered in vivo compared to that observed in vitro. This change may correspond with the shift, on extraction, of the peak of Pfr from 735 to 725 nm. Alterations of the absorption properties of a pigment in an intact cell as compared with the extracted form of the pigment are not unknown. Chlorophyll a exists in several forms in vivo while on extraction only one form is found; the position of the absorption peaks of chlorophyll a in organic solvents is much different from those found in intact cells (8,15). Yentsch and Guillard's (18) absorption spectrum for chlorophyll b in vivo also shows that the absorption peaks are shifted from those of the extracted form of the pigment and that the height of the Soret peak is decreased relative to the red peak in vivo. However, in general the spectra of biliproteins are not much altered in vivo from those in vitro (12). Among possible reasons for the changed absorption properties of phytochrome in vitro, as indicated by the data presented here, are state of conjugation of the chromophore in the cell, aggregation of the chromoprotein, or an altered environment, possibly hydrophobic, surrounding the pigment. The following are observations relevant to these suggestions. Intermediate and transformation difference spectra in initial crude extracts and increasingly purer preparations of phytochrome are all the same and do not have the in vivo characteristics. Preliminary experiments on the large and small molecular weight aggregates of extracted phytochrome observed by Briggs et al. (6) indicate that the intermediate and transformation difference spectra are identical and are not like the in vivo spectra. In addition, altering the environment of extracted phytochrome by changing viscosity (4), pH, ionic strength, or ionic composition of the medium did not produce a form of phytochrome with the in vivo spectral characteristics noted above. However, further research of this type might demonstrate a form of the pigment similar to that found in the cell. Acknowledgments-The authors are deeply indebted to Mr. Harbert Rice for pro-
In comparing the transformation spectra with the intermediate viding the various phytochrome samples used for the studies in vitro, and to Mr. Cecil spectra, the general similarity of the two is evident despite slight Jackson-White for valuable technical assistance. differences (Figs. 4, 5). For example, the crossover from a posiLITERATURE CITED tive to a negative signal occurs at 500 to 510 nm in the transformation difference spectra and from 480 to 490 nm for the 1. BERTSCH, W. F. 1963. The photoinhibition of growth in etiolated stem segments. intermediate spectra. Other differences are most clearly resolved III. Far-red reversibility of blue light effects in Pisum. Amer. J. Bot. 50: 754-759. in the spectra in vitro since the spectra in vivo have fewer data 2. BORTHWICK, H. A., S. B. HENDRICKs, E. H. TooLE, AND V. K. TOOLE. 1954. Action germination. Bot. Gaz. 115: 205-225. points and do not extend below 400 nm. In vitro the minima in 3. of lightW.onR.lettuce-seed AND D. C. FORK. 1969. Long-lived intermediates in phytochrome BRIGGS, the spectra occur at different wave lengths-A413 nm for transtransformation. I: In vitro studies. Plant Physiol. 44: 1081-1088. formation and 420 nm for intermediates-and the crossover 4. BRiGGs, W. R. AND D. C. FORK. 1969. Long-lived intermediates in phytochrome transformation. II: In vitro and in vivo studies. Plant Physiol. 44: 1089-1094. points are at 388 nm for transformation and 399 nm for the
Plant Physiol. Vol. 45, 1970
PROPERTIES OF PEA PHYTOCHROME
5. BRIGGs, W. R. AND H. W. SIEGELMAN. 1965. Distribution of phytochrome in etiolated seedlings. Plant Physiol. 40: 934-941. 6. BRiGGs, W. R., W. D. ZOLLINGER, AND B. B. PLATZ. 1968. Some properties of phytochrome isolated from dark-grown oat seedlings (Avena sativa L.) Plant Physiol. 43: 1239-1243. 7. BUTLER, W. L., S. B. HENDRICKS, AND H. W. SIEGELMAN. 1964. Action spectra of phytochrome in vitro. Photochem. Photobiol. 3: 521-528. 8. FRENCH, C. S., J. BROWN, L. PRAGER, AND M. LAWRENCE. 1967. Analysis of spectra of natural chlorophyll complexes. Carnegie Inst. Wash. Year B. 67: 536-546. 9. HENDRICKS, S. B., W. L. BUTLER, AND H. W. SIEGELMAN. 1962. A reversible photoreaction regulating plant growth. J. Phys. Chem. 66: 2550-2555. 10. KLEiN, S. 1960. The effect of low temperature on the development of the lamellar system in chloroplasts. J. Biophys. Biochem. Cytol. 8: 529-538. 11. MUMFORD, F. E. AND E. L. JENNER. 1966. Purification and characterization of phytochrome from oat seedlings. Biochemistry 5: 3657-3662.
683
12. 0 HEOCHA, C. 1962. Phycobilins. In: R. A. Lewin, ed., Physiology and Biochemistry of Algae. Academic Press, New York. pp. 421-435. 13. PARKER, M. W., S. B. HENDRICKS, H. A. BORTHWICK, AND N. J. ScuLLY. 1946. Action spectrum for the photoperiodic control of floral initiation of short-day plants. Bot. Gaz. 108: 1-26. 14. PRATT, L. H. AND W. R. BuoGGs. 1966. Photochemical and nonphotochemical reactions of phytochrome in vivo. Plant Physiol. 41: 467-474. 15. SHIBATA, K., A. A. BENSON, AND M. CALv1N. 1954. The absorption spectra of suspensions of living micro-organisms. Biochim. Biophys. Acta 15: 461-470. 16. SIEGELMAN, H. W. AND E. M. FIRER. 1964. Purification of phytochrome from oat seedlings. Biochemistry 3: 418-423. 17. VIRGIN, H. 1955. Protochlorophyll formation and greening in etiolated barley leaves. Physiol. Plant. 8: 630-643. 18. YENTscH, C. S. AND R. GUILLARD. 1969. The absorption of chlorophyll-b in vivo. Photochem. Photobiol. 9: 385-388.