ing images is still up to the user, which is why we call this approach auditory image ..... within a certain 40 Ã 40 window around the center of the image patch.
Sonification of Images for the Visually Impaired using a Multi-Level Approach Michael Banf & Volker Blanz Media Systems Group Institute for Vision & Graphics University of Siegen
ABSTRACT This paper presents a system that strives to give visually impaired persons direct perceptual access to images via an acoustic signal. The user explores the image actively on a touch screen and receives auditory feedback about the image content at the current position. The design of such a system involves two major challenges: what is the most useful and relevant image information, and how can as much information as possible be captured in an audio signal. We address both problems, and propose a general approach that combines low-level information, such as color, edges, and roughness, with mid- and high-level information obtained from Machine Learning algorithms. This includes object recognition and the classification of regions into the categories “man made” versus “natural”. We argue that this multi-level approach gives users direct access to what is where in the image, yet it still exploits the potential of recent developments in Computer Vision and Machine Learning.
Categories and Subject Descriptors H.5.2 [Information interfaces and presentation]: User Interfaces-Auditory (non-speech) feedback
General Terms Human Factors, Design, Experimentation
Keywords Sonification, Visually Impaired, Computer Vision, Machine Learning, Sound Synthesis, Exploration
1.
INTRODUCTION
Helping to make the visual world accessible to visually impaired persons has inspired researchers in Computer Vision for a long time. Perhaps the most ambitious software solution to the vision problem would be an algorithm that produces a semantic description of the image content which
Permission to make digital or hard copies of all or part of this work for personal or classroom use is granted without fee provided that copies are not made or distributed for profit or commercial advantage and that copies bear this notice and the full citation on the first page. To copy otherwise, to republish, to post on servers or to redistribute to lists, requires prior specific permission and/or a fee. AH’13 ,March 07 - 08 2013, Stuttgart, Germany Copyright 2013 ACM 978-1-4503-1904-1/13/03 ...$15.00.
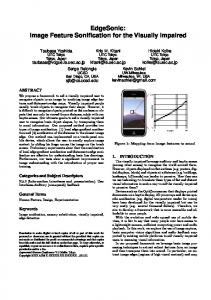
Figure 1: A blind participant during image exploration using our software and a Touch Screen. is then output in natural language on a speech synthesis device. This automated image analysis system would mimick a partner with normal vision who describes the image to the user. However, despite the fact that automated image understanding will remain a challenge to researchers for many years, it would continue to deprive the visually impaired of a direct perceptual experience, an active exploration, and an impression of where things are in the image and what visual appearance they have. Our approach, therefore, is to augment the sensoric capabilities of visually impaired persons by translating image content into sounds. The task of analyzing and understanding images is still up to the user, which is why we call this approach auditory image understanding. Very much like a blind person who explores a Braille text or a bas-relief image haptically with the tip of her finger, our users touch the image (or a touch pad or touch screen) and experience the local properties of the image as auditory feedback. They can use the system to analyze images that they find on the internet, but also for personal photos that their friends or loved ones want to share with them. It is this application scenario that makes the direct perceptual access most valuable. The user feedback that we received for our system indicates that visually impaired persons appreciate the fact that they obtain more than an abstract verbal description and that images cease to be meaningless entities to them. The system presented in this paper is a special case of the more general modular computer vision sonification model [2], which has proposed this direct exploration paradigm in the domain of image sonification for the first time. That work was in contrast to existing sonification frameworks which e.g. help visually impaired navigating through environments [25], [3]. There has been done previous work on the sonification of low-level characteristics of images for visual impaired. The Voice [17] generates sounds depending on a pixel’s lightness and its position within the image. [24] uses color attributes to filter an underlying white noise using Subtractive Synthesis. Rather than color, [26] and [19] sonify the pro-
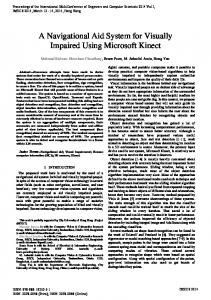
Figure 2: The Visual to Acoustical Processing Pipeline. gression of edges in images. However, all those approaches either focus on single elementary features and/or follow a non explorative paradigm, evaluating the image sequentially from left to right. Unlike previous work on explorative image sonification [2], the focus of this paper is to leverage Computer Vision and Machine Learning algorithms and to derive and sonify image information on many levels, ranging from low-level color information to high-level object recognition. Still, the results of these algorithms remain tied to the image pixel where the feature occurs, so the user always knows what is where, and given the low-level information, associates it to the appearance in terms of color or roughness. To the best of our knowledge, this is the first time that high-level Computer Vision output is presented to the user in this way in order to augment the richness of sensory input. In our system, a global, verbal description of the objects found in the scene is added only to help users to get a quick overview and to warn them what to expect in the image. Our framework has several aspects in common with the one presented in [2]:
data for interactive audible exploration. An approach which helps blind people gaining fundamental image understanding of sceneries. • We develop a fundamental concept of an audible representation of color space that can be used to convey the concept of colors and color mixing to blind people. • We propose an intuitive color sonification concept, representing colors the way they are perceived visually by appropriate fundamental sound characteristics. The concept does not require any MIDI instruments and therefore no external MIDI synthesizer. • We overcome the limits of manual acoustical object recognition, employing machine learning techniques. • Besides colors, we sonify the grade of roughness on classified natural regions using the intuitive acoustical counterpart, brown noise. Additionally we utilize drum rhythms to represent detected man made structures and emphasize occurring single and repetitive edges of various orientations upon those regions.. • We present a stand-alone application, designed to be used by visually impaired people on their personal computer. Thus, the software is easily operable and supported by speech output [20], guiding the user throughout the whole usage of the program.
• The modular sonification system and an pixelwise exploration paradigm, • The sonification of mixtures of colors using combinations of acoustical entities. • Low-level features (edges, roughness), • The usage of sound mixture control parameters ϑ. Main differences are: • Multi-level image analysis paradigm, combining low-, mid- and high-level features in each pixel. • Classification of pixel neighbourhoods into “man-made” versus “natural”. • Automated object recognition (local and global sonification). • The sonification of low-level features at a given pixel depends on the results of high-level classification. • Novel sonification scheme. The sounds associated to visual features (colors, roughness) are selected based on perceptual and semantic considerations. • Using fundamental sound characteristics rather than complex MIDI instruments for color sonification. • Geared to scene understanding, rather than object recognition by the user. On a more general level, the contributions of this paper are: • We present a tool to make the internet more accessible to visually impaired by making available image
1.1
Visual to Acoustical Processing Pipeline
Fig. 2 gives a brief overview over the processing pipeline. For each color pixel I(x, y) of the input image I every information that could be sonified is pre-computed by a set of computer vision algorithms and stored in a data-structure called augmented visual pixel v(x, y). During interactive exploration, based on the user’s current position (x, y) and his selection which features he wants to be sonified, the appropriate elements from v(x, y) are copied into an individual sonification descriptor s. A sequence of those sonification descriptors for all pixels on the exploration trajectory are added to a queue structure. The Queue structure makes sure that no pixels are skipped even for fast motions. In real-time or buffered with a slight delay, the sonification module processes all sonification descriptors from the Queue, turning all elements of each s into a complex, internally synthesized sound, that we call audible pixel a(x, y). v h (x, y) sh (x, y) I(x, y) → v s (x, y) → ss (x, y) → queue → a(x, y) .. .. . .
2.
AUDIBLE COLOR SPACE
For color sonification we we use the HSL model [14], as an intuitive color model, where each color value is described
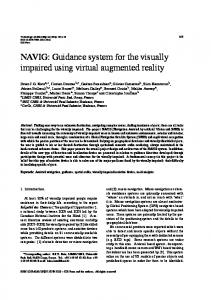
Figure 4: Classification Results. White squares illustrate detected man made structures. Figure 3: Left: Color sonification as in [2] . MIDI Instruments represent opponent colors. Right: Our sonifcation model. Opponent colors are represented by Complementary Sound Characteristics. by hue h, saturation s and lightness l, rather than e.g. the RGB system, as it is more easy to be understood by a congenital blind person. What makes color sonification difficult is the fact that color values often change rapidly from pixel to pixel even if there are only minute variations in textures and materials. Often, the reason is image noise by the camera. It is obvious that such changes clearly overburden a blind user. Therefore we smooth the image patch around the pixel position (x, y) based on bilateral filtering [22], which filters noise while preserving edges within an image. Subsequently, smoothed color values are stored within each augmented visual pixel v(x, y) of the image: vh (x, y) = hbf (x, y), vs (x, y) = sbf (x, y), vl (x, y) = lbf (x, y). Our color sonification concept represents each color value in the HSL model as a mixture of fundamental sound characteristics, inspired by Hering’s theory of opponent colors [11]. In principle, so called complementary sound characteristics represent the opponent color pairs red-green and blue-yellow, as shown in Fig. 3 (right). Later a combination of adjacent sound characteristics represents color mixtures. As no mixture of a pair of opponent colors exists [11], there will be no mixture of a pair of complementary sound characteristics in the sonification model either. Different luminances, ranging from black to white, are represented by a musical scale. For harmonic reasons, we only utilize the whole tones of the octave and map each lightness value l between 0 and 1 to one of the eight tones of the scale. Using such fundamental sound characteristics has several benefits over common MIDI instruments as those used in [2]. First, instruments in general do not give a decent representation of a color’s visually perceived characteristic. Instruments would be associated rather with certain objects, e.g. a choir with a cathedral. In contrast, our fundamental sound characteristics might allow the user to perceive acoustically what correponds to the visual perception of a seeing person. Second, using high quality MIDI instruments requires usage of an external MIDI Synthesizer and additional linkage software as well as a certain level of expertise. According to color theory[12], some colors are visually perceived as warm, such as yellow, opposed to blue, which is perceived as cold. Red is referred to as a vibrant color opposed to rather calm green. Gray would be rather monotonous. We make use of the Synthesis Toolkit (STK) [5], a set of open source audio signal processing and algorithmic synthesis classes, to build our own additive synthesis [21] Model that is able to synthesize such characteristics from scratch. Additionally, doing the complete sound synthesis within the system makes any external synthesizer unnecessary.
2.1
Sound Synthesis
Color sound synthesis starts of with a single (monotonous) sine wave for gray, changing in pitch according to lightness. With red, a tremolo is created adding a second sine wave, just a few Hertz apart. A beat of two very close frequencies (diff. < 5Hz ) creates a tremolo effect. The more red the color turns, the smaller we tune the gap between both frequencies, increasing in speed of the perceived tremolo. To simulate the visual perception of warmth with yellow, we increase the volume of bass as well as the number of additional sine waves (tuned to the frequencies of only the even harmonics of the fundamental sine wave). The bass as well as the even harmonics are acoustically perceived to be warm. The result sounds like an organ. The coldness of blue was originally planned to be sonified adding the odd harmonics which would lead to a square wave, creating a cold and mechanical sound. However the sound so produced is to annoying to be used, so we applied one of the Synthesis Toolkit’s pre-defined instrument models that is able to synthesize a sound of a rough flute or wind. An increase in blue is represented by an increase of the wind instrument’s loudness. Finally, to create an opponent sound characteristic to vibrant red, we represent green, as a calm motion of sound in time using an additional sine wave tuned to a classical third to the fundamental sine wave, forming a third chord, as well as two further sine waves, one tuned almost like the fundamental sine, the other like the second sine, far enough apart to create not the vibrant tremolo effect but a smooth pattern of beats, moving slowly through time.
2.2
Sound Parameter Volumetrics
Calculating mixture relations between our sound elements makes use of volume shape ϑ(h, s), a control entity that was proposed in [2]. A volume shape ϑ(h, s) for each instrument maps a volume ϑ from 0 to 1 to each color (h, s), regardless of l. We make use of this idea to control our sound parameters, except that we consider lightness, and pre-calculate a control parameter value for every sound characteristic at every position within the HSL model, calling it sound parameter volumetric ϑ(h, s, l). The control values that we use to initialize the computation of each sound parameter volumetric from [2] are thought to be applied at luminance level of l = 50%. Hence within each sound parameter volumetric, the value of ϑ(h, s, l) decreases as the color gets lighter or darker. A more in-depth research in the HSL color space revealed two major irregularities: Below 50 % luminance around yellow (h = 60◦ ) there is a certain region that would be visually perceived as olive green. Additionally, a deep blue at h = 240◦ increasing in luminance tends to appear violet visually. In those regions of the color space we had to adjust our control parameters to compensate for the visual perception to fit the audible perception.
Participant Adult Teen. 1 Teen. 2
Figure 5: Histograms for Exp. I. N elements (y axis) recognized in how many sec. (x axis) each.
3.
AUDITORY IMAGE UNDERSTANDING
To allow users to understand more difficult scenes, we incorporate machine learning techniques to pre-evaluate the image, in our case for finding man-made structures and natural regions and post-process them for subsequent sonification.
3.1
Detection of Man-Made Structures in Natural Images
For discrimination of man-made structures from natural regions, we implemented the approach described in [13]. Images are divided into patches of 16×16 pixels each. For each patch, a feature vector is computed based on a histogram of different oriented gradients. A discriminative random field (DRF) is then learned and applied to classify patches by their feature vectors (see Fig. 4 for some exemplary results). The DRF here surpasses regular binary classificators, such as e.g. support vector machines, as it incorporates neighborhood interactions in the labels as well as the observed data. Smooth regions in images are notoriously difficult to classify. We address this issue in the following section.
3.2
Natural Regions Post-Processing
Natural Regions (i.e. those that are not classified as manmade) are evaluated applying a textural roughness measure called fractal dimension (FD). [18] show that the fractal dimension of a surface corresponds closely to our intuitive notion of roughness. Hence, on all natural classified regions we compute the fractal dimension using the bilateral filtered image. The Fractal dimension can be computed via the differential box-counting method [15]. We implemented an improved box-counting method for image fractal dimension estimation developed an proposed recently by [15]. The fractal dimension of 2D regions is between 2.0(a smooth 2D surface) and 3.0 (a perfect 3D cube). Thus, we map our results to 0 to 1. � F Dbf (x, y), if (x,y) ∈ natural region vF D (x, y) = 0, otherwise Note that fractal dimension helps to solve the problem of how to classify smooth regions. As we have those regions labelled as natural, post-processing by FD results in a sonification that corresponds neither to natural nor man-made.
3.3
Man Made Structures Post-Processing
All man made structures are analyzed further to extract additional features that reveal information about internal structures of buildings.
3.3.1
Building Structure using Highest Gradient
From the histogram of gradients in a man-made structure patch, we get the orientation of the highest gradient α1 , applying a local search method, called TABU Search [10].
Hitrate (% , N) 97.5 % (39/40) 97.5 % ,(39/40) 97.5 % ,(39/40)
˜ X 4.5 s 7.5 s 4.5 s
µ 4.4 s 8.3 s 5.1 s
σ 1.6 s 2.9 s 3.7 s
Table 1: Experiment I. Hit rates and times (median ˜ , mean µ, and standard deviation σ in seconds), X for each trial and participant
Resulting orientations α1 are mapped by sin(α1 ) to values between 0(horizontal) and 1(vertical). � sin(α1 ), if (x,y) ∈ manmade structure vα (x, y) = −1, otherwise
3.3.2
Build. Elements using Line Patterns Analysis
We perform an analysis on line junctions and repetitive line patterns of various orientations indicating significant or repeating building elements such as doors or windows. This analysis is inspired by humans grating cells, discovered in 1992 by Von der Heydt et al. [23]. Grating cells respond vigorously to gratings of bars of appropriate orientation, position and periodicity. In contrast, grating cells respond very weakly or not at all to single bars which do not make part of a grating. We employ to state of the art line segment detection algorithms, the line segment detector (LSD) [7] on the bilateral filtered image and the progressive probabilistic hough transform (PPHT) [16] on the gradient image, remove all segments below some minimum length and combine the results of both algorithms, fusing all lines that are parallel and only a pixel’s distance apart. Results are quantized and grouped into 8 orientations of 22.5◦ angular difference between −90◦ and 90◦ . For each image patch within the found man made structure, we compute the sum of parallel lines of all orientations within a certain 40 × 40 window around the center of the image patch. Insertion P sort is applied to find the highest number of parallel lines β for a certain orientation β. � P P if (x,y) ∈ manmade struct. ∧ β > 1 β, vPβ (x, y) = 0, otherwise
3.4
Object Recognition
To help users to identify standard objects in a scene, we employ object detection and recognition algorithms. The OpenCV library [4] offers an implementation of a Bag of Visual Words classification approach developed by [6] as well as the latent SVM detection and localization algorithm proposed by [9]. Both algorithms were trained on the 20 object classes provided by the Visual Object Classes Challenge 2008 (VOC2008) [8]. The detection algorithm by [9] localizes an object within the image, finding an appropriate rectangle around it, while the approach by [6] only gives a certain probability whether an object will be within the image or not. Hence, to save time and reduce false localizations, we apply the latter algorithm first and exclude each object class that was not detected from further localization efforts. After classification, the user is informed via speech output [20] which objects were found (global sonification) in order to make sure he does not miss it during exploration. Finally, we can label each pixel within a found object’s rectangle for local, i.e. pixel-wise sonification. A pixel may belong to
Img 1
Finding Tasks red build.,sky,snow line
2
build.,green lawn,light blue sky,dark blue water
3
building,water,sky
4
buildings, lawn, trees, blue roof, white sky
5
dark red part of build.
Part. Adult Teen. 1 Teen. 2 Adult
Time 12.1 s 19.0 s 25.0 s 17.3 s
Teen. 1 Teen. 2 Adult Teen. 1 Teen. 2 Adult
31.0 23.6 10.6 21.0 20.2 45.0
Teen. 1 Teen. 2 Adult Teen. 1 Teen. 2
12.5 s 10.7 s 16.9 s 6.5 s 8.5 s
3.5.3 s s s s s s
Table 2: Experiment II, see Section 5.2. several objects, e.g: � 1, if (x,y) ∈ detected cat region. vcat (x, y) = 0, otherwise
3.5
Sonification of Complex Features
Sonification of complex features is processed using precomputed wave-files with the irrklang Audio Engine [1]. It allows for post-processing precomputed wave-files with sound effects such as volume change, playback-speed change, pitch change, reverberation, echo, stereo panning and 3D sound positioning. We harness such possibilities to convey complex features audibly along with colors without distortion.
3.5.1
Natural Regions
Natural regions are sonified using brown noise as an acoustical roughness representation. Its spectral density is inversely proportional to f 2 , meaning it has more energy at lower frequencies, which gives brown noise a ”damped” or ”soft” sound, unlike white and pink noise. It sounds like a low roar resembling a waterfall or heavy rainfall. The value of the fractal dimension, which is the corresponding visual pixel descriptor, is directly mapped to the volume of the brown noise. Additionally we make use of stereo panning to support localisation as well as the estimation spatial propagation of natural structures within the image easier.
3.5.2
assuming the same as such of the highest gradient, sonified within the first drum rhythm. Again, we apply stereo panning to represent a man-made structure’s location in the image.
Man-Made Structures
Regions belonging to man-made structures are acoustically represented using two drum sound files, not interfering with color sonification. The first is to represent the pixel element referring to the mapped orientation α1 of the highest gradient. It is altered in pitch and speed depending on whether α1 is more 0◦ (horiz.) or 90◦ (vert.). If no gradient is present, the drum sound is turned off. The second sound first represents the presence of man-made structures per se. If existing, it is also utilized to emphasize any additional occurrence of line patterns. For this purpose, we employ reverberation. Note that the orientation of line patterns is not sonified separately, as the user can guess such orientation by
Objects
The objects that were found by the object recognition algorithm are sonified using familiar auditory icons, such as the ”meow” produced by a cat or the barking of a dog, so no abstract memorization is required. The icon is played whenever the user moves over a pixel region referring to a specific object. Additionally, we use 3D sound positioning to let the sound pass away slightly. Thus, we are able to loop it while the user remains in the object region, so he can shift attention to color or texture features.
4.
SYSTEM DESIGN
The software system evolved into a Windows 7 standalone framework, working internally as a finite state machine. Using Microsoft Speech API [20] the user is kept up to date about the program’s current status. Sonification is implemented via a set of parallel threads, sharing a Sound Queue, a queue of pixel descriptors, which is processed sequentially. The framework comes with a so called sonification folder, typically placed directly onto the desktop, which allows the user to process any common jpeg image from the internet or digital camera. For visually impaired users, the program is designed to be controlled only by a few keys. While operating, the program stays in stand-by state until the user hits the space key. It then tries to load and preprocess (Computation State) the first image found in the sonification folder. Finally it switches to Sonification State, allowing the user to explore the image interactively. A further hit on the space key causes the program to switch back to Computation State and prepare the next image from the folder. Using an additional button, the user can select from a set of combinations of pre-computed features to be sonified. The image pre-processing takes ≈ 10 sec for man made structure detection and post-processing (sections 3.1 - 3.3). Object detection (section 3.4) takes ≈ 15 seconds per object class.
5.
USER STUDIES
In a first set of experiments, we tested a congenital blind, 54 year old adult academic, who had acquired a geometric understanding and sense of space. A second series of tests was performed with 2 congenital blind 14 year old teenagers from a local school. They had little geometric understanding and sense of space. All participants had several hours of experience with a previous system [2] 9 months before, but received only a 10 minutes summary of the changes in the sonification in the current system and almost no training time (approximately 5 minutes of personal interactive exploration) before they started with the experiments. As in [2], we utilized a Touch Screen for all tests (see Fig. 1).
5.1
Experiment I - Obj. Recognition by Color
The goal of the first experiment was to verify that the new color sonification concept is as useful and informative as the one presented in [2]. In a setup similar to [2], the task was to identify objects by color only, while all other sonification
was deactivated. The stimuli were 40 photographs that show one out of four elements (orange, tomato, apple and lemon) in different positions. In each of 40 trials, one image was selected at random and displayed at an arbitrary position on the touch screen. The task of the participant was to find and name the object. In the evaluation (Table 1 and Figure 5), we focus on the time between the moment when the participant finds the object (which depends on where he starts and is therefore not very informative), and the moment when he names the object verbally to the experimenter. Chance level (pure guessing) is 25% in this experiment. The results in Table 1 state that the advanced color sonification approach is as appropriate as the old one was. Further, all participants reported that the advanced color sonification approach was more comfortable, intuitive and discriminable, escpecially in combination with the other sonifications.
5.2
Experiment II - Finding Scene Elements
The second experiment was about finding a set of scene elements named by the experimenter. Table 2 shows the elements to find and the cumulative times per participant per trial for images (stimulus 1 - 5 in Figure 6). Only the sonification of color and “man made” was activated. We only sonified the existence of buildings, no highest gradients nor gratings. Stereo panning was deactivated.
5.3
21
22
23
24
25
26 27
28
Experiment IV - Scene Understanding
Exp. IV was performed by the adult participant. The setup was identical to Exp. III except that sonification of natural regions was additionally turned on. This time, the participant was given 10 images (stimulus 9 - 18 in Figure 6) to explore. A qualitative evaluation can be found in Table 5. The participant was able to detect and interpret all important scene content for 8 out of 10 images. With the other 20%, image 10 and 15, he only mistook the water for sky, which especially with picture 15 is hard to avoid. However, the results seem very promising. Expressed in the words of our adult participant: What amazes me is that I start to develop some sort of a spatial imagination of the scene within my mind which really corresponds with what is shown in the image.
5.5
20
Experiment III - Scene Understanding
Participants were given 3 min. for each of the test images (stimulus 6 - 8 in Figure 6) for exploration, without further information. After that time they were to report what they found in the current image and what their interpretation of the scene was. Sonification was as in Exp. II. A qualitative evaluation can be found in Table 4.
5.4
Img 19
Experiment V - Structure Categorization
Exp. V was performed by the adult participant. All sonification modalities (color, roughness, man made structure (incl. oriented lines and repetitive lines),Stereo Panning) except object recognition were enabled. The participant was given 2 min. for each image (stimulus 19 - 28 in Figure 6) to explore the man made structures an to give an estimation what kind of building type it might be. A qualitative evaluation and comparison to what a seeing person might estimate is given in Table 3. The participant was able to interpret the types of 7 out of 10 buildings correctly.
Categ. Fortress or Church Temple or Church
Audible type categorization The flat compact building complex with tower in the lower right corner could be some sort of fortress . A bigger compact upper part on some sort of pillars or windows. The upper part has some sort of bevel or graded slope. Definitely a kind of temple or gallery. LightMy first impression is a very small house tower in the upper left corner. Might also be a small cabin on top of massive rock. Hotel Definitely a very big sort of manor. Many windows or pillars below the flat orange roof. Maybe some sort of gallery or castle. Fortress A building complex flat to the right, with a tower on the left. Could be a church. Tower Seems to be a delicate bright tower or opened to its right. Church Hotel A flat red building from left to right and equal in height. Above deep blue sky and below deep blue water. Could be some sort of hotel or holiday resort. Temple Small, very flat, bright and many windows. Maybe some sort of bungalow. Cabin Small, in the right corner. Blue water below and woods to the left. A red cabin in the woods. LightSeems to be the lighthouse again, on house first impression. Could be a cabin also. On the left their is some sand-colored structure.
Table 3: Experiment V: Qual. Eval. (comparison of visual and audible building type estimations.)
6.
CONCLUSION
All participants appreciated the system to be very intuitive, easy to understand and quick to learn, and they enjoyed using it. The experimental results indicate that our system could be very useful giving visually impaired persons access to image content: Within a reasonable span of time, they were able to get an overview of what is where in the image, and to identify objects, given some context information about the scene. It is now a realistic application scenario that blind persons can explore personal photos, perhaps together with a friend, and share memories about, say, their vacation. This is due to our paradigm of direct perception and interactive exploration using a very general tool. In contrast, many everyday tasks, such as navigation, are more likely to be the domain of special-purpose tools and a faster, more automated procedure to derive specific relevant information. One of our plans for the future is to replace the expensive Touch Screen by a regular notebook’s Touchpad.
Img 6
Part. Adult Teen. 1 Teen. 2
7
Adult
Teen. 1
Teen. 2 8
Adult
Teen. 1 Teen. 2
Verbally Scene Estimation Lots of green parts, some small buildings within. At the top left is some kind of dark (uncolored) region, maybe belonging to sky or some sort of rock-structure. There seems to be no sky visible in the image, but lots of green natural regions, into which a few small buildings are embedded. There is a lot of green throughout the whole image, which is presumably a meadow or forest. Then there are some small buildings surrounded by meadows. Sky could not be found in any part of the image. Green regions in the lower image part, probably some natural areas followed by a broad section of different colored building structures. In the mid-section of the image there is some red building block with that is surpassing the other building structures, presumably some sort of tower. The tower is surrounded by light blue and white, which might be the sky. There is a meadow in the lower part of the image followed by a building or buildings of various colors. Those buildings are rather flat except for some sort of tower. The main upper part is covered in light blue, supposedly sky. There is some sort of meadow in the lower image part and blue sky in the upper part. In between there is a different colored building section. There is a small building on the mid-right, which is yellow. A bit to the left above the yellow building there is another building. Both buildings are surrounded by various colored non man made structures, which could be a meadow with various bushes or trees illuminated by the sun. On the top left there is a glimpse of light, maybe representing the sky There is a yellow building. A green area beneath the building would presumably by some sort of meadow. The different colored spots surrounding the meadow and the building might be colored trees. There is a yellow building and another more white one. Below the white building is a green area, presumably a meadow. There are yellow areas around and above the buildings, which could be trees.
Table 4: Experiment III: Qualitative Evaluation (verbal descriptions by participants) Img 9 10
11
12
13
14
15
16
17
18
Verbally descripted Scene Estimation There is a rather small, in parts yellowish, building in the midst of the top of an overgrown hill or meadow. The grown region is colored in green, with yellow and red stains. The upper part is light blue, supposedly sky. There is a big block-like slightly red building in the mid-section of the image. Below that building is some green stripe, which might be a lawn. To the right the building seems to be embedded in some ascending rough natural green region with yellow elements. Could be some hilly, sun-illuminated lawn, or trees, reflecting sunlight. The lower part of the image from left to right is some intensive green area. There is a strong contrast in roughness on the right from the smooth green area to a coarser green area in the mid-section. There is some light blue spot, which will be sky, on the top right corner and some outstanding red colored building on the left. There is a smaller band of light blue at the top across the image, supposedly sky. Then there are a few rather small buildings. The rest seams to be natural regions, which besides green and yellow include also some red elements. There is a dark blue spot in the lower left corner of the image, which will be some sort of water, such as a lake. There are to buildings in the upper part of the image, one more to the left, the other more to the right. Both buildings are separated by a more white region. This white region also surrounds the upper parts of both buildings, so it is supposed to be sky. The left building has a slightly reddish roof. The whole lower part of the image is covered by some green-yellowish natural regions, such as lawn or forests. There are to separate or a whole building complex at the center part of the image. The complex seems to be embedded in some sort of green-yellowish natural environment. The lower part is very dark and the the upper part of the image is covered from left to right by some light blue, which will be the sky. In the center of the image is some tower-alike building and a smaller one propagating to the right. The area below the building seems to be green natural environment. The tower is surrounded by blue and white of varying intensities, supposedly sky. The lower part of the image is covered by some yellow-greenish area, supposedly meadows. From the left to the center within the mid-section there are some red buildings with blue roofs. Directly below these buildings there is some yellow band underlying such buildings from left to center. Right to the center building is some intensive green area, presumably a forest. The upper part, completely covered in light blue, should be sky. The mid-section of the image is covered by some building complex. The building is partly yellow, and green on top. Below is a green and yellow region, probably lawn, and above and surrounding the building is blue and white, presumably sky. The lower part of the image from left to right is smooth green, such as a lawn. Then there is a deep blue stripe which is supposedly some sort of water, such as a river. Above the river is a very flat band of buildings, followed by some green natural section. The top region is blue, presumably sky. Table 5: Experiment IV: Qualitative Evaluation (as described by the participant)
Figure 6: Image set for Exp. II - V, taken from the Corel Photo Database.
7.
REFERENCES
[1] ambiera. irrklang - a cross platform sound library. http://www.ambiera.com/irrklang. [2] M. Banf and V. Blanz. A modular computer vision sonification model for the visually impaired. In Proc. of 18th Int. Conf. of Auditory Display, June 2012. [3] G. Bologna et al. Toward local and global perception modules for vision substitution. Neurocomput., 74(8):1182–1190, Mar. 2011. [4] G. R. Bradski. Learning OpenCV: Computer Vision in C++ with the OpenCV Library. O’Reilly Media, 2012. [5] P. R. Cook and G. P. Scavone. The synthesis toolkit (stk), 1999. [6] G. Csurka et al. Visual categorization with bags of keypoints. pages 1–22, 2004. [7] R. G. et al. LSD: a Line Segment Detector. Image Proc. On Line, 2012. [8] M. Everingham et al. The PASCAL Visual Object Classes Challenge. http://pascallin.ecs.soton.ac.uk/challenges/VOC/. [9] P. F. Felzenszwalb et al. Object detection with discriminatively trained part based models. IEEE Trans. on PAMI, 32(9):1627–1645, 2010. [10] F. Glover and M. Laguna. Tabu Search. Kluwer Academic Publishers, Norwell, MA, USA, 1997. [11] E. Goldstein. Sensation and Perception. C. L. Emea, 2009. [12] H. Kueppers. Harmonielehre der Farben. DuMont, Koeln, 2000. [13] S. Kumar and M. Hebert. Discriminative random fields: A discriminative framework for contextual interaction in classification. In In ICCV, pages
1150–1157, 2003. [14] M. Lew. Principles of Visual Information Retrieval. Springer, 2001. [15] J. Li, Q. Du, and C. Sun. An improved box-counting method for image fractal dimension estimation. Pattern Recogn., 42(11):2460–2469, Nov. 2009. [16] J. Matas et al. Robust detection of lines using the prog. prob. hough transform. Comp. Vis. and Img. Underst., 78(1):119 – 137, 2000. [17] P. B. Meijer. An experimental system for auditory image representations. IEEE transactions on bio-medical engineering, 39(2):112–121, 1992. [18] A. Pentland. Fractal-based description of natural scenes. In IEEE Trans. on PAMI, 1984. [19] R. Ramloll et al. Constructing sonified haptic line graphs for the blind student: first steps. In Proc. of the 4th Int. Conf. on Assist. Tech., pages 17–25, 2000. [20] M. Rozak. Microsoft speech api. White paper, Microsoft Systems Journal, 1996. [21] M. Russ. Sound Synthesis and Sampling. Focal, 2008. [22] C. Tomasi and R. Manduchi. Bilateral filtering for gray and color images. In Proc. of the 6th ICCV, 1998. [23] R. v. d. Heydt et al. Periodic-pattern-selective cells in monkey visual cortex. Journ. of Neurosc., 12, 1992. [24] K. van den Doel. Soundview: Sensing color images by kinesthetic audio. pages 303–306. Boston Univ., 2003. [25] J. Xu et al. An outdoor navigation aid system for the visually impaired. In Int. Conf. on Indust. Eng. and Eng. Manag. (IEEM), pages 2435 –2439, dec. 2010. [26] T. Yoshida et al. Edgesonic: Image feature sonification for the visually impaired. In Int. Conf. on the Augm. Human, Tokyo, 2011.