Apr 5, 2016 - C. The discrete wavelet transformation is embedded within the ...... K, Arthur T, Morita D, Jain SV, Mangano FT, Degrauw T, Rose. DF (2012): Ictal MEG .... D, Giannini C, Watson R, Brinkmann BH, Stead M, Worrell. GA (2013): ...
r
Human Brain Mapping 37:2528–2546 (2016)
r
Source Localization of the Seizure Onset Zone From Ictal EEG/MEG Data Giovanni Pellegrino,1,2* Tanguy Hedrich,1 Rasheda Chowdhury,1 Jeffery A. Hall,2 Jean-Marc Lina,3,4,5 Francois Dubeau,2 Eliane Kobayashi,2 and Christophe Grova1,2,4,6 1
Multimodal Functional Imaging Lab, Biomedical Engineering Department, McGill University, Montreal, Qu�ebec, Canada 2 Neurology and Neurosurgery Department, Montreal Neurological Institute, McGill University, Montreal, Qu�ebec, Canada 3 � D�epartement de G�enie Electrique, Ecole de Technologie Sup�erieure, Montreal, Qu�ebec, Canada 4 Centre De Recherches En Math�ematiques, Montreal, Qu�ebec, Canada 5 Centre D’etudes Avanc�ees En M�edecine Du Sommeil, Centre De Recherche De L’h^opital Sacr�e-Coeur De Montr�eal, Montreal, Qu�ebec, Canada 6 Physics Department and PERFORM Centre, Concordia University, Montreal, Qu�ebec, Canada
r
r
Abstract: Introduction: Surgical treatment of drug-resistant epilepsy relies on the identification of the seizure onset zone (SOZ) and often requires intracranial EEG (iEEG). We have developed a new approach for non-invasive magnetic and electric source imaging of the SOZ (MSI-SOZ and ESI-SOZ) from ictal magnetoencephalography (MEG) and EEG recordings, using wavelet-based Maximum Entropy on the Mean (wMEM) method. We compared the performance of MSI-SOZ and ESI-SOZ with interictal spike source localization (MSI-spikes and ESI-spikes) and clinical localization of the SOZ (i.e., based on iEEG or lesion topography, denoted as clinical-SOZ). Methods: A total of 46 MEG or EEG seizures from 13 patients were analyzed. wMEM was applied around seizure onset, centered on the frequency band showing the strongest power change. Principal component analysis applied to spatiotemporal reconstructed wMEM sources (0.4–1 s around seizure onset) identified the main spatial pattern of ictal oscillations. Qualitative sublobar concordance and quantitative measures of distance and spatial overlaps were estimated to compare MSI/ESI-SOZ with MSI/ESI-Spikes and clinical-SOZ. Results: MSI/ESI-SOZ were concordant with clinical-SOZ in 81% of seizures (MSI 90%, ESI 64%). MSISOZ was more accurate and identified sources closer to the clinical-SOZ (P 5 0.012) and to MSI-Spikes (P 5 0.040) as compared with ESI-SOZ. MSI/ESI-SOZ and MSI/ESI-Spikes did not differ in terms of concordance and distance from the clinical-SOZ. Conclusions: wMEM allows non-invasive localizaAdditional Supporting Information may be found in the online version of this article. Contract grant sponsors: Richard and Edith Strauss Canada Foundation (to G.P.) and CIHR; Contract grant number: MOP-93614 and MOP-133619; Contract grant sponsors: NSERC, FRQS, CECR, and American Epilepsy Society Early Career Physician-Scientist award *Correspondence to: Giovanni Pellegrino, Multimodal Functional Imaging Laboratory, Montreal Neurological Institute, McGill UniC 2016 Wiley Periodicals, Inc. V
versity, 332 Duff Medical Building, 3775 University Street, Montreal, QC H3A2B4, Canada. E-mail: giovannipellegrino@ gmail.com Received for publication 20 December 2015; Revised 7 March 2016; Accepted 10 March 2016. DOI: 10.1002/hbm.23191 Published online 5 April 2016 in Wiley Online Library (wileyonlinelibrary.com).
r
wMEM for Ictal Source Imaging
r
tion of the SOZ from ictal MEG and EEG. MSI-SOZ performs better than ESI-SOZ. MSI/ESI-SOZ can provide important additional information to MSI/ESI-Spikes during presurgical evaluation. Hum Brain C 2016 Wiley Periodicals, Inc. V Mapp 37:2528–2546, 2016. Key words: EEG; MEG; epilepsy; seizure; localization; source; magnetic source imaging; electric source imaging; inverse operator; spike r
r
INTRODUCTION Successful surgical treatment of drug resistant epilepsy relies on accurate identification of the brain region where epileptic seizures are generated, i.e. the seizure onset zone (SOZ) [Ansari et al., 2010; Noe et al., 2013; Pittau et al., 2014; Rosenow and Luders, 2001; Ryvlin et al., 2014; Tellez-Zenteno et al., 2005]. The gold standard to identify the SOZ is intracranial EEG (iEEG) [Blount et al., 2008; Engel, 1993; Ryvlin et al., 2014]. This technique allows the direct measurement of electrical cortical activity and disentangling the SOZ from the so-called irritative zone (IZ). The IZ is the brain region generating brief and spontaneous events called spikes that occur between seizures [Kaiboriboon et al., 2012; Pittau et al., 2014; Rosenow and Luders, 2001]. Yet, iEEG is invasive, allowing only restricted spatial coverage guided towards limited target regions [Blount et al., 2008; Cossu et al., 2005; Zumsteg and Wieser, 2000]. Electroencephalography (EEG) and magnetoencephalography (MEG) are complementary non-invasive neurophysiology modalities for presurgical evaluation of epilepsy, which depict whole head electromagnetic brain activity with very high temporal resolution (millisecond scale). Techniques of electric and magnetic source imaging (ESI and MSI, respectively) allow solving an ill-posed inverse problem [Darvas et al., 2004] and converting EEG and MEG signals into information on the localization of epileptic generators along the individual cortical surface extracted from the patient’s MRI [Heers et al., 2016]. MSI and ESI have been mainly used to identify the IZ from spike source localization (MSI/ESI-Spikes) [Kaiboriboon et al., 2012; Pittau et al., 2014]. Indeed, spikes occur more frequently than seizures and are not accompanied by clinical manifestations. IZ provides indirect information about the region to be surgically targeted because of a certain degree of overlap between IZ and SOZ [Rosenow and Luders, 2001]. MSI/ESI-Spikes is to date a clinical tool that can improve presurgical planning of iEEG implantations or even guide resections [Brodbeck et al., 2011; Heers et al., 2014, 2016; Kaiboriboon et al., 2012; Knowlton et al., 2006, 1997; Minassian et al., 1999; Pataraia et al., 2004; Stefan et al., 1993, 2003]. The accuracy of electric and magnetic source imaging of seizures (MSI/ESI-SOZ) is not well established. More specifically, the spatial overlap between interictal and ictal source imaging is unknown. This is very important from a clinical perspective because, despite IEDs originating from multiple
r
or large brain regions (hence multiple or large IZ), surgical removal of much smaller cortical areas that include the SOZ, is sufficient to achieve seizure freedom [Fauser et al., 2009; Guerreiro et al., 1998; Ramantani et al., 2013; Rosenow and Luders, 2001; So et al., 1989a,b; Wyllie et al., 2007]. After more than a decade from the first attempts [Eliashiv et al., 2002; Merlet and Gotman, 2001], MSI/ESI-SOZ is still an open field, limited by the difficulty of recording seizures and by the lack of dedicated approaches for source imaging of these specific signals. Both intracranial and scalp studies have in fact demonstrated that seizures are characterized by very unique properties, with sudden appearance of pathologic rhythmic patterns [Foldvary et al., 2001; Geiger and Harner, 1978; Lee et al., 2000; Perucca et al., 2014; Schiller et al., 1998; Verma and Radtke, 2006] over extended cortical regions [Bartolomei et al., 2008; Engel, 1993; Schiller et al., 1998]. In spite of this, ictal source imaging has been mainly performed applying the equivalent current dipole technique [Assaf et al., 2003; Eliashiv et al., 2002; Medvedovsky et al., 2012; Shiraishi et al., 2001; Stefan et al., 1992; Tilz et al., 2002; Yoshinaga et al., 2004] which assumes spatially restricted generators, does not model the rhythmicity, and can be inaccurate if not even misleading [Catarino et al., 2012; Kobayashi et al., 2005; Yagyu et al., 2010]. A few studies have used distributed source models for ictal EEG [Beniczky et al., 2013; Koessler et al., 2010; Tanaka et al., 2009; Worrell et al., 2000] or MEG [Badier et al., 2016; Tanaka et al., 2009], but they only included small cohorts or a low number of sensors. In order to overcome such limitations, we developed and validated a new distributed source localization approach entitled wavelet-based maximum entropy on the mean (wMEM) that allows accurate localization of oscillatory/ rhythmic activity along the cortical surface [Lina et al., 2014; von Ellenrieder et al., 2016]. wMEM is a timefrequency based extension of the MEM framework [Amblard et al., 2004] that already proved its good performance for MSI/ESI-Spikes, with its unique ability to recover the location and the spatial extent of the underlying generators of epileptic activity [Chowdhury et al., 2013; Grova et al., 2006; Heers et al., 2014, 2016; Pellegrino et al., 2016]. Our goal was to propose a new strategy for MSI/ ESI-SOZ based on wMEM and to assess its performance by measuring spatial concordance with MSI/ESISpikes and the SOZ defined on the basis of iEEG or location of the epileptogenic lesion (denoted here as clinical-SOZ).
2529
r
r
Pellegrino et al.
MATERIALS AND METHODS Patient Selection This study was approved by the Montreal Neurological Institute Research Ethics Board and all patients signed a written informed consent prior to participation. All procedures were performed in agreement with the 1964 Helsinki declaration and its later amendments. We reviewed datasets from all patients who underwent an EEG/MEG recording and who had at least one seizure (either electrographic or clinical). Acquisitions were done at the Psychology Department of the University of Montreal until July 2012 and at Montreal Neurological Institute and Hospital until the included period (2014). Seizures accompanied by head movements larger than 1.5 cm were excluded.
EEG/MEG Acquisitions and Preprocessing Simultaneous EEG/MEG scans were performed using a CTF-MEG-system (MISL, Vancouver, Canada) with 275 MEG gradiometers and 54 EEG electrodes arranged on a cap according to the 10/20 system, plus additional electrodes according to the 10/10 system (F1, FPZ, F2, AF7, AF3, AFZ, AF4, AF8, FT9, FC5, FC3, FC1, FCZ, FC2, FC4, FC6, FT10, C1, C2, CP5, CP3, CP1, CPZ, CP2, CP4, CP6, P9, P1, P2, P10, PO7, PO3, POZ, PO4, PO8—Easy-cap, Herrsching, Germany). Eye movements and heartbeat were monitored using a bipolar montage and dedicated electrodes. EEG electrode positions and the full headshape were digitized using a Polhemus 3D localizer (Colchester, NH). The EEG/MEG acquisition lasted about 1 hour and was performed in a quiet shielded room, with the patient lying down in a supine position. The sampling frequency was either 1,200 Hz or 2,400 Hz and the head position inside the MEG helmet was continuously monitored using three localization coils placed on anatomical landmarks. PA01 was acquired in 2006 with a sampling rate of 600 Hz and without continuous head localization, nonetheless no artifacts possibly suggested the occurrence of head movements around seizure onset. EEG signals were re-referenced offline to bipolar and/or average montage. EEG and MEG data were visually inspected and marked using the DataEditor software (MISL, Vancouver, Canada) by two experienced neurophysiologists (G.P. and E.K.). The spikes were marked at their peak and intra-spike propagation phenomena were ruled out ensuring the stability of the discharge field (topography maps) over the course of the spike, while seizures were marked at the earliest clear change from the background activity [Gotman et al., 1993]. A seizure was defined as a sudden change of “activity that is distinct from the preceding background, followed by an evolution of this activity in both frequency and amplitude” [Verma and Radtke, 2006]. Only the spike type most frequent and concordant with telemetry find-
r
r
ings was chosen for subsequent source localization [Nakasato et al., 1994]. Offline data preprocessing was performed using Brainstorm software [Tadel et al., 2011] and included: third-order spatial gradient noise cancellation, DC removal, 60-Hz Notch filter, bad channels removal, EEG re-reference to average. For MSI/ESI-Spikes the preprocessing also included: downsampling to 600Hz, bandpass filter between 0.3 and 70Hz [Heers et al., 2014, 2016; Pellegrino et al., 2016].
Anatomical MRI and Forward Model The head model for the EEG and MEG source imaging was built from the individual anatomy of each patient. To this aim, we acquired a high resolution anatomical 3T MRI (Siemens Tim Trio 3T scanner), using a T1W MPRAGE sequence (1 mm isotropic 3D images, 192 sagittal slices, 256 3 256 matrix, TE (echo time) 52.98 ms, TR (repetition time) 52.3 s). The MRI was processed using BrainVISA4.2.1 software (http://brainvisa.info/), allowing the segmentation of the surfaces of the skin and of the grey–white matter interface which was then used as the source space for ESI/MSI [Mangin et al., 1995]. The 3T individual anatomical MRI, the skin surface and the cortical mesh tessellated from the gray-white matter interface were imported in the Brainstorm software, where subsequent processing was performed [Tadel et al., 2011]. We constructed individual three-layer BEM surfaces (inner-skull, outer-skull, and skin) and co-registered anatomical and functional data applying a surface fitting between the anatomical head shape derived from the MRI and the head points digitized using the Polhemus system at the time of the EEG/MEG scan. The forward model was computed applying OpenMEEG Boundary Element Method (BEM) [Gramfort et al., 2010] and more specifically its implementation in Brainstorm, using a one-layer boundary element model for MEG (conductivity: 0.33 S/m) and a three-layer BEM model for EEG (conductivity: brain 0.33 S/m, skull 0.165 S/m, and skin 0.33 S/m; brain-to-skull ratio: 1/20) [Gonc¸alves et al., 2003; Heers et al., 2016].
Inverse Solution MSI/ESI-spikes For MSI/ESI-Spikes, we employed the procedure previously described by Heers et al. [2014, 2015]. Briefly, spikes and baseline MEG/EEG data were imported into Brainstorm as segmented signals (2200 ms to 600 ms, 0 ms being the spike peak; 2 s baseline). The inverse problem was solved on averaged spike signals by applying the coherent Maximum entropy on the Mean (cMEM), a method that has been carefully evaluated for its ability to recover the location and the spatial extent of spike sources [Chowdhury et al., 2013; Grova et al., 2006, 2016; Heers et al., 2014, 2016]. cMEM allows localizing EEG or MEG data in the time domain, one time sample after the other
2530
r
r
wMEM for Ictal Source Imaging
r
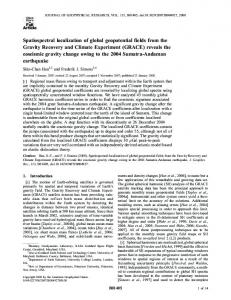
Figure 1. Proposed pipeline for SOZ identification from ictal EEG/MEG recordings. A. Clinical identification of the seizure onset (red arrow) on EEG and MEG signals and selection of a 23 s to 5 s time window. A smaller time window of interest related to the seizure onset is also defined (red square) B. Morlet timefrequency decomposition for the identification of the frequency band of interest (18–35 Hz in this case, red square); GMFP, global mean field power. C. The discrete wavelet transformation is embedded within the wMEM package. Each square corresponds to a frequency band and time window. The discrete wavelet transformation is applied on the 23 s to 5 s time window, 0s being the seizure onset. The time-frequency plane is
denoised considering a 2 s period baseline as reference. Only time-frequency boxes related to ictal oscillations are retained. D. wMEM returns one spatial map for each time-frequency box. E. A spatiotemporal source map is reconstructed from the selected red boxes shown on D, using an inverse wavelet transform. Then PCA is applied on the spatiotemporal map corresponding to the time-window and frequency of interest. Only the first component is retained and presented in E. Final result consists in a single spatial map exhibiting the MSI/ESI-SOZ, as the largest localized amplitude change in a specific frequency band. [Color figure can be viewed in the online issue, which is available at wileyonlinelibrary.com.]
iteratively, and was then particularly appropriate to provide source localization at the peak of the IED. cMEM relies on a reference distribution which represents a prior model of the sources and is constructed prior to the source imaging analysis. The reference distribution is based on a data-driven parcellization of the whole cortex. On each parcel, an index determining whether the parcel is contributing or not to the data is initialized. Based on the index scores which will be updated during cMEM procedure, some parcels can become considered as inactive and be switched off during the source reconstruction, thus reducing the amount of false positive and increasing the overall spatial accuracy. The reader is referred to Chowdhury et al. [2013] for further details on cMEM implementation and evaluation.
MSI/ESI-SOZ
r
The whole procedure of ictal source imaging aimed at localizing changes of oscillatory patterns occurring in specific frequency bands, focusing mainly on the seizure onset. Our proposed procedure consisted of multiple steps that are summarized in Figure 1. The analysis was concentrated on a time window ranging between 23 s and 15 s, considering the seizure onset as 0 s. Such interval was wide enough to allow accurate time-frequency decomposition of the signal of interest while avoiding border effects. Step 1: Selection of the time-frequency range of interest for source imaging. After importing the data in Brainstorm, we used a Morlet transformation to compute a timefrequency decomposition in a frequency window ranging
2531
r
Gender/age
M/33
M/15
F/24
F/24
M/39
M/38
M/30
F/22
M/42
ID
1
2
3
4
5
6
7
8
9
Non-lesional
L anterior cingulate and orbitofrontal FCD
Post Quad double cortex
R orbitofrontal FCD
Non lesional
R F FCD
L anterior F parasagittal FCD
R F Parasagittal FCD
L P FCD
MRI
Facial grimacing, giggling, slight head deviation to either side Sensation of weakness and tiring, staring, loss of consciousness “buzz” sensation head and shoulders (R>L), speech arrest, staring Confusion, speech impairment, head to the R, secondary GTCS
L face and arm clonic movements
Head deviation to the L, then secondary GTCS
Sensory sensation right shoulder L arm asymmetric posture, with extension and elevation. Grimace, head to the L side. Brief and repetitive nocturnal arousal, moaning, sometimes head to the L.
Ictal symptoms
Bil T and bil FC
L FCT
R Post Quad
R FT
R FCT
Bil F, R>L
Bil F, L>R
R FC
L CP
Interictal
Bil FC
L FCT
R Post Quad
R FT
R FCT
Bil F, R>L
Bil F
R FC
L CP
Ictal
Scalp EEG telemetry
3
6
—
5
24
58
2
4
—
Time-span EEG/ MEG-iEEG (mo)
7 L electrodes. Insula Ant, Hipp Ant, Hipp Post, F Ant, orbitofrontal, cingulate Ant, cingulate middle 9 Electrodes (5 L, 4 R). R: hipp, orbitofrontal, gyrus rectus, Cing Ant, Cing Post superior; L: hipp, orbitofrontal, Cing Ant and Cing superior
9 Electrodes (2 L, 7 R). L: orbitofrontal, anterior cingulate; R: frontopolar, orbitofrontal, C A, C middle, SMA Ant, SMA Post, Hipp 8 electrodes (6 R, 2 L). R: Hipp, orbitofrontal, SMA Ant, SMA Post, Cing post, insula; L: SMA Ant, SMA Post 8 R electrodes. Amigdala, Hipp, F Ant, Orbitofrontal, C Ant, C Post, SMA Ant, SMA Post —
8 Electrodes (4 R and 4 L) targeting orbitofrontal, C A, C P, lesion (and contralateral corresponding area)
3, R C A, SMA, FCD
—
No. electrodes and target
TABLE I. Epidemiological and clinical features
Widespread FT, maximum in the L Cing Ant and T Ant L: T neocortical, hipp, sometimes orbitofrontal and Cing Ant
—
Right orbitofrontal lateral
Right FC parasagittal
Maximum left superior cingulate and FCD 1 Bilateral Frontal Bilateral F, Right>L
Lesion
—
Interictal
SEEG
Unclear onset, ictal generator not identified after two implantations
L Cing Ant and T Ant
—
R orbitofrontal lateral
R FC parasagittal
Widespread R F. At times ictal activity starting from L F.
Bil F, maximum in the lesion and perilesional areas.
Lesion
—
Ictal
Large (201.09)
Large (288.84)
Small (23.72)
Small (34.78)
Large (247.22)
Large (132.03)
Small (32.05) small (41.60)
SOZ size (cm2)
Two surgeries/ Engel IV after 1 year
Small Cortical resection/ Engel I after 1 year —
—
—
Cortical resection/Engel 4 after 1 year
Small cortical resection/ Engel IV after 3 years
—
Surgery/ outcome
F/22
F/36
F/21
F/24
10
11
12
13
Non-lesional
Non-lesional
Non-lesional
L post-C FCD
MRI Tingling sensation right shoulder Ill-defined sensation of blurry vision or nonlateralized “bright-spots”, speech arrest, right beating nistagmus, R head deviation, occasional right face twitching Blinking, head to the R, confusion L arm down, uprising chest sensation, complex visual hallucination, blinking.
Ictal symptoms
R Post Quad, L FCT
LF
L Post Quad
L post-C
Interictal
R Post Quad, L FC
LF
L Post Quad
L post-C
Ictal
2
—
1
—
Time-span EEG/ MEG-iEEG (mo)
13 (9 R and 4 L). L: SMA, Cing Ant, Cing Post, hipp. R: hipp, fusiform gyrus, O inferior, Cing, precuneus, SMA, Cing Ant, insula Ant, insula Post
—
9 L electrodes. Cing Ant, amigdala, hipp Ant, hipp Post, fusiform gyrus, Cing Post, pre-cuneus, O superior, O inferior
—
No. electrodes and target
Multifocal
—
L cuneus, lingual girus, fusiform girus, widespread TPO, mesial temporal
—
Interictal
SEEG
Multifocal
—
TPO junction and hippocampus, cuneus.
—
Ictal
Large (183.48)
—
Small (28.10) Large (291.94)
SOZ size (cm2)
—
—
—
—
Surgery/ outcome
L 5 left; R 5 right; Bil 5 bilateral; Ant 5 anterior; Post 5 posterior; F 5 frontal; C 5 central; P 5 parietal; T 5 temporal; O 5 occipital; Post Quad5 posterior quadrant; GTCS: generalized tonic clonic seizure; FCD: focal cortical dysplasia; SMA 5 supplementary motor area; C5 cingulate; HipP 5 hippocampus; Cing 5 cingulate.
Gender/age
ID
Scalp EEG telemetry
TABLE I. (continued).
r
Pellegrino et al.
from 2 Hz to 80 Hz and with a frequency resolution of 1 Hz along the full time window (23 s to 15 s) (Fig. 1A,B). The time-frequency decomposition of all sensors were displayed in a 2D layout for visual inspection. The purpose of this first step was to: (i) check and possibly refine the time of seizure onset, comparing the EEG/MEG time courses with the time frequency plot; (ii) identify possible artifacts in other frequency bands and filter them out using a band-pass filter before applying source localization [Koessler et al., 2010]; (iii) select the frequency band to consider for the ictal source imaging by identifying the largest energy change at the onset [Fujiwara et al., 2012; Gotman et al., 1993]. Step 2: Source imaging within the selected frequency band of interest. After having identified the frequency band of interest, we used the wavelet-based Maximum Entropy on the Mean (wMEM) algorithm [Lina et al., 2014] to compute the inverse solution within the 23 to 5s time window (Fig. 1C,D). wMEM is a time-frequency based extension of cMEM method, that was developed and validated to reconstruct patterns of oscillatory activity in specific frequency bands. wMEM implementation is available in our Brainstorm plugin entitled “Brain Entropy in space and time” (see http://neuroimage.usc.edu/brainstorm/Tutorials/TutBEst). wMEM was considered as the ideal candidate for localizing ictal oscillatory patterns. wMEM applies a discrete wavelet transformation which decomposes the signal into time-frequency boxes. Each time-frequency box corresponds to a given frequency band and a given time window. The use of discrete wavelets has interesting properties since it allows a full representation of the time and frequency of interest with just few coefficients (sparse representation). The wavelet transformation is followed by a data denoising procedure based on a shrinkage [Donoho and Johnstone, 1995], consisting in discarding the smallest wavelet coefficients within the 23 s to 5 s time window. Only the timefrequency boxes exhibiting the highest energy, i.e. accounting for 99% of the total energy of the signal, were therefore selected before applying source localization. wMEM is based on the same source model considered for cMEM. Indeed, wMEM assumes that the generators of the ictal activity are organized along parcels of the whole cortex. Each parcel could be active or not depending on its contribution to the ictal oscillation. For each time-frequency box, the MEM algorithm embedded in wMEM produces a source reconstruction, thus estimating a local wavelet coefficient for each dipolar source along the cortical surface. For each dipolar source, a time course could be regenerated by applying a wavelet inverse transform to those reconstructed wavelet coefficients. By doing so on all dipolar sources along the cortex, we could generate a spatiotemporal map of cortical activity. wMEM is thus providing such a spatiotemporal source map for each selected frequency band of interest.
was to localize the SOZ, we had to convert spatiotemporal maps into the main spatial pattern of the ictal oscillations at seizure onset (Fig. 1E). To do so, we considered a narrow time window around seizure onset [Alkawadri et al., 2013; Assaf and Ebersole, 1997; Kovac et al., 2014; Merlet and Gotman, 2001] and applied principal component analysis (PCA) to the spatiotemporal source maps obtained using wMEM in the frequency band of interest. We selected only the spatial map corresponding to the first PCA component, exhibiting the largest changes in signal variance. The time window around the onset for the PCA lasted from 0.4 s to 1 s and was manually selected to consider most of the onset of ictal activity not contaminated by artifacts. It is therefore not necessary to have a stable change of frequency over time.
Definition of the Clinical-SOZ and IZ The clinical-SOZ was defined on the basis of iEEG [Blount et al., 2008] or epileptogenic MRI lesions [Ding et al., 2007; Kovac et al., 2014; Polkey, 2004; Rosenow and Luders, 2001; Ryvlin et al., 2014; Sutherling et al., 1987; Worrell et al., 2000]. The target regions for iEEG investigations with depth electrodes (Table I) were defined according to clinical semiology, MRI, Positron Emission Tomography, neuropsychology, and scalp EEG findings [Pittau et al., 2014]. The results of the iEEG were evaluated by an expert epileptologist (FD) who defined the location and extension of the clinical-SOZ based on contacts displaying ictal activity and position of the electrodes [Gotman et al., 1993]. Epileptogenic lesions were evaluated on clinical MRI scans, which included T1weighted, T2-weighted and FLAIR sequences. In the presence of an MRI lesion and iEEG ictal activity, the two regions were added and identified as the clinical-SOZ. Based on such information, two expert epileptologists (G.P. and E.K.) manually drew the clinical-SOZ on each patient’s MRI cortical mesh. Finally, the irritative zone (IZ) was defined as the MSI/ESI-Spikes results estimated at the peak of the averaged spike [Heers et al., 2016].
Qualitative Assessment of Performance We manually identified 20 cortical regions according to Agirre-Arrizubieta et al. [2009] (Supporting Information Fig. 1). Sublobar concordance was defined as follows:
Step 3: Summarizing spatiotemporal patterns of seizure onset in a specific frequency band. Since our objective
r
r
2534
� Concordance between MSI/ESI-SOZ (or MSI/ESISpikes) and clinical-SOZ: if the vertex exhibiting the maximum source amplitude (source maximum) of the MSI/ESI-SOZ (or MSI/ESI-Spikes) and the clinicalSOZ belonged to the same cortical region; � Concordance between MSI/ESI-SOZ and MSI/ESISpikes: if the source maximum of MSI/ESI-SOZ and the source maximum of MSI/ESI-Spikes belonged to the same cortical region.
r
r
wMEM for Ictal Source Imaging
Quantitative Assessment of Performance
r
� Minimum distance (Dmin) metric: Dmin was the minimum Euclidean distance expressed in mm between the MSI/ESI-SOZ (or MSI/ESI-Spikes) source maximum and the clinical-SOZ. This definition did not take into account spatial overlaps between source maps and clinical-SOZ. This metric was therefore quite restrictive. � Spatial dispersion (SD) metric: SD measured a combination of spatial spread and localization error of MSI/ ESI-SOZ (or MSI/ESI-Spikes) spatial maps when compared with the clinical-SOZ [Heers et al., 2016; Molins et al., 2008].
MSI/ESI-SOZ or MSI/ESI-spikes versus clinical-SOZ This assessment was based on the following two metrics:
See Appendix for further details on the implementation of these metrics.
MSI/ESI-SOZ versus MSI/ESI-spikes This assessment was based on the following two metrics: � Dmin between (i) MSI-SOZ source maximum and MSI-Spikes source-maximum and (ii) ESI-SOZ source maximum and ESI-Spikes source maximum. � Pearson’s spatial correlation (Corr) between (i) MSISOZ and MSI-Spikes maps and (ii) ESI-SOZ and ESI/ Spikes maps. Correlation coefficients were transformed using the Fishers r-to-z transformation (zCorr 5 (1/2)[ln(1 1 Corr)-ln(1 2 Corr)]) to better approximate Gaussianity and assess differences between MSI/ESI-SOZ and MSI/ESI-Spikes results.
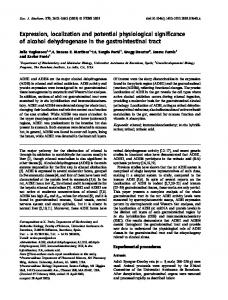
Statistical Analysis Statistical analysis was performed using SPSS Ver. 20 (IBM). v2 tests were used to assess differences of sublobar Figure 2. Ictal MEG and ictal EEG in comparison with the true SOZ. A. Concordance at sublobar level vs clinical-SOZ. The sublobar concordance between MSI/ESI-SOZ and clinical-SOZ was high (81%), ranging between 64% (ESI-SOZ) to 90% (MSI-SOZ). B. Boxplot distribution of Dmin comparing MSI-SOZ and ESI-SOZ. The minimum distance between the maximum of MSI/ESI-SOZ and the clinical-SOZ (Dmin) was lower for MSI-SOZ. This difference was confirmed on the group of patients showing a smaller clinical-SOZ (right panel). C. Boxplot distribution of SD comparing MSI-SOZ and ESI-SOZ. There was no difference in terms of spatial dispersion (SD) between MSI-SOZ and ESI-SOZ. Circles denote values that are farther than 1.5 interquartile ranges; starts denote values that are farther than 3 interquartile ranges. [Color figure can be viewed in the online issue, which is available at wileyonlinelibrary.com.]
r
2535
r
r
Pellegrino et al.
concordance between MSI and ESI and between Spikes and SOZ source imaging. Independent sample t-tests or Mann-Whitney tests were used to test Dmin, SD, and zCorr differences between MSI and ESI and between Spikes and SOZ source imaging. Descriptive statistics were reported as mean 6 standard error of the mean (SEM) unless differently stated. Significance levels were set at P < 0.05. Further details about the statistical analysis are step by step reported in the results section.
RESULTS A total of 31 seizures (16 MEG only and 15 simultaneous EEG/MEG seizures, corresponding to a total of 46 MSI/ESI-SOZ) from 13 patients were evaluated. Number of seizures per patient was: one (N 5 7: PA02, PA03, PA06, PA08, PA09, PA10, PA12), two (N 5 2: PA1, PA11), three (N 5 3: PA04, PA07, PA13), and 11 (N 5 1: PA05). Four of the patients (PA05, PA09, PA10, PA11) had the EEG cap removed during the acquisition due to discomfort or technical reasons. The variance explained by the first PCA component was 38.33% 6 4.47 for MEG and 45.00% 6 3.58 for EEG. There was no significant difference between EEG and MEG (two-tailed independent sample ttest, P > 0.05). The average head movement at seizure onset was less than 1 mm (0.6 mm 6 0.1).
MSI/ESI-SOZ Versus Clinical-SOZ The clinical-SOZ was identified for 11 patients and could therefore be considered to evaluate the results of 29 MSI-SOZ and 14 ESI-SOZ (14 seizures recorded during simultaneous EEG and MEG plus 15 seizures recorded during MEG alone). The size of the clinical-SOZ exhibited a bimodal distribution and was smaller than 50 cm2 for five patients (PA01, PA02, PA05, PA06, PA10) and larger than 100 cm2 for six patients (PA03, PA04, PA07, PA08, PA11, PA13) (Table I). Since the size of the clinical-SOZ might influence the estimation of the source localization performance, after analyzing the whole group, we performed a complementary evaluation on the two subgroups identified as small clinical-SOZ and large clinical-SOZ.
Sublobar concordance At the patient level, the concordance between MSI-SOZ or ESI-SOZ and clinical-SOZ was 10/11 (91%). In further details, MSI-SOZ was concordant with clinical-SOZ for 9/ 11 (82%) patients whereas ESI-SOZ was concordant with clinical-SOZ for 6/8 (75%) patients. For one patient (PA06), neither MSI-SOZ nor ESI-SOZ showed sublobar concordance. For two other patients sublobar concordance was found only on one modality (EEG for PA02 or MEG for PA08). At the patient level, the concordance rate did not significantly differ between MSI and ESI (v2, P >
r
r
0.200). Considering all MSI/ESI-SOZ sources, the overall sublobar concordance with the clinical-SOZ was 81% (MSI 1 ESI 35/43) and the concordance rate did not significantly differ between MSI-SOZ (26/29-90%) and ESI-SOZ (9/14-64%); v2 P > 0.200) (Fig. 2A).
Minimum distance (Dmin) The median of Dmin between the MSI/ESI-SOZ and the clinical-SOZ was 0mm (MSI/ESI-SOZ, median of Dmin 5 0mm, range 5 0–87 mm) suggesting that very often the source maximum was indeed included in the clinical-SOZ (26/43, 60%). MSI-SOZ sources were significantly closer to the clinical-SOZ (median of Dmin 5 0 mm range 5 0– 44 mm) than ESI-SOZ (median of Dmin 5 11 mm, range 5 0–87 mm; Mann-Whitney U-test 5 117.50, P 5 0.012) (Fig. 2B, left).
Spatial dispersion (SD) The SD around the clinical-SOZ of MSI-SOZ was not significantly different from ESI-SOZ (MSI-SOZ SD 5 32 6 2 mm, ESI-SOZ SD 5 30 6 4 mm, two-tailed independent sample t-test, P > 0.200) (Fig. 2C, left).
Complementary analysis on small and large clinicalSOZ In the subgroup of small clinical-SOZ, despite the smaller sample size and the reduced statistical power, we confirmed that the distance (Dmin) from the clinical-SOZ was significantly lower for MSI-SOZ than for ESI-SOZ (Small Clinical-SOZ ESI-SOZ N 5 4, MSI-SOZ N 5 16; Mann-Whitney U 5 11.50, P 5 0.05; Fig. 2B, right). MSISOZ results obtained for small Clinical-SOZ were excellent, since the maximum source amplitude was found within the Clinical-SOZ for 13/16 cases (i.e. corresponding to Dmin 5 0mm). Examples of such excellent concordance results are illustrated on Figures 3 and 4. No other significant differences were found when comparing SD and Dmin metrics between MSI-SOZ and ESI-SOZ.
Reproducibility One patient reported 11 similar seizures in the MEG scanner. This allowed us to evaluate the reliability of our method to localize the MSI-SOZ. The MSI-SOZ maximum was concordant across seizures and always localized within the clinical-SOZ and more precisely in the rostral precentral gyrus (Fig. 3; PA05). Note that MSI-SOZ for all 11 seizures was also concordant with MSI-Spikes.
MSI/ESI-Spikes Concordance With the Clinical-SOZ A total of 19 MSI/ESI-Spikes (11 MSI and 8 ESI) from 11 subjects with defined Clinical-SOZ were considered.
2536
r
Figure 3. PA05. PA05 reported eleven similar seizures in the scanner and allowed us to assess the reliability of the method. Because of the head size, the combined EEG/MEG acquisition was performed using only 19 EEG electrodes hence only MSI-SOZ could be performed. The definition of the clinical-SOZ (first line, left, blue region) was based on 47 iEEG seizures characterized by low-voltage fast discharge in the beta range involving the right precentral parasagittal regions. MSI/ESI-Spikes maximum (first
line, right panel) was in the right parasagittal precentral gyrus. From second line on: all seizures recorded in the scanner (11 seizures, identified by S01 to S11), characterized by sudden appearance of rhythmic fast activity in beta band, maximal over the right central regions. MSI-SOZ showed a consistent generator in the right precentral parasagittal gyrus, in agreement with both MSI-Spikes and iEEG. [Color figure can be viewed in the online issue, which is available at wileyonlinelibrary.com.]
r
Pellegrino et al.
r
Figure 4. PA10. The first ictal sign at seizure onset referred by PA10 was a tingling sensation over the right shoulder, spreading to the right arm and thorax. The analysis of MSI-Spikes (right panel, from up to bottom) pointed towards the left parasagittal postcentral gyrus (right panel, bottom) where a Focal Cortical Dysplasia was found at the MRI (depicted in blue in the mid panel). The MEG seizure was characterized by rhythmic activity around r
20 Hz and 40 Hz (upper panel). MEG-SOZ in beta band pointed towards the left parasagittal post-central region. Both MSI-SOZ and MSI-Spikes were concordant with the clinical-SOZ. In this specific case MSI-Spikes was sufficient and MSI-SOZ did not provide useful additional information. [Color figure can be viewed in the online issue, which is available at wileyonlinelibrary.com.]
2538
r
r
wMEM for Ictal Source Imaging
r
Sublobar concordance
Spatial dispersion (SD)
MSI/ESI-Spikes showed 89% (17/19) sublobar concordance with the clinical-SOZ. No significant differences in sublobar concordance rate were found between ESI-Spikes (7/8-88% sublobar concordance) and MSI-Spikes (10/1191% sublobar concordance) ((v2 test P > 0.200).
The SD around the clinical-SOZ was significantly larger for MSI/ESI-SOZ when compared with MSI/ESI-Spikes (ESI Mann-Whitney U 5 17.00, P 5 0.003; MSI MannWhitney U 5 42.00, P 5 0.000) (Fig. 6B, Right). These results suggested that spatial maps obtained by wMEM followed by PCA selection were perhaps overestimating the underlying spatial extent of the generator, whereas we had already demonstrated that cMEM on Spikes provides accurate reconstruction of the spatial extent.
Minimum distance (Dmin). The median of Dmin distances between MSI/ESI-Spikes and clinical-SOZ was 0 mm (MSI/ ESI-Spikes: median of Dmin 5 0 mm, range 5 0–51 mm). There was no significant Dmin difference between MSISpikes and ESI-Spikes (ESI-Spikes: median 5 0 mm, range 5 0–52 mm; MSI-Spikes: median 5 1 mm, range 5 0–32 mm; Mann-Whitney test P > 0.200).
Spatial dispersion (SD) The median SD around the clinical-SOZ was 16 mm (range 5 1–47 mm) and did not differ significantly between ESI-Spikes and MSI-Spikes (Mann-Whitney test P > 0.200; ESI-Spikes: median 5 13 mm, range 5 3–47 mm; MSISpikes: median 5 16 mm, range 5 1–35 mm).
MSI/ESI-SOZ Versus MSI/ESI-Spikes Sublobar concordance The group analysis at the patient level showed that the concordance rate with the clinical-SOZ was not significantly different between MSI/ESI-SOZ and MSI/ESIspikes (v2 test P > 0.200 for both MSI and ESI). However in PA03, MSI/ESI-SOZ identified the Clinical-SOZ better than MSI/ESI-Spikes (Fig. 5). On the other hand, MSI/ESISOZ results were overall confirmatory of MSI/ESI-Spikes findings. Twelve out of 13 patients (92%) showed at least one sublobar concordance when comparing SOZ and Spike localizations using either MSI or ESI. In further details 7/9 (78%) patients showed ESI-SOZ/ESI-Spikes sublobar concordance and 11/13 (85%) patients showed MSI-SOZ/MSISpikes sublobar concordance. Considering all the sources, it appeared that the MSI-SOZ/MSI-Spikes concordance rate was significantly better than ESI-SOZ/ESI-Spikes concordance rate (MSI: 28/31 – 90.32%; ESI 10/15 66.67%, v2 5 0.394, P 5 0.053) (Fig. 6A).
Dmin When compared with clinical-SOZ, Dmin did not differ between MSI/ESI-SOZ and MSI/ESI-Spikes (MannWhitney test P > 0.200 for both MSI and ESI) (Fig. 6B, Left). However, Dmin between MSI-SOZ and MSI-Spikes was significantly lower than Dmin between ESI-SOZ and ESI-Spikes (for MSI median 5 22 mm, range 5 11–68 mm; for ESI: median 5 41 mm, range 5 9–127 mm; MannWhitney U 5 145.00, P 5 0.040) suggesting better MSI reliability (Fig. 6C, Left).
r
Spatial correlation (zCorr) The spatial correlation (zCorr) between MSI/ESI-SOZ and MSI/ESI-Spikes were marginally better for MSI when compared with ESI, just slightly above the significance threshold (ESI: mean 5 0.24 6 0.06; MSI mean 5 0.35 6 0.03; Student t-test, t 5 2.00, df 5 44, P 5 0.053) (Fig. 6C, Right).
Patients for Whom the Clinical-SOZ was not Available For two patients a proper definition of the clinical-SOZ was not possible. PA09 was a 42-year-old male affected by drug resistant focal epilepsy. Despite two iEEG investigations, the clinical-SOZ was not fully delimited. Nonetheless, MSISOZ was located within a region known to belong to the clinical-SOZ according to the most recent implantation. PA12 was a 21-year-old lady suffering from daily seizures. The anatomical MRI was normal and the clinical presentation not localizing. However telemetry, interictal source imaging and EEG-fMRI results were concordant in suggesting an epileptic focus in the left frontal lobe. MSI/ ESI-SOZ provided source maps in the left dorsal frontal lobe, in agreement with all the other findings.
DISCUSSION The main goal of our investigation was to propose and validate a new approach to non-invasively localize the SOZ from ictal EEG/MEG signals. We demonstrated a very good performance on both EEG and MEG source imaging, with ictal MSI being overall more accurate than ictal ESI. Ictal recordings, when captured, can provide additional relevant information for pre-surgical evaluation of individual drug-resistant epilepsy patients. The vast majority of previous study on ictal source localization were based on small series of less than 10 patients [Assaf et al., 2003; Badier et al., 2016; Ding et al., 2007; Eliashiv et al., 2002; Fujiwara et al., 2012; Ishibashi et al., 1998; Ishii et al., 2008; Kakisaka et al., 2012; Kovac et al., 2014; Oishi et al., 2002; Shiraishi, 2001, 2011; Stefan et al., 1992; Sutherling et al., 1987; Tanaka et al., 2009; Tilz et al., 2002;
2539
r
Figure 5. PA03. MSI/ESI-SOZ is shown in the left panel. From top to bottom: ictal activity recorded during simultaneous MEG (cyan traces) and EEG (pink traces). The onset is marked by the red line. The seizure started with rhythmic fast activity in the beta range, visible on both modalities. The time-frequency decomposition (only one channel showed) suggested the involvement of two frequency bands in the alpha–beta range, with the strongest energy change at about 20 Hz. Both MSI-SOZ and ESI-SOZ sources were in the left frontal lobe, very close to the midline. MSI/ESI-Spikes (right panel) depicted a generator in the left frontal lobe, very anterior for ESI-SOZ. The iEEG (bottom, middle panel, blue region) confirmed a focal epileptogenicity in the left anterior frontal regions, in the area where a focal cortical dys-
plasia had been described on MRI (Table I). Ictal iEEG activity was mainly originating from the lesion and perilesional areas and was characterized by a sudden and diffuse change of background associated with a low-voltage fast discharge in the beta range. For this patient MSI/ESI-SOZ succeeded in finding the seizure onset zone, unveiling only the most significant features found by iEEG. Furthermore, MSI/ESI-SOZ provided better results than MSI/ESI-Spikes. Color scale for interictal/ictal maps is based on the local absolute maximum. All sources have been thresholded showing the signal above the 30% of local maximum. [Color figure can be viewed in the online issue, which is available at wileyonlinelibrary.com.]
Figure 6. Comparison between MSI/ESI-SOZ and MSI/ESI-spikes. A. Ictalinterictal sublobar concordance was higher for MSI, but the difference vs ESI was not statistically significant. B. Boxplot distribution of Dmin (left) and SD (right) comparing MSI/ESI-SOZ and MSI/ESI-Spikes. The minimum distance between the source maximum and the clinical-SOZ did not significantly differ between MSI/ESI-SOZ and MSI/ESI-Spikes (left). The spatial dispersion (SD) was significantly higher for MSI/ESI-SOZ than MSI/ESISpikes (right). C. Boxplot distribution of Dmin (left) and zCorr (right) comparing MSI and ESI. The MSI-SOZ versus MSI-Spikes
source maxima were closer to each other when compared with ESI-SOZ versus ESI-Spikes source maxima (left). No significant difference was found comparing the spatial correlations between ESI-SOZ and ESI-Spikes sources with the spatial correlations between MSI-SOZ and MSI-Spikes sources. Circles denote values that are farther than 1.5 interquartile ranges; starts denote values that are farther than 3 interquartile ranges. [Color figure can be viewed in the online issue, which is available at wileyonlinelibrary.com.]
r
Pellegrino et al.
Yagyu et al., 2010; Yoshinaga et al., 2004]. Encouraging ictal source localization results were obtained by applying techniques originally developed to perform MSI/ESI-Spikes reconstructions for patients showing ictal patterns characterized by repetitive spikes [Eliashiv et al., 2002; Koessler et al., 2010]. As most often ictal patterns consist of rhythmic activity involving various frequencies, the ability to handle the concept of sparsity in both time and space makes our wMEM framework more suitable for determining the sources of seizures. Our approach combined discrete wavelet signal decomposition in time and frequency with MEM-based source localization and was carefully evaluated using realistic simulations involving a combination of spikes and oscillatory patterns at different signal-to-noise ratios in Lina et al. [2014]. Here we demonstrated excellent performance of wMEM when analyzing ictal EEG/MEG recordings, in one of the largest cohort of patients reported so far, reaching 81% sublobar concordance with clinical-SOZ when combining MSISOZ and ESI-SOZ (Fig. 2A). MSI-SOZ and ESI-SOZ showed complementary information, with 9/11 patients with sublobar concordance with clinical-SOZ taking together both modalities. This was probably justified by the different EEG and MEG sensitivity to the orientation of the generator and was in agreement with previous investigations from our and other groups on interictal source imaging of both EEG and MEG [Baumgartner and Pataraia, 2006; Chowdhury et al., 2015; Cohen and Cuffin, 1983; Haueisen et al., 2012; Heers et al., 2014]. Previous ictal source imaging studies have been performed on either MEG or EEG alone. Medvedovsky [Medvedovsky et al., 2012] showed in a large cohort collected across two epilepsy centers that MSI-SOZ using ECD had a sensitivity of up to 90% at lobar level and about 70% at sublobar level. Multiple technical differences, including the choice of source localization method and the definition of cortical regions to assess concordance, make a direct comparison between the two studies not possible. Nevertheless, we found better sublobar concordance (90% MSI-SOZ sublobar concordance with clinical-SOZ). Koessler et al. [2010] performed ESI-SOZ studies in 10 patients using 64 channels EEG prolonged recordings. Using various source localization techniques (moving dipole, rotating dipole, MUSIC, LORETA, and sLORETA), sublobar concordance ranged from 50% to 90%. ECD reached the highest accuracy, which is likely due to the fact that repetitive spikes ictal pattern was observed in 40% of patients, whereas its prevalence in epilepsy patients is only 16% [Foldvary et al., 2001]. In our study, wMEM achieved a sublobar concordance of 75% for individual patients and 65% when considering all ESI-SOZs studies without any a priori identification of specific ictal patterns. A qualitative assessment of sublobar concordance is evidently influenced by arbitrary criteria to define sublobar regions. To avoid that limitation due to subjectivity, we also quantified the distance between the clinical-SOZ and the MSI/ESI-SOZ. Our measurements showed that
r
r
in 60% of our data, MSI/ESI-SOZ localized the ClinicalSOZ without spatial error (i.e., Dmin 5 0 mm). We also demonstrated that MSI-SOZ was superior to ESI-SOZ, with the minimum distance between MSI-SOZ and the Clinical-SOZ being significantly lower than the minimum distance between ESI-SOZ and the Clinical-SOZ (Fig. 2B, left). Note that our EEG head coverage was relatively dense, composed of 54 electrodes and allowed providing a fair MSI/ESI comparison for both ictal and interictal analyses. MSI-SOZ superiority was confirmed by a complementary analysis in patients exhibiting a small Clinical-SOZ, and on the comparison with interictal source imaging where MEG showed higher interictal-ictal sublobar concordance, smaller minimum distance and higher spatial correlation (Fig. 6). Finally, the investigation of 11 similar electrographic MEG seizures in patient #5 (Fig. 3) showed reproducible sources (Fig. 2B), suggesting the excellent reliability of wMEM source localization and of our overall proposed strategy to identify the Clinical-SOZ. MSI-SOZ superiority may be attributed to lesser influence of head conductivity and muscle artifacts (for a review [Kaiboriboon et al., 2012; Plummer et al., 2008]) and also by the fact that we had less ESI-SOZ results for comparison. MEG source estimates are relatively robust against head movements. In our cohort the head movement at seizure onset and during the time window used for the identification of the MSI_SOZ was very small (less than 1 mm on average), but techniques of compensations might be advisable whenever larger movements occur at seizures onset [Medvedovsky et al., 2007; Wehner et al., 2008]. Our cohort does not allow inferences about the role played by the location of the SOZ on the accuracy of EEG and MEG, but, as it happens for interictal source imaging, it is likely that higher accuracy can be achieved for frontal foci [de Jongh et al., 2005; Huiskamp et al., 2010]. Ictal and interictal source imaging showed similar concordance and distance from the clinical-SOZ (Fig. 6). We had already demonstrated that MSI/ESI-Spikes has a very good concordance with the Clinical-SOZ [Heers et al., 2016], showing similar level of accuracy for both EEG and MEG. It is well possible that in this study MSI/ESI-Spikes performance is overestimated because we only selected the spike type most frequently seen in video-EEG monitoring. Altogether our findings suggest that MSI/ESI-SOZ should be applied with optimized inverse solution methods whenever seizures are captured during the recording, as it can improve the non-invasive localization of the epileptic focus (Fig. 5) [Eliashiv et al., 2002; Fujiwara et al., 2012]. Additionally, taking into account both interictal and ictal presurgical findings might be associated with a significantly higher seizure freedom rate in the long term [Mu et al., 2014; Vadera et al., 2013]. In this respect, the spatial extent of the generators plays a key role and MEM-based source localization methods are able to recover it [Grova et al., 2006; Heers et al., 2016].
2542
r
r
wMEM for Ictal Source Imaging
Finally, we found that the MSI/ESI-SOZ spatial dispersion was higher than for MSI/ESI-Spikes (Fig. 6), which could be explained by both biological and methodological reasons. More specifically, very often ictal activity involves larger brain regions than interictal activity [Bartolomei et al., 2008] and despite analysis at the ictal onset, we cannot rule out some propagation phenomena already at that time point when we can visually identify the beginning of the seizure. Since we proposed to summarize the spatiotemporal fluctuation of wMEM results in a specific frequency band by selecting the first PCA component, our summary SOZ map could possibly represent some propagated activity within a small temporal window around the onset. Conversely, it is well possible that selecting only the first PCA component resulted in some level of neglect of the ictal activity and, in turn, to a worse performance. However, this methodological choice appeared to be a reasonable compromise and has not impaired our spatial accuracy (see Supporting Information Figs. 2 and 3). Future studies should consider different solutions to summarize the seizure onset zone in a single spatial map. On the other hand, spike localizations were assessed only at the peak of the spike, therefore reporting more accurately the true spatial extent of the underlying epileptic generators [Heers et al., 2016].wMEM offers the possibility to study the spatiotemporal evolution of the generators of ictal patterns in different frequency bands. Such promising investigations will be considered in our future studies.
CONCLUSIONS Our investigation proved that wMEM allows to noninvasively and accurately localize the SOZ from ictal EEG and MEG recordings. Ictal MEG is more accurate than ictal EEG when compared with clinical information on the location of the SOZ. Interictal and ictal source imaging show a good overall concordance. Ictal source imaging, whenever available, can bring additional information and might be of help to further guide iEEG implantation in patients with non-focal EEG abnormalities or even avoid the need for invasive procedures in some cases where a lesion is visible in the MRI.
APPENDIX : SPATIAL DISPERSION (SD) METRIC As originally proposed by Molins et al. [2008], the spatial dispersion SD is a metric characterizing the spatial spread of a current source density map around a reference region H considered as a Gold Standard. In our context, the reference region H was the clinical-SOZ. Let ^j be the vector corresponding to the current source spatial map to be evaluated (e.g. spatial summary map estimated using PCA after wMEM for MSI/ESI-SOZ or current density map at the peak of the spike for MSI/ESI-Spikes). Let us denote as ^j i the amplitude of this current density distribution estimated for the dipolar source i. To measure SD for this solution, we weighted the amplitude of all the p cortical sources by their minimum distance from the set H of
r
r
all the dipolar sources belonging to the clinical-SOZ using the following formula: vffiffiffiffiffiffiffiffiffiffiffiffiffiffiffiffiffiffiffiffiffiffiffiffiffiffiffiffiffiffiffiffiffiffiffiffiffiffiffiffiffiffiffi uP u p ðmin D Þ2^j 2 u i51 j2H ij i SD 5 t Pp ^2 j i51 i � � where minj2H Dij provides the minimum distance between the source i and the closest dipolar source of the clinical-SOZ. A minimal value of SD is found when most of the energy of the source distribution is located within the reference region of interest, i.e. the clinical-SOZ. On the other hand a source localization method providing either too much spatial spread around the reference region H or too much localization error (far from H) will result in high SD values.
ACKNOWLEDGMENTS GP is currently funded by Richard and Edith Strauss Canada Foundation. Study supported by CIHR (MOP-93614 and MOP-133619), NSERC, FRQS, CECR, and American Epilepsy Society Early Career Physician-Scientist award.
REFERENCES Agirre-Arrizubieta Z, Huiskamp GJ, Ferrier CH, van Huffelen AC, Leijten FS (2009): Interictal magnetoencephalography and the irritative zone in the electrocorticogram. Brain 132:3060–3071. Alkawadri R, Krishnan B, Kakisaka Y, Nair D, Mosher JC, Burgess RC, Alexopoulos AV (2013): Localization of the ictal onset zone with MEG using minimum norm estimate of a narrow band at seizure onset versus standard single current dipole modeling. Clin Neurophysiol 124:1915–1918. Amblard C, Lapalme E, Lina JM (2004): Biomagnetic source detection by maximum entropy and graphical models. IEEE Trans Biomed Eng 51:427–442. Ansari SF, Maher CO, Tubbs RS, Terry CL, Cohen-Gadol AA (2010): Surgery for extratemporal nonlesional epilepsy in children: A meta-analysis. Child Nerv Syst 26:945–951. Assaf BA, Ebersole JS (1997): Continuous source imaging of scalp ictal rhythms in temporal lobe epilepsy. Epilepsia 38:1114– 1123. Assaf BA, Karkar KM, Laxer KD, Garcia PA, Austin EJ, Barbaro NM, Aminoff MJ (2003): Ictal magnetoencephalography in temporal and extratemporal lobe epilepsy. Epilepsia 44:1320– 1327. Badier JM, B�enar CG, Woodman M, Cruto C, Chauvel P, Bartolomei F, Gavaret M (2016): Ictal magnetic source imaging in presurgical assessment. Brain Topogr 29:182–192. Bartolomei F, Chauvel P, Wendling F (2008): Epileptogenicity of brain structures in human temporal lobe epilepsy: A quantified study from intracerebral EEG. Brain 131:1818–1830. Baumgartner C, Pataraia E (2006): Revisiting the role of magnetoencephalography in epilepsy. Curr Opin Neurol 19:181–186. ˚ keson P, Pedersen B, Beniczky S, Lantz G, Rosenzweig I, A Pinborg LH, Ziebell M, Jespersen B, Fuglsang-Frederiksen A (2013): Source localization of rhythmic ictal EEG activity: A study of diagnostic accuracy following STARD criteria. Epilepsia 54:1743–1752.
2543
r
r
Pellegrino et al.
Blount JP, Cormier J, Kim H, Kankirawatana P, Riley KO, Knowlton RC (2008): Advances in intracranial monitoring. Neurosurg Focus 25:E18. Brodbeck V, Spinelli L, Lascano AM, Wissmeier M, Vargas MI, Vulliemoz S, Pollo C, Schaller K, Michel CM, Seeck M (2011): Electroencephalographic source imaging: A prospective study of 152 operated epileptic patients. Brain 134:2887–2897. Catarino CB, Vollmar C, Noachtar S (2012): Paradoxical lateralization of non-invasive electroencephalographic ictal patterns in extra-temporal epilepsies. Epilepsy Res 99:147–155. Chowdhury RA, Lina JM, Kobayashi E, Grova C (2013): MEG source localization of spatially extended generators of epileptic activity: Comparing entropic and hierarchical bayesian approaches. PloS One 8:e55969. Chowdhury RA, Zerouali Y, Hedrich T, Heers M, Kobayashi E, Lina JM, Grova C (2015): MEG-EEG information fusion and electromagnetic source imaging: from theory to clinical application in epilepsy. Brain Topogr 28:785–812. Cohen D, Cuffin BN (1983): Demonstration of useful differences between magnetoencephalogram and electroencephalogram. Electroencephalogr Clin Neurophysiol 56:38–51. Cossu M, Cardinale F, Castana L, Citterio A, Francione S, Tassi L, Benabid AL, Lo Russo G (2005): Stereoelectroencephalography in the presurgical evaluation of focal epilepsy: A retrospective analysis of 215 procedures. Neurosurgery 57: 706–718. Darvas F, Pantazis D, Kucukaltun-Yildirim E, Leahy RM (2004): Mapping human brain function with MEG and EEG: methods and validation. Neuroimage 23:S289–S299. de Jongh A, de Munck JC, Gonc¸alves SI, Ossenblok P (2005): Differences in MEG/EEG epileptic spike yields explained by regional differences in signal-to-noise ratios. J Clin Neurophysiol 22:153–158. Ding L, Worrell GA, Lagerlund TD, He B (2007): Ictal source analysis: localization and imaging of causal interactions in humans. Neuroimage 34:575–586. Donoho DL, Johnstone IM (1995): Adapting to unknown smoothness via wavelet shrinkage. J Am Stat Assoc 90:1200–1224. Eliashiv DS, Elsas SM, Squires K, Fried I, Engel J Jr. (2002): Ictal magnetic source imaging as a localizing tool in partial epilepsy. Neurology 59:1600–1610. Engel J Jr. (1993): Intracerebral recordings: organization of the human epileptogenic region. J Clin Neurophysiol 10:90–98. Fauser S, Sisodiya SM, Martinian L, Thom M, Gumbinger C, Huppertz HJ, Hader C, Strobl K, Steinhoff BJ, Prinz M, Zentner J, Schulze-Bonhage A (2009): Multi-focal occurrence of cortical dysplasia in epilepsy patients. Brain 132:2079–2090. Foldvary N, Klem G, Hammel J, Bingaman W, Najm I, Luders H (2001): The localizing value of ictal EEG in focal epilepsy. Neurology 57:2022–2028. Fujiwara H, Greiner HM, Hemasilpin N, Lee KH, Holland-Bouley K, Arthur T, Morita D, Jain SV, Mangano FT, Degrauw T, Rose DF (2012): Ictal MEG onset source localization compared with intracranial EEG and outcome: Improved epilepsy presurgical evaluation in pediatrics. Epilepsy Res 99:214–224. Geiger LR, Harner RN (1978): EEG patterns at the time of focal seizure onset. Arch Neurol 35:276–286. Gonc¸alves S, De Munck JC, Verbunt J, Bijma F, Heethaar RM, Lopes da Silva F (2003): In vivo measurement of the brain and skull resistivities using an EIT-based method and realistic models for the head. IEEE Trans Biomed Eng 50:754–767.
r
r
Gotman J, Levtova V, Farine B (1993): Graphic representation of the EEG during epileptic seizures. Electroencephalogr Clin Neurophysiol 87:206–214. Gramfort A, Papadopoulo T, Olivi E, Clerc M (2010): OpenMEEG: Opensource software for quasistatic bioelectromagnetics. Biomed Eng Online 9:45. Grova C, Daunizeau J, Lina JM, Benar CG, Benali H, Gotman J (2006): Evaluation of EEG localization methods using realistic simulations of interictal spikes. Neuroimage 29:734–753. Grova C, Aiguabella M, Zelmann R, Lina JM, Hall JA, Kobayashi E. (2016): Intracranial EEG potentials estimated from MEG sources: A new approach to correlate MEG and iEEG data in epilepsy. Hum Brain Mapp doi:10.1002/hbm.23127. [Epub ahead of print]. Guerreiro MM, Andermann F, Andermann E, Palmini A, Hwang P, Hoffman HJ, Otsubo H, Bastos A, Dubeau F, Snipes GJ, Olivier A, Rasmussen T (1998): Surgical treatment of epilepsy in tuberous sclerosis: Strategies and results in 18 patients. Neurology 51:1263–1269. Haueisen J, Funke M, Gullmar D, Eichardt R (2012): Tangential and radial epileptic spike activity: Different sensitivity in EEG and MEG. J Clin Neurophysiol 29:327–332. Heers M, Chowdhury RA, Hedrich T, Dubeau F, Hall JA, Lina JM, Grova C, Kobayashi E (2016): Localization accuracy of distributed inverse solutions for electric and magnetic source imaging of interictal epileptic discharges in patients with focal epilepsy. Brain Topogr 29:162–181. Heers M, Hedrich T, An D, Dubeau F, Gotman J, Grova C, Kobayashi E (2014): Spatial correlation of hemodynamic changes related to interictal epileptic discharges with electric and magnetic source imaging. Hum Brain Mapp 35:4396–4414. Huiskamp G, Agirre-Arrizubieta Z, Leijten F (2010): Regional differences in the sensitivity of MEG for interictal spikes in epilepsy. Brain Topogr 23:159–164. Ishibashi H, Morioka T, Shigeto H, Nishio S, Yamamoto T, Fukui M (1998): Three-dimensional localization of subclinical ictal activity by magnetoencephalography: Correlation with invasive monitoring. Surg Neurol 50:157–163. Ishii R, Canuet L, Ochi A, Xiang J, Imai K, Chan D, Iwase M, Takeda M, Snead OC, 3rd Otsubo H (2008): Spatially filtered magnetoencephalography compared with electrocorticography to identify intrinsically epileptogenic focal cortical dysplasia. Epilepsy Res 81:228–232. Kaiboriboon K, Luders HO, Hamaneh M, Turnbull J, Lhatoo SD (2012): EEG source imaging in epilepsy–practicalities and pitfalls. Nat Rev Neurol 8:498–507. Kakisaka Y, Wang ZI, Mosher JC, Dubarry AS, Alexopoulos AV, Enatsu R, Kotagal P, Burgess RC (2012): Clinical evidence for the utility of movement compensation algorithm in magnetoencephalography: Successful localization during focal seizure. Epilepsy Res 101:191–196. Knowlton R, Laxer K, Aminoff M, Roberts T, Wong S, Rowley H (1997): Magnetoencephalography in partial epilepsy: Clinical yield and localization accuracy. Ann Neurol 42:622–631. Knowlton RC, Elgavish R, Howell J, Blount J, Burneo JG, Faught E, Kankirawatana P, Riley K, Morawetz R, Worthington J, Kuzniecky RI (2006): Magnetic source imaging versus intracranial electroencephalogram in epilepsy surgery: A prospective study. Ann Neurol 59:835–842. Kobayashi K, Yoshinaga H, Ohtsuka Y, Gotman J (2005): Dipole modeling of epileptic spikes can be accurate or misleading. Epilepsia 46:397–408.
2544
r
r
wMEM for Ictal Source Imaging
Koessler L, Benar C, Maillard L, Badier JM, Vignal JP, Bartolomei F, Chauvel P, Gavaret M (2010): Source localization of ictal epileptic activity investigated by high resolution EEG and validated by SEEG. Neuroimage 51:642–653. Kovac S, Chaudhary UJ, Rodionov R, Mantoan L, Scott CA, Lemieux L, Wehner T, Scherg M, Diehl B (2014): Ictal EEG source imaging in frontal lobe epilepsy leads to improved lateralization compared with visual analysis. J Clin Neurophysiol 31:10–20. Lee SA, Spencer DD, Spencer SS (2000): Intracranial EEG seizureonset patterns in neocortical epilepsy. Epilepsia 41:297–307. Lina JM, Chowdhury R, Lemay E, Kobayashi E, Grova C (2014): Wavelet-based localization of oscillatory sources from magnetoencephalography data. IEEE Trans Biomed Eng 61:2350– 2364. Mangin JF, Frouin V, Bloch I, R�egis J, L� opez-Krahe J (1995): From 3D magnetic resonance images to structural representations of the cortex topography using topology preserving deformations. J Math Imaging Vis 5:297–318. Medvedovsky, M., Taulu, S., Bikmullina, R., Paetau, R. (2007) Artifact and head movement compensation in MEG. Neurol Neurophysiol Neurosci 4:1–10. Medvedovsky M, Taulu S, Gaily E, Metsahonkala EL, Makela JP, Ekstein D, Kipervasser S, Neufeld MY, Kramer U, Blomstedt G, Fried I, Karppinen A, Veshchev I, Roivainen R, Ben-Zeev B, Goldberg-Stern H, Wilenius J, Paetau R (2012): Sensitivity and specificity of seizure-onset zone estimation by ictal magnetoencephalography. Epilepsia 53:1649–1657. Merlet I, Gotman J (2001): Dipole modeling of scalp electroencephalogram epileptic discharges: Correlation with intracerebral fields. Clin Neurophysiol 112:414–430. Minassian BA, Otsubo H, Weiss S, Elliott I, Rutka JT Snead OC III (1999): Magnetoencephalographic localization in pediatric epilepsy surgery: Comparison with invasive intracranial electroencephalography. Ann Neurol 46:627–633. Molins A, Stufflebeam SM, Brown EN, Hamalainen MS (2008): Quantification of the benefit from integrating MEG and EEG data in minimum l2-norm estimation. Neuroimage 42:1069– 1077. Mu J, Rampp S, Carrette E, Roessler K, Sommer B, Schmitt FC, De Tie`ge X, Hamer H, Boon P, Pauli E (2014): Clinical relevance of source location in frontal lobe epilepsy and prediction of postoperative long-term outcome. Seizure 23:553–559. Nakasato N, Levesque MF, Barth DS, Baumgartner C, Rogers RL, Sutherling WW (1994): Comparisons of MEG, EEG, and ECoG source localization in neocortical partial epilepsy in humans. Electroencephalogr Clin Neurophysiol 91:171–178. Noe K, Sulc V, Wong-Kisiel L, Wirrell E, Van Gompel JJ, Wetjen N, Britton J, So E, Cascino GD, Marsh WR, Meyer F, Horinek D, Giannini C, Watson R, Brinkmann BH, Stead M, Worrell GA (2013): Long-term outcomes after nonlesional extratemporal lobe epilepsy surgery. JAMA Neurol 70:1003–1008. Oishi M, Kameyama S, Morota N, Tomikawa M, Wachi M, Kakita A, Takahashi H, Tanaka R (2002): Fusiform gyrus epilepsy: The use of ictal magnetoencephalography. Case report. J Neurosurg 97:200–204. Pataraia E, Simos PG, Castillo EM, Billingsley RL, Sarkari S, Wheless JW, Maggio V, Maggio W, Baumgartner JE, Swank PR, Breier JI, Papanicolaou AC (2004): Does magnetoencephalography add to scalp video-EEG as a diagnostic tool in epilepsy surgery? Neurology 62:943–948.
r
r
Perucca P, Dubeau F, Gotman J (2014): Intracranial electroencephalographic seizure-onset patterns: Effect of underlying pathology. Brain 137:183–196. Pellegrino G, Machado A, von Ellenrieder N, Watanabe S, Hall JA, Lina J-M, Kobayashi E, Grova C (2016): Frontiers in Neuroscience, Front Neurotic 10. doi:10.3389/fnins.2016.00102. Pittau F, Grouiller F, Spinelli L, Seeck M, Michel CM, Vulliemoz S (2014): The role of functional neuroimaging in pre-surgical epilepsy evaluation. Front Neurol 5:31. Plummer C, Harvey AS, Cook M (2008): EEG source localization in focal epilepsy: Where are we now? Epilepsia 49:201–218. Polkey CE (2004): Clinical outcome of epilepsy surgery. Curr Opin Neurol 17:173–178. Ramantani G, Koessler L, Colnat-Coulbois S, Vignal JP, Isnard J, Catenoix H, Jonas J, Zentner J, Schulze-Bonhage A, Maillard LG (2013): Intracranial evaluation of the epileptogenic zone in regional infrasylvian polymicrogyria. Epilepsia 54:296–304. Rosenow F, Luders H (2001): Presurgical evaluation of epilepsy. Brain 124:1683–1700. Ryvlin P, Cross JH, Rheims S (2014): Epilepsy surgery in children and adults. Lancet Neurol 13:1114–1126. Schiller Y, Cascino GD, Sharbrough FW (1998): Chronic intracranial EEG monitoring for localizing the epileptogenic zone: An electroclinical correlation. Epilepsia 39:1302–1308. Shiraishi H (2011): Source localization in magnetoencephalography to identify epileptogenic foci. Brain Dev 33:276–281. Shiraishi H, Watanabe Y, Watanabe M, Inoue Y, Fujiwara T, Yagi K (2001): Interictal and ictal magnetoencephalographic study in patients with medial frontal lobe epilepsy. Epilepsia 42:875–882. So N, Gloor P, Quesney LF, Jones-Gotman M, Olivier A, Andermann F (1989a): Depth electrode investigations in patients with bitemporal epileptiform abnormalities. Ann Neurol 25:423–431. So N, Olivier A, Andermann F, Gloor P, Quesney LF (1989b): Results of surgical treatment in patients with bitemporal epileptiform abnormalities. Ann Neurol 25:432–439. Stefan H, Abraham-Fuchs K, Schneider S, Schuler P, Huk WJ (1993): Multichannel magneto-electroencephalography recordings of interictal and ictal activity. Physiol Meas 14:A109–A111. Stefan H, Hummel C, Scheler G, Genow A, Druschky K, Tilz C, Kaltenhauser M, Hopfengartner R, Buchfelder M, Romstock J (2003): Magnetic brain source imaging of focal epileptic activity: A synopsis of 455 cases. Brain 126:2396–2405. Stefan H, Schneider S, Feistel H, Pawlik G, Schuler P, AbrahamFuchs K, Schlegel T, Neubauer U, Huk WJ (1992): Ictal and interictal activity in partial epilepsy recorded with multichannel magnetoelectroencephalography: Correlation of electroencephalography/electrocorticography, magnetic resonance imaging, single photon emission computed tomography, and positron emission tomography findings. Epilepsia 33:874–887. Sutherling WW, Crandall PH, Engel J Jr, Darcey TM, Cahan LD, Barth DS (1987): The magnetic field of complex partial seizures agrees with intracranial localizations. Ann Neurol 21:548–558. Tadel F, Baillet S, Mosher JC, Pantazis D, Leahy RM (2011): Brainstorm: A user-friendly application for MEG/EEG analysis. Comput Intell Neurosci 2011:879716. Tanaka N, Cole AJ, von Pechmann D, Wakeman DG, Hamalainen MS, Liu H, Madsen JR, Bourgeois BF, Stufflebeam SM (2009): Dynamic statistical parametric mapping for analyzing ictal magnetoencephalographic spikes in patients with intractable frontal lobe epilepsy. Epilepsy Res 85:279–286.
2545
r
r
Pellegrino et al.
Tellez-Zenteno JF, Dhar R, Wiebe S (2005): Long-term seizure outcomes following epilepsy surgery: A systematic review and meta-analysis. Brain 128:1188–1198. Tilz C, Hummel C, Kettenmann B, Stefan H (2002): Ictal onset localization of epileptic seizures by magnetoencephalography. Acta Neurol Scand 106:190–195. Vadera S, Jehi L, Burgess RC, Shea K, Alexopoulos AV, Mosher J, Gonzalez-Martinez J, Bingaman W (2013): Correlation between magnetoencephalography-based “clusterectomy” and postoperative seizure freedom. Neurosurg Focus 34:E9. Verma A, Radtke R (2006): EEG of partial seizures. J Clin Neurophysiol 23:333–339. von Ellenrieder N, Pellegrino G, Hedrich T, Gotman J, Lina JM, Grova C, Kobayashi E (2016): Detection and magnetic source imaging of fast oscillations (40–160 Hz) recorded with magnetoencephalography in focal epilepsy patients. Brain Topogr 29: 218–231. Wehner DT, H€am€al€ ainen MS, Mody M, Ahlfors SP (2008): Head movements of children in MEG: Quantification, effects on source estimation, and compensation. Neuroimage 40:541–550.
r
r
Worrell GA, Lagerlund TD, Sharbrough FW, Brinkmann BH, Busacker NE, Cicora KM, O’Brien TJ (2000): Localization of the epileptic focus by low-resolution electromagnetic tomography in patients with a lesion demonstrated by MRI. Brain Topogr 12:273–282. Wyllie E, Lachhwani DK, Gupta A, Chirla A, Cosmo G, Worley S, Kotagal P, Ruggieri P, Bingaman WE (2007): Successful surgery for epilepsy due to early brain lesions despite generalized EEG findings. Neurology 69:389–397. Yagyu K, Takeuchi F, Shiraishi H, Nakane S, Sueda K, Asahina N, Kohsaka S, Umeoka S, Usui N, Baba K, Saitoh S (2010): The applications of time-frequency analyses to ictal magnetoencephalography in neocortical epilepsy. Epilepsy Res 90:199–206. Yoshinaga H, Ohtsuka Y, Watanabe Y, Inutsuka M, Kitamura Y, Kinugasa K, Oka E (2004): Ictal MEG in two children with partial seizures. Brain Dev 26:403–408. Zumsteg D, Wieser HG (2000): Presurgical evaluation: current role of invasive EEG. Epilepsia 41 (Suppl 3):S55–S60.
2546
r