JJBS
Volume 1, Number 2, Mar. 2008 ISSN 1995-6673 Pages 55 - 59
Jordan Journal of Biological Sciences
Spatial and Seasonal Variations in Biomass and Size Structure of Zooplankton in Coastal Waters of the Gulf of Aqaba Tariq H. Al-Najjar *,a and Mohsen M. El-Sherbiny b b
a Marine Science Station, P.O.Box 195, Aqaba-Jordan Marine Science Department, Faculty of Science, Suez Canal University, Ismailia-41522, Egypt
Abstract Zooplankton biomass were measured monthly from eleven coastal sampling station and one offshore station from the northern par of the Gulf of Aqaba between January and December 2004. Significant difference in zooplankton biomass was obtained among different stations and different sampling months. The highest biomass was recorded in January (50.75 mg. dry wt.m-3), the lowest in October (5.54 mg. dry wt.m-3). A notable high biomass of 46.1 mg. dry wt.m-3 was registered at Tala Bay pool, while lowest biomass was recorded at both Al-Sodasiat and offshore stations. At the study area, the results showed significant differences among different size fractions of zooplankton. The relative annual average of size fraction > 500 µm constituted about 68 % of the total biomass, while the size fractions 200-500 µm and 100-200 µm constituted 26% and 6%, respectively.
اﻟﻤﻠﺨﺺ ﺗﻢ اﻟﺘﻘﺪﻳﺮ اﻟﺤﺠﻤﻲ ﻟﻠﻬﻮاﺋﻢ اﻟﺤﻴﻮاﻧﻴﺔ ﻓﻲ ﺧﻠﻴﺞ اﻟﻌﻘﺒﺔ ﻣﺎ ﺑﻴﻦ آﺎﻧﻮن ﻓﻲ إﺣﺪى ﻋﺸﺮ ﻣﻮﻗﻊ ﺳﺎﺣﻠﻲ و ﻣﻮﻗﻊ ﻓﻲ٢٠٠٤ آﺎﻧﻮن أول-اﻟﺜﺎﻧﻲ دﻟﺖ اﻟﻨﺘﺎﺋﺞ ﻋﻠﻰ وﺟﻮد ﻓﺮوق ﻣﻌﻨﻮﻳﺔ ﺑﻴﻦ اﻟﻤﻨﺎﻃﻖ.ﻋﺮض اﻟﺒﺤﺮ ﺳﺠﻠﺖ اﻟﺪراﺳﺔ ﺗﺮآﻴﺰ ﻋﺎﻟﻴﺔ.اﻟﻤﺨﺘﻠﻔﺔ و آﺬﻟﻚ ﺑﻴﻦ اﻷوﻗﺎت اﻟﻤﺨﺘﻠﻔﺔ ﻓﻲ ﺷﻬﺮ آﺎﻧﻮن اﻟﺜﺎﻧﻲ ﺑﻴﻨﻤﺎ ﺳﺠﻠﺖ ﺗﺮآﻴﺰ٣ م/ ﻣﻠﻎ٥٠٫٧٥ ﺑﻠﻐﺖ وﻗﺪ دﻟﺖ آﺬﻟﻚ اﻟﻨﺘﺎﺋﺞ ﻋﻠﻰ وﺟﻮد، ﻣﻨﺨﻔﻀﺔ ﺧﻼل ﺷﻬﺮ ﺗﺸﺮﻳﻦ أول ﺗﺮآﻴﺰ ﻋﺎﻟﻴﺔ ﻓﻲ ﺑﺤﻴﺮة اﻟﻨﺨﻴﻞ و ﺗﺮآﻴﺰ ﻣﻨﺨﻔﻀﺔ ﻓﻲ ﻣﻨﻄﻘﺔ ﺑﻴﻨﺖ.اﻟﺴﺪاﺳﻴﺎت و اﻟﺸﺎﻃﺊ اﻟﻌﺎم ﻓﻲ اﻟﺠﻬﺔ اﻟﺠﻨﻮﺑﻴﺔ ﻣﻦ اﻟﺨﻠﻴﺞ اﻟﻨﺘﺎﺋﺞ وﺟﻮد ﻓﺮوق ﻣﻌﻨﻮﻳﺔ ﺑﻴﻦ اﻷﺣﺠﺎم اﻟﻤﺨﺘﻠﻔﺔ ﻟﻠﻬﻮاﺋﻢ اﻟﺤﻴﻮاﻧﻴﺔ %٦٨ ﻣﺒﻜﺮون ﺣﻮاﻟﻲ٥٠٠ ﺣﻴﺚ ﺑﻠﻐﺖ ﻧﺴﺒﺔ اﻟﺤﺠﻢ اﻷآﺒﺮ ﻣﻦ أﻣﺎ ﻧﺴﺒﺔ اﻟﺤﺠﻢ ﻣﻦ، ﻣﺒﻜﺮون٥٠٠-٢٠٠ ﻟﻠﺤﺠﻢ ﻣﻦ%٢٦ ﻳﺘﺒﻌﻬﺎ . ﻓﻘﻂ%٦ ﻣﺒﻜﺮون ﻓﻘﺪ ﺑﻠﻐﺖ٢٠٠-١٠٠ © 2008 Jordan Journal of Biological Sciences. All rights reserved
Keywords: Zooplankton; biomass; size fraction; Gulf of Aqaba;
1. Introduction The Gulf of Aqaba extends for about 180 km, the Jordanian portion of Gulf of Aqaba extends for 27 km only. Along the Jordanian coast and within the present study area the Gulf reaches a maximum width of around 25 km while in the northern half the maximum width is only around 17 km and it narrows to about 5 km at the most northern tip. The maximum depth of the Gulf is about 1830 m while the average depth is around 650 m (Marcos 1970; Levanon-Spanier et al., 1979). The water in the study area is very clear with very high transparency under normal conditions. Many human activities are taking place along the Gulf and many development projects exist or are planned, particularly at the northern tip of the Gulf. There are signs that these activities are affecting zooplankton biomass indirectly by increasing the nutrient availability in water, which leads to an increase in the plankton biomass in the area (Al-Najjar *
Corresponding author. e-mail:
[email protected]
and Rasheed, 2005). Zooplankton organisms as community are important grazers in the pelagic zone (Burkill et al., 1993; Landry et al., 1995), consuming a wide range of food particles that vary in size and type. The zooplankton also aids in the vertical export of carbon out of the mixed layer as particulate, skeletal, and fecal material (Roman et al., 1995; Stoecker et al., 1996). Within the zooplankton community, organisms of different size may play different roles in biogeochemical cycling and so influence processes associated with the biological mediated drawdown of atmospheric CO2, and its transformation into particles and sedimentation in the ocean. In the Gulf of Aqaba, quantitative data sets on the seasonality of zooplankton abundance and biomass distribution have been presented by several investigations since 1970 (Gordeyeva 1970; Vaissiere and Sequin 1982; Echelman and Fishelson 1990; Al-Najjar 2000; Al-Najjar et al., 2002 and Al-Najjar 2004a). The objective of the present work was to test temporal and spatial variations
© 2008 Jordan Journal of Biological Sciences. All rights reserved - Volume 1, Number 2
56
and abundance of zooplankton biomass of different fraction sizes in the coastal waters of the Gulf of Aqaba.
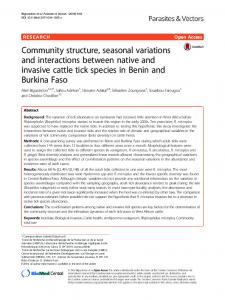
2. Materials and Methods Surface zooplankton samples were collected from eleven coastal stations along the northern tip of the Gulf of Aqaba [Wahat Ayla, Hotels, Public cafes, Phosphate port, Clinker, Marine Science Stations (MSS), Public beach, AlSodasiat , Tala bay (inside), Tala bay (outside) and Jordan Fertilizer Industry site (JFI)] and one offshore station located about 2 Km from the coast line (Fig. 1). of A qaba
29.55
Wahat Ayla Hotels Area Public Cafés
Gulf
29
Phosphate Port Clinker Port
Red Sea offshore
27 34.5
35
Ferry Port Marine Science Station
35.5
29.45
Public Beach Visitors Center
Fig 2: Average spatial variations of zooplankton biomass (mg. dry wt. m3 ± SE) at different sampling stations
Al Sodasiat Tala Bay
29.4
Royal Diving Center
29.35
0
1
2
34.8
3
4
Thermal Power Station Industrial Complex
5 km
34.85
34.9
34.95
35
35.05
Longitude (E)
Fig. 1: Zooplankton sampling stations along the northern part of the Gulf of Aqaba
The depth of coastal stations ranging between 4 and 50 m, while the offshore station has depth of about 200-300 m. Zooplankton >100 µm was sampled monthly between January - December 2004 during daylight. A simple plankton net (100 µm mesh; ARI, USA) was towed horizontally from a boat at a speed of 3-3.5 knots for duration of ten minutes along the surface. Zooplankton samples were kept on ice for about 2 hours until arrival to the laboratory. In the laboratory, samples were sizefractionated using a column of 100, 200 and 500 µm mesh filters. The separated fractions were filtered on pre-dried and pre-weight GF/C filters, dried for 24-48 hrs at 60 ˚C, and re-weighed. Biomass (mg. dry wt. m-3) was calculated as follows: Biomass (mg.l-1) = [zooplankton dry weight (gm) /volume of water filtrate (m-3)] × 1000, Where the volume of water filtrate = velocity (m. sec-1) × area of net (m2) × time of collection (sec).The effect of 'station' (n=12) and 'month' (n=12) on zooplankton biomass was tested statistically using an ANOVA test. The statistical significance was tested at the 95% confidence level.
3. Results Throughout the area of study, zooplankton biomass was characterized by relatively low values ranging between 0.462 and 4.22-mg. dry wt.m-3 with an annual average of
The monthly average of zooplalankton biomass varied throughout the year fluctuating between 0.842 and 3.842 mg. dry wt.m-3 at stations offshore and Tala Bay (inside), respectively. On a monthly scale, January exhibited the highest biomass value (average 50.75 mg. dry wt.m-3). Other small increases of biomass appeared in February, March and April with values of 20.4, 28.92 and 30.30 mg. dry wt.m-3, respectively (Fig. 3). On the other hand, the lowest zooplankton biomass was detected during summer and early autumn with a minimum biomass of 5.54 mg. dry wt.m-3 in October. The results of ANOVA test showed a high significant variation in the zooplankton biomass between different sampling months (P< 0.0001).
3
Oil Terminal
GULF OF AQABA
mg.dw.m
Latitude (N)
29.5 28
34
18.40 mg. dry wt.m-3. The spatial distribution of zooplankton biomass showed clear variations between different sampling stations (Fig. 2). The maximum biomass value of 46.1 mg. dry wt.m-3 appeared at Tala Bay pool (inside), while lowest was obtained at offshore station (Fig. 2). Another notable high biomass values were also registered at Hotel and Wahat Ayla stations, which located at the most northern part of the Gulf (21.8 and 22.62 mg. dry wt.m-3, respectively). Statistically, a significant difference in zooplankton biomass was obtained between different stations (P= 0.0028).
Fig 3: Average monthly variations in zooplankton biomass (mg. dry wt. m3 ± SE) during the period of study
During the period of study, at all sampled stations the size fraction >500 µm dominate biomass followed by 200500 µm and 100-200 µm size fraction (Fig. 4). The relative contribution of each size fraction to the total biomass showed that about 67% of the biomass was due to organisms more than 500 µm, while 26 % and 7 % due to the organisms less than 200-500 µm and 100-1200 µm fractions, respectively (Table 1). High statistically significant difference in zooplankton biomass was obtained values between different size fractions (P< 0.0001) (Fig. 5).
© 2008 Jordan Journal of Biological Sciences. All rights reserved - Volume 1, Number 2
57
Fig. 4: Monthly variations of the average biomass of different zooplankton size fractions (mg. dry wt. m3 ± SE) during the period of study Table 1: Mean biomass (mg. dry wt. m3) and percentage of zooplankton different size fractions in the Gulf of Aqaba between January and December 2004. (SE) standard error, (N) number of fraction repetitions. Fraction (um) Biomass ± SE Percentage N 100
13.20 ± 0.20
6%
200-500
55.30 ± 0.86
26 %
12 12
>500
144.55 ± 1.25
68 %
12
Total
213.05
100 %
36
site is characterized by higher annual average chlorophyll contents of 0.66 mg/m3 compared with other stations (0.30 mg/m3) (MSS, 2006). Generally, spatial and temporal variations in zooplankton biomass throughout the northern Gulf of Aqaba can be related to variations in the phytoplankton production cycles as observed in other marine habitats including Indian Ocean (Piontkovski et al., 1995; Haury 1988).
4. Discussion The oligotrophic marine areas are characterized by both low primary and secondary production. The annual average of zooplankton biomass (18.40 mg. dw. m-3) during the present study was obviously lower than other previous studies of Al-Najjar et al. (2002) and Al-Najjar (2004b) at the same area (25.53 and 71.26 mg. dw. m-3, respectively). The lower difference in zooplankton biomass obtained is likely due to different sampling strategy ( Avois et al. 2000). However, the obtained values during this study fall within the range of other oligotrophic water (steifox et al. 1999). The highest zooplankton biomass of 46.1-mg. dry wt.m-3 recorded at Tala Bay pool (inside) station could be attributed to its semi-enclosed characteristics and shallowness (4 m). Additionally, this
Fig. 5: Mean biomass of zooplankton different size fractions in the study area collected during 2004
In this study, consumer community of zooplankton seems follow autotrophic biomass evolution. The peak of
58
© 2008 Jordan Journal of Biological Sciences. All rights reserved - Volume 1, Number 2
zooplankton biomass was highest in winter following the annual peaks of phytoplankton in the Gulf of Aqaba where there is an increase in eukaryotic algae during the period of January to February and diatom abundance at the beginning of March (Al-Najjar 2000; Cornils et al., 2005). Similar finding have been observed by Mozetic et al., (1998) in the Gulf of Trieste during his study from 1989 to 1995. Also this higher biomass in winter could by explained by the dominance of the larger sized zooplankton organisms such as copepods (especially Calanus, Candacia and Centropages and Clausocalanus), urochordates, cheatognaths and mollusk larvae (Cornils et al., 2005; Personal observation). On the other hand, the lower peak of zooplankton biomass during summer is possibly due to thermal stratification in the Gulf of Aqaba, where nutrient concentration are also low (Lindell and post 1995; Al-Najjar 2000; Cornils et al., 2005; Al-Najjar et al., 2007). In this condition, there was a decrease in eukaryotic algae and diatoms abundance, which lead to a decrease in density of zooplankton biomass. Another explanation pending on the thermal stratification during summer concurrent with low nutrient availability, whereas during winter mixing season water becomes homogenized in such condition there was an increase in eukaryotic algae abundance, which leads to an increase in biomass of zooplankton organisms. It has been shown that environmental variability plays a major role in determining spatial and temporal patterns of zooplankton distribution (Tomosada and Odate 1995; Aoki, et al., 1990). In General, zooplankton abundance has been associated with changes in phytoplankton standing stocks (Al-Najjar 2000; Al-Najjar et al., 2002) and with combined effects of regional climatology and local hydrographic variables Aoki et al., (1990). Body size has also been considered a specific component of plankton heterogeneity from small protozoan to large copepods in the oligotrophic waters such as Gulf of Aqaba (Sommer et al., 2002). Differences were also observed in the biomass levels in the different size class studied, where about 68 % of the biomass was observed to be in the large size fraction >500 µm, and size fraction of 100-500 µm accounted for only 32%. In comparison with the result of polar water, the small size fraction accounted for about 50 % of total biomass while the largest one represented 35% (Hernandez-Leon et al., 2000). The reason is due to copepods in cold water accounted 50-90 % of the total zooplankton number Conover and Huntley (1991) and they are in small size and are, therefore, better contributors to the energy flow in these cold waters Boyson-Ennen et al., (1991). However, another study by Hernandez-Leon et al., (2000) for the same area and same size fraction of zooplankton during January 1993, found that the zooplankton biomass was very low (64.31 mg. dw. m-2), and about 56 % of total biomass was due to the large size fraction 1000-4000 µm while the smallest one 200-500 µm accounted for about 26 %. Those results could reflect the interannual variability but also the progression of the different populations from spring to summer. This would imply that organisms have growth rates, which might reach higher values during the productive season. Predation by planktivorus fish explains the smaller spatial heterogeneity in this study, since the predation pressure seems to be an essential variable in the
maintenance of horizontal pattern in zooplankton distribution (Gliwicz and Rybowska, 1992). Zooplanktivorus fish account for about 70% of the total fish species registered in the Gulf of Aqaba (Khalaf and Kochzius, 2002). Among the zooplanktivorus fish, two species (Pseudonthias squamipinnis and Neopomacentru miryae) occur in great numbers in the study area (Khalaf and Kochzius, 2002).
Acknowledgment The researchers would like to thank to Mr. Eyhab Eid from Marine Science station for his help in the samples collection and the data analysis. This work is part of Coordinated National Monitoring Program sponsored by ASEZA (Aqaba Special Economic Zone Authority).
References [1] Al-Najjar T and Rasheed M. 2005. Zooplankton biomass in the most northern tip of the Gulf of Aqaba, a case study. Leb. Sci. J. (In Press). [2] Al-Najjar T, Badran M, and Zibdeh M. 2002. Seasonal cycle of surface zooplankton biomass in relation to the chlorophyll a in the Gulf of Aqaba, Red Sea. Abhath Al-Yarmouk Basic Scic.&Eng. 12 (1): 109-118. [3] Al-Najjar T. 2000. The seasonal dynamics and grazing control of Phyto- and mesozooplankton in the northern Gulf of Aqaba (Ph.D. Thesis) Bremen (Germany) Bremen University. [4] Al-Najjar T. 2004a. Spatial and Temporal variations in surface zooplankton biomass distribution in the Gulf of Aqaba, Red Sea. Leb. Sci. J., 5(1): 17-23. [5] Al-Najjar T. 2004b. Quantitative Estimation of surface zooplankton biomass in the Gulf of Aqaba, Red Sea. Dirasat, pure sci., 31(2): 115-122. [6] Aoki I, Komatsu, T, and Fishelson L. 1990. Surface zooplankton dynamics and community structure in the Gulf of Aqaba (Eilat), Red Sea. Mar. Biol., 107: 179-190. [7] Avois C, Legender P, Masson S, and Pinel-Alloul B, 2000. Is the sampling strategy interfering with the study of spatial variability of zooplankton communities. Can. J. fish. Aquat. Soc., 57: 1940-1956. [8] Boysen O, Ennen E, Hagen W, Hubold G, and Piatkowski U. 1991. Zooplankton biomass in the ice-covered Weddell Sea, Antarctica. Mar. Biol. 111: 227-235 [9] Burkill PH, Edwards ES, John AWG and Sleigh MA. 1993. Micro zooplankton and their herbivorous activity in the Northeast Atlantic Ocean. Deep-Sea Res. II 40: 479- 493. [10] Conover RJ and Huntley M. 1991. Copepods in the icecovered seas. Distribution, adaptations to seasonally limited food, metabolism, growth pattern and life cycle strategies in polar seas. J. Mar. Sys 2: 1- 4 [11] Cornils A; Schnack-Schiel SB; Hagen W; Dowidar M; Stambler N; Plähn, O. and Richter C. 2005. Spatial and temporal distribution of mesozooplankton in the Gulf of Aqaba and the18 northern Red Sea in February/March 1999. J. Plankton Res., 27:505-518. [12] Echelman T and Fishelston L. 1990. Surface zooplankton dynamics and community structure in the Gulf of Aqaba (Eilat). Red Sea. Mar. Bio., 107: 179-190. [13] Gliwicz ZM and Rybowska A. 1992. Shore avoidance in zooplankton: a predator-induced behavior or predatorinduced mortality?. J. Plankton Res. 14: 1331-1342.
© 2008 Jordan Journal of Biological Sciences. All rights reserved - Volume 1, Number 2 [14] Gordeyeva KT. 1970. Quantitative distribution of zooplankton in the Red Sea. Oceanol., 10: 867-871. [15] Haury L and Pieper RE. 1988. Zooplankton: scales of biological and physical events. In: Soule DF, and Kleppel GS (ed.) Marine organisms as indicators. Springer-Verlag New York p 35-73. [16] Hernandez-Leon SC, Almedia A, Portillo-Hanefeld A, Gomez M, and Montero I. 2000. Biomass and potential feeding, respiration and growth of zooplankton in the Bransfield strait (Antarctic Peninsula) during austral summer. Polar Biol. 23: 679-690. [17] Khalaf MA, and Kochzius M. 2002. Changes in trophic community structure of shore fishes at an industrial site in the Gulf of Aqaba, Red Sea. Mar. Ecol. Prog. Ser. 239: 287-299. [18] Landry MR, Constantine J and Krishtein J. 1995. Microzo moplankton grazing in the central equatorial pacific during February and August, 1992. Deep Sea Res. II 42: 657-671. [19] Levanon-Spanier L, Padan E, and Reiss Z. 1979. Primary production in desert-enclosed sea the Gulf of Elat (Aqaba), Red Sea. Deep-Sea Res. 26: 673– 685. [20] Lindell D and Post AF. 1995. Ultra phytoplankton succession is triggered by deep winter mixing in the Gulf of Aqaba (Eilat), Red Sea. Limnol. Oceanogr. 40: 1130-1141. [21] Marcos SA. 1970. Physical and chemical oceanography of the Red Sea. Oceanogr. Mar. Biol. Annu. Rev. 8: 73–202. [22] Mozetic P, Fonda S, Umani C, and Malej A. 1998. Seasonal and inter-annual plankton variability in the Gulf of Trieste (northern Adriatic)ICES. J. Mar. Sci. 55: 711-722. [23] MSS 2006. Marine Science Station. National Monitoring programme of Aqaba, 120pp.
59
[24] Piontkovski SA, Williams R and Melnik TA. 1995. Spatial heterogeneity, biomass and size structure of plankton of the Indian Ocean: some general trend. Mar. Ecol. Prog. Ser. 117: 219-227 [25] Roman MR, Caron DM, Kremer P, Madin LP, Malone TC, Nappy LM, Peele EP and Yoyngbluth MJ. 1995. Spatial and temporal changes in the partitioning of organic carbon in the plankton community of the Sargasso Sea off Bermuda. Deep Sea Res. I 42, 974-992. [26] Sommer U, Berninger UG, Bottger-Schnack R, Hansen H, Stibor H, Schnack-Schiel SB, Cornils A, Hagen W, Wickham S, Al-Najjar T, and Post AF. 2002. Grazing During the Spring bloom in the Gulf of Aqaba and the Northern Red Sea. Mar. Ecol. Prog. Ser. 239: 251-261. [27] Stelfox CE, Burkill PH, Edward ES, Haris RP and Sleigh MA. 1999. The structure of zooplankton communities, in the 2 to 2000 µm size range, in the Arabian Sea during and after SW monsoon, 1994. Deep Sea Res. II 46: 815-842. [28] Stoecker, DK, Gustafson DE, and Verity PG. 1996. Microand Mesoprotozooplankton at 140 oW in the equatorial Pacific: heterotrophs and mixotrophs. Aquat. Microb. Ecol. 10: 273-282. [29] Tomosada A and Odate K. 1995. Long term variability in zooplankton biomass and environment. Umi to sora., 71: 1-7. [30] Vaissier R and Sequin G. 1982. Preliminary study of the zooplankton from the coral reef and open-sea area of Jordan in the Gulf of Aqaba, (Red Sea). Vie Mar 4:1-6. [31] Ward P and Shreeve RS. 1995. Egg production in three species of Antarctic calanoid copepods during an austral summer. Deep Sea Res. 42: 721-735.