e.Proofing
1 di 38
http://eproofing.springer.com/journals_v2/printpage.php?token=BizD...
Spatial and Temporal Characteristics of Set-Related Inhibitory and Excitatory Inputs from the Dorsal Premotor Cortex to the Ipsilateral Motor Cortex Assessed by Dual-Coil Transcranial Magnetic Stimulation Sara Parmigiani, 1 Benedetta Zattera, 1 Guido Barchiesi, 2 Luigi Cattaneo, 3✉ Phone +39-045-8027198 Email
[email protected] 1 University of Trento, Trento, Italy 2 University of Salzburg, Salzburg, Austria 3 Dipartimento di Neuroscienze, Biomedicina e Movimento, University of Verona, Strada Le Grazie, 8, 37134 Verona, Italy Received: 22 September 2017 / Accepted: 14 February 2018
Abstract The capacity to produce movements only at appropriate times is fundamental in successful behavior and requires a fine interplay between motor inhibition and facilitation. Evidence in humans indicates that the dorsal premotor cortex (PMCd) is involved in such preparatory and inhibitory processes, but how PMCd modulates motor output in humans is still unclear. We investigated this issue in healthy human volunteers, using a variant of the dual-coil transcranial magnetic stimulation (TMS) technique that allows testing the short-latency effects of conditioning TMS to the left
27/02/2018, 10:14
e.Proofing
2 di 38
http://eproofing.springer.com/journals_v2/printpage.php?token=BizD...
PMCd on test TMS applied to the ipsilateral orofacial primary motor cortex (M1). Participants performed a delayed cued simple reaction time task. They were asked to produce a lip movement cued by an imperative GOsignal presented after a predictable SET-period, during which TMS was applied at different intervals. Results showed that the area of motor evoked potentials (MEPs) to test TMS was modulated by conditioning TMS. A transient inhibition cortico-bulbar excitability by PMCd stimulation was observed around the middle of the SET-period. Conversely, a ramping excitatory effect of PMCd stimulation appeared towards the end of the SETperiod, as the time of the predicted GO-signal approached. The time-course of PMCd–M1 activity scaled to the varying SET-period duration. Our data indicate that inhibition and excitation of motor output during a delayed reaction time task are two distinct neural phenomena. They both originate in PMCd and are conveyed via cortico–cortical connections to the ipsilateral M1, where they are integrated to produce harmonic fluctuations of motor output. AQ1
Keywords Cortico–cortical connectivity Inhibition Premotor Action preparation Voluntary movement
Introduction Consider an orchestral flute player just few instants before starting to play her piece. Her successful performance requires the interplay between the capacity to stand still when necessary and the capacity to move at the appropriate time. Besides this paradigmatic case, our daily life is permeated with behavioral situations requiring to withhold a preloaded action to be performed only when appropriate contextual conditions occur. In these cases appropriate motor performance is thought to rely on two distinct neural processes, i.e. active inhibition of motor output coupled with active facilitation of motor output (Aron 2007; Aron et al. 2007; Chambers et al. 2009; Boy et al. 2010; Duque et al. 2017). Evidence suggests that the dorsal premotor cortex (PMCd) of human and nonhuman primates might be involved in this interplay. In
27/02/2018, 10:14
e.Proofing
3 di 38
http://eproofing.springer.com/journals_v2/printpage.php?token=BizD...
monkeys PMCd is densely interconnected with the primary motor cortex (M1) (Muakkassa and Strick 1979; Tokuno and Tanji 1993; Kiefer et al. 1998; Hatanaka et al. 2001) and it is known that PMCd can exert inhibitory as well as excitatory effects on M1. PMCd neurons exhibit a rich variety of set-related activity, being time-locked to the ongoing inhibitory behavior (Weinrich et al. 1984; Godschalk et al. 1985; Wise 1985; Kurata and Wise 1988a, b; di Pellegrino and Wise 1993; Mirabella et al. 2011). Therefore, although most set-related activity in PMCd has been interpreted as related to motor preparation (Hoshi et al. 2014), its functional features make it a possible candidate also for motor inhibition. Indeed, several neurons show preferential set-related activity with reduced or absent movement-related activity (see, for instance, Wise and Mauritz 1985). Indeed, the injection of GABA-A antagonists within PMCd reduces the ability of monkeys to withhold movements (Sawaguchi et al. 1996). Similarly, lesions PMCd may result in increased frequency of impulsive and uncontrolled reaching movements (Moll and Kuypers 1977). Furthermore, a single cell study recorded from PMCd neurons of two monkeys when performing both no-stop and stop trials in a countermanding task (Mirabella et al. 2011) showed that more than one-third of recorded PMCd neurons involved in motor planning exhibit a countermanding modulation. These neurons changed their pattern of discharge when a reaching movement were executed with respect to when it was inhibited, and this change preceded the end of the stop-signal reaction time. Furthermore, others single-neuron neurophysiology studies that been done to examine how activity in the premotor and motor cortex changes with time during delay periods found that some pyramidal neurons in PMCd synapse primarily on inhibitory cells in M1, producing feedforward inhibition (see, among the others, Ghosh and Porter 1988; Keller 1993; Tokuno and Nambu 2000; Riehle et al. 2006; Kaufman et al. 2010). In humans, transcranial magnetic stimulation (TMS) studies investigating premotor–motor cortico–cortical connections provide evidence for an involvement of PMCd in facilitatory or inhibitory processes. Using a dual coil TMS, O’Shea et al. (2007) found facilitatory effects of the left PMCd on the contralateral M1 with TMS delivered just after the GO-signal presentation, when action releasing was required. Similar results were obtained by Bestmann et al. (2008). In the same vein, Koch et al. (2006) stimulated the left PMCd and the contralateral M1 during a choice reaction time task. The results showed not only facilitatory but also inhibitory PMCd–M1 interactions. In a similar vein, Kroeger et al. (2010) using dual-site TMS in
27/02/2018, 10:14
e.Proofing
4 di 38
http://eproofing.springer.com/journals_v2/printpage.php?token=BizD...
both hemisphere during a go/no-go task found that the left PMCd exerts an inhibitory influence on corticospinal excitability in the right M1 at the early stage of the preparatory delay period, which turned into facilitation when the go signal appeared. More recently, Duque et al. (2012) combined repetitive TMS (rTMS) over PMCd and a single pulse TMS over M1 in order to evaluate the putative role of PMCd in action control. rTMS was used to produce a transient disruption of PMCd, while the single pulse TMS over M1 allowed for measuring inhibitory changes in corticospinal excitability. The results showed that rTMS over PMCd specifically attenuated inhibition before the onset of an imperative signal. This lead the authors to hypothesize a critical role of PMCd in suppressing motor impulses (see also Duque et al. 2017). Although the mentioned lines of evidence indicate an association of PMCd to both facilitatory and inhibitory processes, it is still unclear how the information in PMCd modulates the corticospinal output, particularly regarding the inhibitory aspects. The aim of the present study is to start addressing this question. We test the hypotheses that PMCd directly affects motor output by means of cortico–cortical projections to the ipsilateral M1 and that the effect of such connections is inhibitory whenever correct behavior requires immobility. We therefore adopted a simple delayed cued motor task, in which with an impeding action was to be withheld during a fixed SETperiod and to be released at the presentation of an imperative GO-signal. We explicitly decided to adopt such a simple task with a fully predictable timing of the SET- and GO-components, because it allows specific evaluation of the premotor–motor functional connectivity during behavioral inhibition and facilitation of action minimizing irrelevant experimental variables and it allows precise temporal sampling of the SET-period by means of TMS. AQ2
To sample neural signals from PMCd to M1 during the behavioral task we took advantage of dual-coil TMS. The dual coil technique employs a single TMS test pulse to M1 (testTMS) that evokes a motor evoked potential (MEP) in a muscle of interest. Prior to this, a conditioning pulse (condTMS), which does not elicit a MEP alone, is delivered in some trials to a cortical area supposedly connected to M1. If the conditioning pulse modulates the amplitude of M1 motor output at short inter-stimulus intervals (ISIs), then direct cortico–cortical connectivity between the two areas may be inferred (Cattaneo and Barchiesi 2011; Rothwell 2011). However, testing specifically PMCd–M1 direct interactions by the dual coil technique proved to be challenging because of the close spatial proximity between the PMCd and the
27/02/2018, 10:14
e.Proofing
5 di 38
http://eproofing.springer.com/journals_v2/printpage.php?token=BizD...
portion of M1 related to hand movements (handM1) (Schluter et al. 1998; Johansen-Berg et al. 2002). Most authors tackled this challenge by either placing the coil over PMCd directly on the skull, with the coil over M1 being either elevated or overlapped (Beck et al. 2009; Pirio Richardson et al. 2014) or using purpose-made coils with eccentric focality (Groppa et al. 2012). An alternative strategy is to probe the ipsilateral PMCd–M1 functional connectivity on an effector different from the hand, thus putting more distance between the two coils. In a recent study (Parmigiani et al. 2015) we delivered testTMS pulses over the left orofacial M1 (mouthM1), rather than over the left handM1. The results showed that a small region in PMCd, along the superior frontal sulcus, exerts a robust short-latency effect on the ipsilateral mouthM1 during rest. Here, we used this strategy in three different experiments. Experiment 1 was carried out to validate the hypothesis that short-latency connectivity between the intermediate portion of PMCd identified by Parmigiani et al. (2015) and the mouthM1 at rest actually exists. In Experiment 2 we tested the PMCd–M1 connectivity during the SET-period of a simple delayed motor task, in which participants should produce a lip-response to a GO-signal. The SET-period was constant and therefore predictable, in all trials (900 ms). Experiment 3 was designed to clarify the nature of the inhibitory results of Experiment 2, peaking at 600 ms from onset of the set period and, necessarily, 300 ms prior to the GO-signal. We wanted to investigate whether the inhibitory activity was time-locked to the set-period onset or to the GO-signal. To disentangle these two possibilities, we increased the duration of the set-period, to understand if the inhibitory peak would stay docked to the set-period onset at 600 ms or if it would be dragged forward by the GO signal. Finally, it is important to note that physiological findings of short-latency influences from premotor to motor cortices are generally interpreted in broader functional terms. The paired-coil literature interprets the pattern of effects of condTMS over M1 as revelatory of the type of information that the premotor cortex is transferring to M1 during the task. For example, the facilitatory effect on M1 during the SET-period of a delayed task exerted by frontal and parietal cortices has been considered as revelatory of the motor information for action planning stored in the premotor cortices and ready to be transferred to M1 (Koch et al. 2008; Davare et al. 2009; Vesia et al. 2013).
Materials and Methods 27/02/2018, 10:14
e.Proofing
6 di 38
http://eproofing.springer.com/journals_v2/printpage.php?token=BizD...
Participants Sixteen healthy individuals (11 women, mean age 25.8, ranging 18–38 years, SD 4.8) took part in Experiment 1 and Experiment 2. A separate group of 12 healthy individuals (7 women, mean age 25.4 years, ranging 18–41 years, SD 6.54) participated in Experiment 3. They all provided informed consent. All were screened for any contraindication to TMS (Rossi and Hallett 2009).The study was approved by the local ethical committee (protocol 2031-032) and was conducted in compliance with the revised Helsinki declaration (Association 2009). Except for the brain scan acquisition, which was performed on a previous day, Experiment 1 lasted 45 min and Experiment 2 and 3 (preparatory phase and behavioural part included) lasted approximately 2 h and a half. Each block of proper task lasted 7–8 min each.
Neuronavigation Before the experimental session, a high-resolution T1-weighted magnetization prepared rapid gradient echo sequence (176 axial slices, in-plane resolution 256 3 224, 1-mm isotropic voxels, generalized autocalibrating partially parallel acquisition with acceleration factor = 2, time repetition = 2700 ms, time echo = 4.180 ms, time to inversion = 1020 ms, flip angle = 7u) scan of the brain of each subject was obtained, using a MedSpec 4-T head scanner (Bruker BioSpin GmbH, Rheinstetten, Germany) with an 8-channel array head coil. Starting from this scan, a 3D reconstruction of the scalp and the grey matter surfaces was produced using MesH morphing tool included in the BrainVoyager software (Brain Innovation BV, The Netherlands). The BrainVoyager neuronavigation software combined with an ultrasound tracking system, CMS205S (Zebris Medical GmbH, Isny, Germany), was used to coregister the 3D scalp reconstruction with the actual participant’s head, thus marking the target point for the conditioning TMS on the real head of each participant.
Localization of TMS Targets The targets for testTMS and condTMS were the same in the three experiments. TestTMS was delivered to the mouthM1, which was localized functionally, without the aid of the neuronavigation system, as the spot on the scalp where the larger MEP from the orbicularis oris (OOr) muscle could be obtained with the lowest intensity. CondTMS was delivered to the mouthrelated PMCd as defined in Parmigiani et al. (2015), which was localized by means of neuronavigation on individual anatomies. It was found 1.5 cm
27/02/2018, 10:14
e.Proofing
7 di 38
http://eproofing.springer.com/journals_v2/printpage.php?token=BizD...
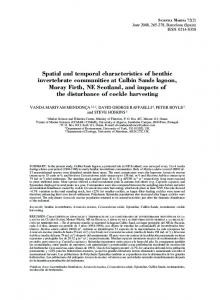
rostral to the junction between the superior precentral sulcus (sPreCS) and the superior frontal sulcus (sFS). After their use for neuronavigation, the brain images of all participants were transformed in Talairach space so that the stimulation spot was documented in all participants in a normalized space. The average coordinates were of x = − 22, y = − 1 and z = 55, which compare favorably with the spot where PMCd is localized by meta-analyses of fMRI studies (Hardwick et al. 2013, 2015). All individual brain surfaces are available in Fig. 1. Additionally, for descriptive purposes, the stimulated PMCd spot was localized on the scalp in the 10–20 reference system. Mean distance from the Cz coordinate (vertex) are − 3.55 cm lateral, 2.45 cm anterior (SD 0.63, 0.68). Figure 2 shows the target points in all participants. AQ3
Fig. 1 Individual surface renderings of the left hemisphere’s grey-white matter border of all 28 participants that have been used for neuronavigation. The stimulation target (pink spot) is indicated together with the major anatomical landmarks that allowed the identification of the target (color coding of the different sulci is reported at the bottom of the figure)
27/02/2018, 10:14
e.Proofing
8 di 38
http://eproofing.springer.com/journals_v2/printpage.php?token=BizD...
Fig. 2 The premotor target points on the scalp are shown for participants of all experiments (n = 28). Circles indicate data from single participants. For the sake of illustration clarity, a slight offset has been applied to overlapping spots so that they can be identified as multiple subjects. The black cross indicates the average coordinate. Histograms indicate the frequency of spots on the corresponding coordinates. Coordinates are given in 0.5 cm steps
27/02/2018, 10:14
e.Proofing
9 di 38
http://eproofing.springer.com/journals_v2/printpage.php?token=BizD...
Stimulating Apparatus, Muscular Pre-activation and Stimulation Intensity Dual-coil stimulation was achieved by means of two biphasic magnetic stimulators (MagPro and MagPro Compact) connected to two figure-of eight coils. A figure-of-eight coil with 55 mm windings (Dantec B55, Skovlunde, Denmark) oriented perpendicularly to the midline with the handle pointing laterally delivered testTMS over the motor cortex. A figure-of-eight coil with windings of 35 mm diameter (MC-B35, MagVenture, Skovlunde, Denmark) delivered condTMS, with a medio-lateral orientation of the induced current. Both the testTMS and the condTMS coils were held by an articulated mechanical arm (Manfrotto 244, VitecGroup, Italy). CondTMS and testTMS were both biphasic single stimuli. It has been reported that with certain cortical targets monophasic stimuli are more efficient in producing condTMS effects compared to biphasic pulses. However, in our experience we described the possibility to obtain dual-coil effects with biphasic stimuli (Cattaneo and Barchiesi 2011; Maule et al. 2015; Parmigiani et al. 2015). Therefore, we believe that monophasic and biphasic stimuli can be both used to apply condTMS, understanding that the two stimulus types elicit different neural activity. Active motor threshold (AMT) was calculated. AMT was defined as the minimum stimulus intensity necessary to produce a MEP in the recorded muscle of 200 µV of average amplitude over ten consecutive trials during a mild voluntary contraction. We averaged online batches of ten consecutive trials by means of the Signal software (Cambridge Electronic Design, Cambridge, UK), which was used for all EMG acquisitions. AMT was assessed separately for the two coils. The intensity of the condTMS as well as the testTMS stimuli was set to 120% of the AMT for the OOr muscle. For
27/02/2018, 10:14
e.Proofing
10 di 38
http://eproofing.springer.com/journals_v2/printpage.php?token=BizD...
each of the two coils stimulation intensity was individually set according to the specific AMT calculated with that same coil. Since it is common practice to record facial MEPs during active contraction of the target muscle, due the high threshold of the orofacial motor cortex to TMS (Cattaneo and Pavesi 2014), participants were tested during active contraction of the lips. To achieve a stable contraction, they were asked to hold a stick in their mouth with their lips only and to generate muscular tension matching an EMG signal of around 200 µV in amplitude. The operator inspected the EMG trace online and provided feedback to the participant whenever she deviated from the desired contraction level. Obviously, this procedure allowed for small fluctuations in background EMG. This variability however did not represent a major source of noise because all MEP amplitudes were normalized to the pre-stimulus EMG to correct for such variability (see the following paragraph and Fig. 3). In each trial TMS could be delivered either as a single testTMS pulse (single-pulse trials) or as the combination of condTMS + testTMS (dualpulse trials). The relative timing of condTMS and testTMS required a submillisecond temporal resolution and was therefore controlled by an input– output board, the1401 micro Mk-II unit (Cambridge Electronic Design). TMS single or dual-pulses were time-locked to the visual stimuli in Experiments 2 and 3 by means of the E-Prime 2.0 software (Psychology Software Tools Inc.). AQ4
Fig. 3 Example of EMG recordings in a randomly selected subject (Experiment 2). The mean EMG trace is shown in thick black lines, superimposed onto the 96 raw recordings (light grey lines). The upper panel shows the raw EMG and the lower panel shows the same EMG traces after rectification. The two dashed vertical lines indicate the 10–20 ms interval that was taken as window of interest for MEP analysis
27/02/2018, 10:14
e.Proofing
11 di 38
http://eproofing.springer.com/journals_v2/printpage.php?token=BizD...
EMG Recordings, EMG Pre-processing and MEP BaselineCorrection In all experiments, the right OOr and the right interosseus dorsalis primus muscle (1DI) were recorded with surface electrodes in a bipolar montage. Although responses were given with the lips, we decided to record also a hand muscle (the 1DI) as a control for the spatial specificity of the stimulation. We expected that neither PMCd, nor mouthM1 stimulation should spread to the hand motor area and therefore we did not expect to observe significant MEPs in the 1DI channel, in any of the experimental conditions. The analog signal was amplified 1000× by means of a 1902 two-channel amplifier (Cambridge Electronic Design, Cambridge, UK) and then digitalized with a sampling frequency of 4 kHz by means of a 1401 micro Mk-II unit (Cambridge Electronic Design, Cambridge, UK) and band-pass filtered between 20 Hz and 2 kHz. Offline pre-processing of the OOr EMG traces consisted in rectification and extraction of the area under the rectified EMG in the time window between 10 and 30 ms after testTMS (interval representative of the MEP) and of the area between 200 and 0 ms prior to condTMS (baseline, prestimulus EMG activity). In the 1DI channel the area between 20 and 40 ms from testTMS was considered representative of the MEPs. The choice of using areas rather than peak–peak amplitudes as a measure of MEP size is dictated by the anatomical location of motor end-plates in the OOr muscle (Cattaneo and Pavesi 2014) which are scattered throughout the muscle volume. Such spatial distribution of motor end-plates makes it impossible to use a standard “belly-tendon” montage and MEP waveforms tend to be polyphasic with no clearly defined positive or negative peaks. Participants
27/02/2018, 10:14
e.Proofing
12 di 38
http://eproofing.springer.com/journals_v2/printpage.php?token=BizD...
were keeping a stable voluntary contraction of the OOr muscle. Figure 3 shows an example of MEP recordings in a randomly selected subject. The illustration clearly indicates that the MEP signal is well-separated from the noise of voluntary contraction. However, MEP amplitudes are known to covariate strictly with the background EMG activity in the upper limb. The facilitatory effect of voluntary contraction introduces a great deal of variance in MEP amplitudes that is not related to the experimental manipulation but rather to spontaneous variations in the voluntary drive. To investigate the relation between baseline EMG and MEP amplitudes in our data we performed a simple regression analysis between non-corrected MEP areas and the relative background activity. The results showed a robust linear covariation of MEPs with the amount of voluntary activity (see Fig. 4). To reduce this source of noise we performed a baseline correction of MEP amplitudes from the OOr muscle, by dividing the MEP area by the relative pre-stimulus baseline EMG in individual trials. The window for pre-stimulus baseline EMG was of 200 ms prior to TMS. Similar approaches to the analysis of facial MEPs have been adopted previously in the literature (Watkins et al. 2003; Watkins and Paus 2004; Sato et al. 2010; Parmigiani et al. 2015). At this point of EMG pre-processing, the data from each trial was represented by a single value, i.e. that of the baseline-corrected MEP areas, obtained by the same procedure in all 3 experiments. Finally, to exclude that the pre-stimulus EMG activity could be differently represented between experimental conditions, in all 3 experiments we conducted ANOVAs on the baseline EMG data and found no significant distribution of baseline EMG between the different experimental variables (all p values > 0.24). The further step in the processing of MEPs was that to relate the conditioned-MEPs to the test-MEPs. This process was performed differently in the three Experiments and is described in detail below. Fig. 4 Linear covariance between background EMG activity and MEP amplitudes. The data from each of the 96 trials of each single subject are shown. For the sake of comparison between-subjects, both the background EMG and the facial MEP amplitudes were normalized within each subject to the maximum value in the distribution. The normalized values were therefore comprised between 0 and 1. Single regression analysis between EMG and MEP values showed a high degree 2 of covariance. Individual R values ranged between 0.18 and 0.72. The grand 2 average of individual R values was of 0.47. This indicated that around half of the variance of MEP amplitudes was fully accounted for by variations in 27/02/2018, 10:14
e.Proofing
13 di 38
http://eproofing.springer.com/journals_v2/printpage.php?token=BizD...
voluntary EMG contraction preceding TMS. This source of variability was eliminated from the main analysis of MEP by the procedure of baseline correction described in the methods
Experiment 1—Protocol Participants were sitting comfortably, the head on a chin rest and eyes freely open, wearing earplugs. They were asked to stay completely at rest aside from the controlled voluntary contraction of the OOr muscle. Five different inter stimulus intervals (ISIs) were used in dual-pulse trials: − 1, + 2, + 4, + 6 and + 8 ms (condTMS was delivered after testTMS in the − 1 ms ISI). Dual-pulse trials of each ISI were alternated with single-pulse trials in a fixed sequence that contained 5 dual-pulse trials (one for of the 5 ISIs) and 3 single-pulse
27/02/2018, 10:14
e.Proofing
14 di 38
http://eproofing.springer.com/journals_v2/printpage.php?token=BizD...
trials. The sequence was: single-pulse; dual-pulse; dual-pulse; single-pulse; dual-pulse; dual-pulse; single-pulse; dual pulse. The elementary sequence was repeated 12 times. The whole experimental session was therefore made of a total of 96 trials (36 single-pulse trials and 60 dual-pulse trial). The reason for adopting a fixed sequence was to be able to perform a “sliding window” normalization of conditioned-MEPs to test-MEPs (see below).
Experiment 1—MEP Normalization Conditioned-MEPs were normalized to test-MEPs. We adopted a procedure of dividing the area of conditioned-MEPs from single trials by the average of the area of the 2 test-MEPs in the 2 adjacent (one preceding and one following) trials. Each conditioned-MEP was therefore normalized to a sliding window of test-MEPs that followed the conditioned-MEP along the series of trials (Cattaneo and Barchiesi 2011; Maule et al. 2015; Parmigiani et al. 2015). The rationale for using a sliding window to normalize conditioned-MEPs to testMEPs is that this minimizes the very slow fluctuations in MEP amplitude that may occur during the course of experimental sessions. The resulting ratio is distributed between 0 and + ∞, therefore not distributed normally. To achieve normality of the data we applied a further manipulation, i.e. a base 10 logarithmic transformation, to each value (Tukey 1977). In this way, data were symmetrically distributed around 0, between − ∞ and + ∞ (the actual data were successfully tested for normality by means of Shapiro–Wilk’s test). Negative values indicated amplitude of conditioned-MEPs smaller than the instantaneous value of test-MEPs, whereas positive values indicated amplitude of conditioned-MEPs larger than the instantaneous value of testMEPs. At this step, the result of the procedure was a series of 60 MEP ratios (5 ISIs × 12 repetitions) for each participant.
Experiment 1—Statistical Analysis We first excluded trials with MEPs that exceeded 2 standard deviations (SD) from the individual average values. The aim of statistical analysis was to assess whether, in any of the 5 ISIs, the MEP ratio was significantly deviating from the value of zero (because the data had been log-transformed) and ultimately indicating whether conditioned-MEPs were significantly different from test-MEPs. To do so we performed a series of 5 t-tests, assessing the null hypothesis that the mean of the MEP ratios was not different from zero. The p value was Bonferroni-corrected for the 5 multiple comparisons, and adjusted to p = 0.01.
27/02/2018, 10:14
e.Proofing
15 di 38
http://eproofing.springer.com/journals_v2/printpage.php?token=BizD...
Experiment 2—Protocol In Experiment 2, participants performed a delayed simple reaction time task and TMS was delivered in an event-related timing, during the SET-period. Participants had an additional lateral head-constraint on the chin rest, which assured head stability and minimal movement during the execution of the orofacial action. They wore earplugs and, as in Experiment 1, they were asked to keep the contraction of the muscles constant, in a way in which they were able to hold a stick between their lips firmly also while they were waiting for the cues, assisted by the operator behind them. Stimuli were presented with the E-Prime 2.0 software, on a 75 Hz (1680 × 1050 resolution) 20″ monitor, at 45 cm of distance from the participant eyes. The experiment was organized in four similar blocks, each consisting of 96 trials. The inter trial interval was randomly jittered between 2500 and 3500 ms. Trials started with a green fixation cross, indicating the SET-period (SET-period), during which participants had to stay still and wait for the GO-signal (a circle in the middle of the screen), occurring 900 ms later. After the response (lifting a stick with their lips as fast as possible) was given, the corresponding reaction time was displayed on the screen, serving as feedback of individual performance. Any anticipation of the response prior to the GO-signal was considered as error. It should be noted that, given the fixed duration of the SET-period, the onset of the GO-signal was entirely predictable throughout the experiment.
Experiment 2—Apparatus for Lip Response Collection All participants held a stick with their lips to collect the motor responses. To stabilize and ensure a constant OOr contraction throughout the experiment, a 15 g weight was suspended at the end of the stick. The actual motor response consisted in lifting the stick from a starting point until an end position was met, after which no more lifting was possible. At the instant when the end position was reached, a circuit was closed providing a + 5 V square-wave output. The output signal was transmitted to a PC via the serial port by the E-Prime 2 software. Every trial, such response time (RespT) was displayed on the screen to give on-line feedback to the participants. The tip of the response stick contained also a 3-axe analog accelerometer, the output of which was constantly recorded throughout the trial length, by means of the same analog– digital conversion equipment described for EMG recordings. The accelerometer’s signal was analyzed offline to provide accurate estimation of the onset of the motor response, i.e. of reaction times (RTs). RespTs indicated by E-prime were used uniquely for the display of single-trial feedback, while
27/02/2018, 10:14
e.Proofing
16 di 38
http://eproofing.springer.com/journals_v2/printpage.php?token=BizD...
RTs were actually used for the statistical analysis.
Experiment 2—TMS Timing During the SET Period The configuration and placement of the two TMS coils was the same as in Experiment 1. TMS was delivered as single-pulses or dual-pulses. The ISI for dual-pulse TMS was set to 6 ms as this had been proven to be the optimal interval to test cortico–cortical connectivity between PMCd and M1 (see Parmigiani et al. 2015, and Experiment 1 in the current work). In each trial only one single- or dual-pulse TMS was delivered. TMS was applied during the SET-period at different timings in different trials, in order to cover the whole duration of the SET-period itself (900 ms). Specifically, TMS was delivered along the duration of the SET-period at 4 different timings, corresponding to 0, 300, 600 and 900 ms after the onset of the SET-period. Dual-pulse trials were equally distributed between the 4 different TMS timings. Trial types were classified therefore in 8 possible categories, according to a STIMULATION (2 levels: single- or dual-pulse) × TIME (4 levels: 0, 300, 600 and 900 ms) factorial design, in which each trial type was repeated 48 times, for a total of 384 trials per participant. The order of trials with different TMS timings was fully randomized in the experimental session. Conversely, single-pulse trials and dual-pulse trials were alternated in a fixed order.
Experiment 2—Data Processing and Statistical Analysis Qualitative assessment of the participants’ RTs indicated that a significant amount of responses was produced prior to the GO-signal during the SETperiod, while the main bulk of responses appeared to be given appropriately in response to the GO-signal. We therefore applied a procedure to exclude such trials, based on modelling the individual subjects’ RTs on a Gaussian curve, to estimate the lower limit of the RT distribution. However, to optimize curve fitting, outliers should be removed. With this aim we first of all we removed trials in which responses were given prior to 100 ms after the GO-signal with the aim of excluding anticipatory responses. The 100 ms cutoff may seem arbitrary, but note that the actual cutoff that we applied resulted from the Gaussian fit (see below) and corresponded to some tens of ms higher than 100 ms. Additionally, consider that the lower limit of visual reaction times in humans within the cranial district is around 120 ms (Kirchner and Thorpe 2006). In the study of orofacial reflexes, it is widespread practice (see for example: Brinkworth et al. 2003; Pavesi et al. 2000 or Cattaneo et al. 2007) to
27/02/2018, 10:14
e.Proofing
17 di 38
http://eproofing.springer.com/journals_v2/printpage.php?token=BizD...
consider any response occurring above 80 ms as possibly contaminated by voluntary reactive activity, because in the masseter muscles simple RTs to tactile stimuli as fast as 80 ms have been recorded (Brodin et al. 1993). In the second step we fitted the remaining trials to a Gaussian distribution. The average number of such anticipation responses between subjects was of 10% (subject with minimum n. of anticipation responses = 3%; subject with maximum number of anticipation responses = 19%). After trimming the data, only trials with RTs falling within the mean ± 2 SD of the fitted distribution were taken into consideration for further analysis, though these were a minimal proportion (overall 2% of all trials). MEP areas were extracted and baseline-corrected similarly to Experiment 1. In the present experiment, we decided not to follow the standard analytical approach of normalizing paired-pulse MEPs to single-pulse MEPs. This type of analysis does an excellent job in constraining the data in one single index, but has two main limitations. It does not allow, in dynamic situations to determine the relative contribution of single-pulse MEPs vs. paired-pulseMEPs to the observed effects. Second, and most important, in the present experiment we were interested in absolute terms in inhibitory or facilitatory effects of condTMS. Analysis of variance of the paired-pulse/single-pulse MEP ratio describes variations of distribution of the index between different conditions, but is not capable of describing absolute variations of single values with respect to the ratio value of one (indicating no effect of conditioning pulse). We therefore decided to use a multivariate approach in which single-pulse and dual-pulse MEPs were not collapsed in a single ratio but rather kept separate as two levels of one factor in a bivariate ANOVA, that was therefore structured as a 2 × 4 design, with the factors STIMULATION (2 levels: single- or dual-pulse) and TIME (4 levels: 0, 300, 600 and 900 ms). Planned comparisons were the 4 paired comparisons of dual-pulse data with single-pulse data within each of the four timings of TMS. Significance threshold was adjusted for the 4 multiple comparisons to p = 0.0125. In this experiment we also analyzed the RTs’ distribution by means of a bivariate ANOVA with the STIMULATION and TIME factors, structured identically to the ANOVA used for MEP amplitudes.
Experiment 3—Protocol and TMS Timing During the SET Period Experiment 3 was structured similarly to Experiment 2, but explored different durations of the SET-period. Instead of a single block with a 900 ms SET-
27/02/2018, 10:14
e.Proofing
18 di 38
http://eproofing.springer.com/journals_v2/printpage.php?token=BizD...
period (as in Experiment 2), we used 3 different SET-periods, 1500, 1800 and 2100 ms, each in one of 3 different within-subjects blocks. The 3 blocks were presented in counterbalanced order between the subjects. The duration of the SET-period did not vary within each block, therefore the timing of the GOsignal was entirely predictable. Trial structure and behavioral tasks were the same as in Experiment 2, but with a varying number of TMS timings, in order to cover the whole of the SET periods in steps of 300 ms. Trials in the 1500 ms block had 6 different TMS timings: 0, 300, 600, 900, 1200 and 1500 ms. Trials in the 1800 ms block had 7 different TMS timings: 0, 300, 600, 900, 1200, 1500 and 1800 ms. Trials in the 2100 ms block had 8 different TMS timings: 0, 300, 600, 900, 1200, 1500, 1800 and 2100 ms. Consequently, the 1500 ms block was designed according to a 2 × 6 within-subjects factorial design with 2 STIMULATION types and 6 TIME. The 1800 ms block was designed according to a 2 × 7 within-subjects factorial design with 2 STIMULATION types and 7 TIME. The 2100 ms block was designed according to a 2 × 8 within-subjects factorial design with 2 STIMULATION types and 8 TIME. In all blocks, the number of repetitions per experimental condition was set to 9 trials, resulting in 108 trials in the 1500 ms block, 126 trials in the 1800 ms block and 144 trials in the 2100 block. EMG analysis for MEP extraction and the exclusion of trials with anticipatory responses were performed as in Experiment 2, but within each of the 3 blocks separately.
Experiment 3—Data Processing and Statistical Analysis Trials were trimmed similarly to Experiment 2, by removing responses occurring prior to the GO-signal (see above). In the 1500 ms SET-period, the average number of anticipation responses between subjects was of 12% (subject with minimum n. of anticipation responses = 5%; subject with maximum number of anticipation responses = 17%). for the 1800 ms SETperiod the average number of anticipation responses between subjects was of 14% (subject with minimum n. of anticipation responses = 2%; subject with maximum number of anticipation responses = 21%). for the 2100 ms SETperiod the average number of anticipation responses between subjects was of 10% (subject with minimum n. of anticipation responses = 3%; subject with maximum number of anticipation responses = 24%). Following this trimming procedure, the remaining outlier RTs exceeding the mean ± 2 SD were only 1% of all trials. Statistical analysis was performed separately for each block, because the variable number of TMS timings prevented a balanced withinsubjects analysis of the whole dataset. Three separate repeated-measures 2-way ANOVAs were performed, with STIMULATION (2 levels: single- or
27/02/2018, 10:14
e.Proofing
19 di 38
http://eproofing.springer.com/journals_v2/printpage.php?token=BizD...
dual-pulse) and TIME (6, 7 or 8 levels, according to the block) as factors. As in Experiment 2, planned comparisons were the paired comparisons of dualpulse data with single-pulse data within each of the time-points of TMS. Significance threshold was therefore adjusted to p = 0.008 (6 comparisons) for the 1500 ms block, to p = 0.007 (7 comparisons) for the 1800 ms block and to p = 0.006 (8 comparisons) for the 2100 ms block. In addition to the planned analyses, we explored post-hoc the time-course of PMCd-dependent corticospinal inhibition during the SET-period by standardizing the duration of the period to the same value in all the 3 conditions. This was made simply by dividing the time points by the SET-period duration. For example, the 300 ms time point in the 1500 ms dataset became time point 0.2 (i.e. 300/1500 ms). Conversely, the same time point of 300 ms in the 2100 ms dataset became the time point 0.14 (i.e. 300/2100 ms). In this way, all 3 conditions of experiment 3 had the same standardized duration of the SET period, from 0 to 1. In order to quantify this data we used the curve fit tool box of the MATLAB software on the average data from experiments 2 and 3 to fit them first to a Gaussian function:
Finally, an exponential component to account for the increase of the values in the right-hand tail of the distribution (i.e. towards the GO-signal) was added by using the following function:
With the parameters a2 = 0.007, b2 = 1.93 and c2 = − 0.39. The the previous sentence on parameters a2, b2 and c2 has been deleted because it is a duplicate of
data points and the fitted curve are represented in Fig. 8b. The data from Experiment 2 could not be analyzed alone in the same way because they contain too few data points.
the results
Results None of the subjects reported any significant discomfort from stimulation and no side-effects of TMS, neither immediate nor delayed, were observed in any of them. Across all 3 experiments, for the 55 mm coil the mean motor 27/02/2018, 10:14
e.Proofing
20 di 38
http://eproofing.springer.com/journals_v2/printpage.php?token=BizD...
threshold for the OOr muscle was 61% (SD = 4.78) of the stimulator’s output. Mean stimulation intensity was 70% (ranging 57–79%) of maximal stimulator output. For the 35 mm coil, the mean motor threshold for the OOr muscle was 65% (SD = 4.22) of the stimulator’s output. Mean stimulation intensity was 77% (ranging 58–87%) of maximal stimulator output. Recordings from the 1DI muscle showed systematically the absence of MEPs (defined as waveforms time-locked to TMS with amplitude > 50 µV) in all subjects.
Experiment 1 All participants were able to keep the desired target activation of the OOr muscle. Frequent pauses in the experiment allowed for minimal fatiguing in an otherwise demanding task if performed continuously. Figure 5 illustrates the mean log-transformed MEP ratios. Statistical analysis by means of Bonferroni-corrected t-tests (corrected significance threshold: p = 0.01) showed significant deviation of the mean values of normalized MEP ratios from the zero value only for the 6 ms ISI (p = 0.0033), all others p values > 0.2. Fig. 5 Results of Experiment 1. The average values (n = 16) of the logarithm of the normalized MEP areas subjects are shown for each of the ISIs. Error bars indicate 95% confidence intervals
Experiment 2 The mean MEP areas are illustrated in Fig. 6. The two-way ANOVA showed a
27/02/2018, 10:14
e.Proofing
21 di 38
http://eproofing.springer.com/journals_v2/printpage.php?token=BizD...
2
significant interaction of TIME × TMS [F(3, 45) = 5.60, p = 0.002, η = 0.27]. The data were then divided into two separate univariate ANOVAs, for each of the TMS modalities with TIME as the only factor. The results indicated that the single-pulse MEPs did not show any change in their distribution over time 2 [F(3, 45) = 0.22, p = 0.88, η = 0.01]. On the contrary, the partial analysis on paired-pulse indicated a significant main effect of TIME [F(3, 45) = 4.12, p = 2 0.011, η = 0.22]. The 4 planned comparisons between the paired-pulse and the single-pulse data showed significant results only for the 600 ms interval, with paired pulse MEPs being significantly smaller than single-pulse MEPs (p = 0.004). The ANOVA on RTs showed a main effect of STIMULATION 2 [F(1,15) = 6.33, p = 0.024, η = 0.31] indicating that RTs were faster in dualpulse trials than in single-pulse trials and a main effect of TIME [F(3,45) = 19.4, p