RESEARCH ARTICLE
Spatial and Temporal Distribution of Culicoides Species in Mainland Portugal (2005–2010). Results of the Portuguese Entomological Surveillance Programme Rita Ribeiro1☯, Anthony J. Wilson2☯, Telmo Nunes1☯, David W. Ramilo1, Rita Amador3, Sara Madeira1, Filipa M. Baptista1, Lara E. Harrup4, Javier Lucientes5, Fernando Boinas1* 1 Centre for Interdisciplinary Research in Animal Health (CIISA), Faculty of Veterinary Medicine, University of Lisbon, Lisbon, Portugal, 2 Integrative Entomology Group, The Pirbright Institute, Pirbright, Woking, Surrey, United Kingdom, 3 Direção-Geral de Alimentação e Veterinária, Food and Veterinary Central Services, Campo Grande, Lisbon, Portugal, 4 Entomology Group, Vector-borne Viral Diseases Programme, The Pirbright Institute, Ash Road, Pirbright, Woking, Surrey, United Kingdom, 5 Parasitology and Parasitic Diseases, Department of Animal Pathology (Animal Health), Veterinary Faculty, University of Zaragoza, Zaragoza, Spain OPEN ACCESS Citation: Ribeiro R, Wilson AJ, Nunes T, Ramilo DW, Amador R, Madeira S, et al. (2015) Spatial and Temporal Distribution of Culicoides Species in Mainland Portugal (2005–2010). Results of the Portuguese Entomological Surveillance Programme. PLoS ONE 10(4): e0124019. doi:10.1371/journal. pone.0124019 Academic Editor: Richard Paul, Institut Pasteur, FRANCE Received: November 14, 2014 Accepted: March 9, 2015 Published: April 23, 2015 Copyright: © 2015 Ribeiro et al. This is an open access article distributed under the terms of the Creative Commons Attribution License, which permits unrestricted use, distribution, and reproduction in any medium, provided the original author and source are credited. Data Availability Statement: All relevant data are within the paper and its Supporting Information files. Funding: This work was supported by Project National entomological surveillance programme of Culicoides midges, vectors of Bluetongue virus, reference: NINGA 7185573 Funded by Direção Geral de Veterinária. Author who received the funding: FB (coordinator of the programme at CIISA-Faculdade de Medicina Veterinária). AJW and LH were funded by the BBSRC [BBS/E/I/00001409]. Funders at Direção Geral de Veterinária had a role in the data
☯ These authors contributed equally to this work. *
[email protected]
Abstract Bluetongue virus (BTV) is transmitted by Culicoides biting midges and causes an infectious, non-contagious disease of ruminants. It has been rapidly emerging in southern Europe since 1998. In mainland Portugal, strains of BTV belonging to three serotypes have been detected: BTV-10 (1956-1960), BTV-4 (2004-2006 and 2013) and BTV-1 (2007-2012). This paper describes the design, implementation and results of the Entomological Surveillance Programme covering mainland Portugal, between 2005 and 2010, including 5,650 caches. Culicoides imicola Kieffer was mostly found in central and southern regions of Portugal, although it was sporadically detected in northern latitudes. Its peak activity occurred in the autumn and it was active during the winter months in limited areas of the country. Obsoletus group was present at the highest densities in the north although they were found throughout the country in substantial numbers. Culicoides activity occurred all year round but peaked in the spring. A generalized linear mixed model was developed for the analysis of the environmental factors associated with activity of the species of Culicoides suspected vectors of BTV in the country. For C. imicola Kieffer, the most important variables were month, diurnal temperature range (DTR), the number of frost days (FRS) and median monthly temperature (TMP). For the Obsoletus group, the most important factors were month, diurnal temperature range (DTR), and linear and quadratic terms for median monthly temperature (TMP). The results reported can improve our understanding of climatic factors in Culicoides activity influencing their distribution and seasonal pattern.
PLOS ONE | DOI:10.1371/journal.pone.0124019 April 23, 2015
1 / 19
Spatial and Temporal Distribution of Culicoides Species in Portugal
collection and study design, but had no role in the analysis, decision to publish, or preparation of the manuscript. Competing Interests: The authors have declared that no competing interests exist.
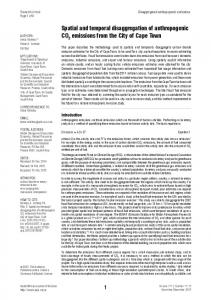
Introduction Bluetongue (BT) is an infectious disease of ruminants caused by bluetongue virus (BTV), an arbovirus with 26 recognised serotypes [1]. Clinical disease is most common in sheep and certain species of deer [2] but is also seen in cattle [3,4]. Outbreaks of BT often have a high economic impact, partly as a consequence of the restrictions on domestic and international animal movement following confirmation of an outbreak. Since 1998, BTV activity in Europe and in Mediterranean basin has increased substantially [5] and since 2006 the virus has emerged in northern Europe. Bluetongue virus is transmitted primarily by several species of Culicoides (Diptera: Ceratopogonidae). As a consequence, the distribution and intensity of BTV infection are dependent on the distribution and abundance of the Culicoides vectors [6]. Although the Afrotropical species C. imicola Kieffer is considered to be the most important vector in most parts of Africa and southern Europe, species in the Obsoletus group and group Pulicaris have also been implicated as efficient vectors of certain strains of BTV during recent outbreaks in northern Europe [2,7]. In addition, vertical transmission in cattle has been observed for at least one field strain of BTV [8,9] and oral transmission is suspected [10], possibly explaining the observed ability of BTV to “overwinter” for long periods in the absence of vector activity [11]. Bluetongue virus and other Culicoides-borne viruses have caused a number of outbreaks in Portugal since the middle of the twentieth century. The first recorded outbreak of BTV in Portugal began in 1956 and affected the southern and central eastern regions of the country (Fig 1). This outbreak was caused by a strain of BTV-10 which was probably introduced by windborne Culicoides from Morocco [12]. A monovalent live attenuated vaccine supplied by the Onderstepoort Veterinary Institute in South Africa was used to vaccinate sheep in the affected area of the country and the outbreak was largely eradicated by 1958, although the region was not declared free of disease until 1960 [13]. Another Culicoides-borne virus, African horse sickness virus (AHSV), was then introduced in 1989, most probably via windborne Culicoides blown across the Guadiana River with origin in the 1987–1990 Spanish epizootic [14]. The resulting outbreak was restricted to the southern region (Fig 1) of Portugal and was eradicated after massive vaccination of the equidae species in the whole country using a live attenuated monovalent vaccine again provided by the Onderstepoort laboratory in South Africa [14]. A second strain of BTV (this time of BTV-4) appeared in November 2004 in areas of the central-west and southern regions of Portugal bordering Spain. This resulted in an outbreak which persisted until the end of 2006 [13]. In 2007 a strain of BTV-1 was detected in the Alentejo region, in September 2007, in a county located at the Spanish border, two months after a BTV-1 outbreak began in Spain [15]. Between September and December 2007, 158 BTV-1 outbreaks were reported in regions in the south and center of country. However, since 2008, BTV-1 has spread to the north of the country, showing a different distribution than BTV-4, BTV-10 and AHSV. In 2008, 78 BTV-1outbreaks were reported in the center and south (83%) and in the northern (17%) regions. In 2009 the majority of the 129 BTV-1outbreaks were reported in the northern regions (67%) and in 2010 only six BTV-1 outbreaks occurred in the center and southern regions. This BTV-1strain may still be circulating in the area, although at very low levels; only one outbreak was confirmed in 2011 and other three outbreaks in 2012. In 2013 BTV-4 re-emerged again in the mainland territory, causing 10 outbreaks in Algarve region [15–17]. The potential exists for other disease-causing Culicoides-borne viruses, such as the recently-identified Schmallenberg virus (SBV) [18], to be introduced to Portugal via windborne vector transportation or the accidental importation of infected hosts potentially with substantial consequences for animal health and welfare, international trade and livestock production.
PLOS ONE | DOI:10.1371/journal.pone.0124019 April 23, 2015
2 / 19
Spatial and Temporal Distribution of Culicoides Species in Portugal
Fig 1. Historical extent of bluetongue virus and African horse sickness virus outbreaks in Portugal before 2004. doi:10.1371/journal.pone.0124019.g001
In recognition of the high and continuing threat to the Portuguese livestock sector from Culicoides-borne viruses, the Portuguese authorities established a National Entomological Surveillance Programme (ESP) in 2005, with the objective of collecting and identifying Culicoides species in Portugal, mapping their distribution and quantifying their abundance and association with outbreaks of Culicoides-transmitted diseases. The ESP was reduced in scope in 2010
PLOS ONE | DOI:10.1371/journal.pone.0124019 April 23, 2015
3 / 19
Spatial and Temporal Distribution of Culicoides Species in Portugal
because BTV activity in Portugal had declined since 2010. The archipelagos of Azores and Madeira were also included in the programme, but as BTV was absent from these regions, the programme in the islands was carried out with a different design using less frequent sampling. As a consequence of the continuing emergence of BTV in Europe since 1998, similar national entomological surveillance programmes have been established in several affected countries. The data generated by such programmes is potentially very valuable for a variety of purposes such as identifying suitable habitats for vectors, describing vectors distribution, continentallevel transmission modelling and the development of vector population models that are capable of describing the response of vector populations to a broad range of environmental conditions, potentially allowing the consequences of future environmental change to be anticipated. Only one work with the aim to predict the presence and abundance of C. imicola in Portugal has been published. Tatem et al., 2003 developed a set of models using trapping data obtained between 2000 and 2001, and described by Capela et al., (2003), together with 41 remotelysensed variables [19]. Four variables were considered to have environmental significance: normalized difference vegetation index (NDVI, a measure correlated with soil moisture, rainfall and vegetation biomass, coverage and productivity), middle infra-red reflectance (MIR, correlated with the water content, surface temperature and structure of vegetation canopies), land surface temperature (LST) and air temperature (TAIR) [19]. This study has shown that what determines the presence of C. imicola is strongly correlated with middle infra-red reflectance, and consequently also correlated with vegetation structure and surface temperature, and how much each varies throughout the year. The abundance of this species was determined by the annual timing of the vegetation abundance peak, itself related to soil moisture levels [19]. However, this study does not evaluate determinants for Obsoletus group presence and abundance. Since BTV outbreaks in northern Europe specimens belonging to this group, are recognized as important vectors of disease [7]. In this manuscript, we describe the findings of the official Entomological Surveillance Programme from mainland Portugal during the period from September 2005 to August 2010, when the national entomological surveillance programme was fully in place and the majority of cases of BTV were detected. We also use a generalised linear mixed model (GLMM) to help understand the ability of climatic drivers commonly cited as important for vector activity to explain the probability of detecting C. imicola or Obsoletus group during our collections, and compare our insights into the importance of climatic drivers to those suggested by similar analyses of Culicoides activity, distribution or abundance in Portugal.
Materials and Methods Entomological Surveillance Programme The ESP was designed to conform to the requirements of European Council directive 2000/75/ EC, and it is similar to that used for previous Culicoides surveillance programmes in Italy [20] and Greece [21] Mainland Portugal was divided into 45 geographical units (GUs) each 50km by 50km (Fig 2). Within each GU, suitable farms were identified using the national database of farms and farmers were contacted by the National Authority for Animal Health (DirecçãoGeral de Veterinária, DGV; http://www.dgv.min-agricultura.pt/) and asked if they agreed to participate in the national programme for bluetongue control. All the farmers gave permission to place the traps in their farms, as it was explained that it would be a good contribution for the protection of animal health. To be eligible for inclusion, farms had to be located at a minimum distance of 10km from other sampled holdings and at least 2.5km from the coast, and contain a minimum of five horses or ruminants (preferably cattle). Recruited farms were not permitted to apply insecticides for the duration of the programme. Four GUs in mainland Portugal were
PLOS ONE | DOI:10.1371/journal.pone.0124019 April 23, 2015
4 / 19
Spatial and Temporal Distribution of Culicoides Species in Portugal
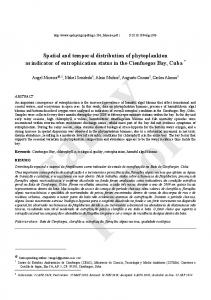
Fig 2. Design of the Entomological Surveillance Programme through mainland Portugal, showing sampling effort by GU. doi:10.1371/journal.pone.0124019.g002
excluded from the study due to low livestock densities (GUs 2, 41, 43 and 45), and the number of farms recruited in each of the remaining GUs varied between 1 and 18. Additional farms were recruited close to the edges of the historically affected zone to allow more precise monitoring of these regions. On each of the farms in the study, Center for Disease Control (CDC) miniature light traps (model 1212; John W.Hock, Gainesville, FL, US) fitted with a 4W UV light and a suction fan were placed outdoors at a height of 1.7–2.0 m and at a distance of up to 30m from the livestock. Insects were collected into plastic shatterproof beakers containing approximately 375ml of 70% ethanol and 125ml of ethylene glycol, giving a final volume of 500 ml. The traps were powered using a 6V battery and were turned on by an LCS-2 photoelectric cell that activated the
PLOS ONE | DOI:10.1371/journal.pone.0124019 April 23, 2015
5 / 19
Spatial and Temporal Distribution of Culicoides Species in Portugal
trap at dusk and deactivated it at dawn. Samples were collected and traps reset by technical staff of the Regional Veterinary Services. Although the ESP formally started in May 2005, six months after the 2004 outbreak, collections did not begin until September 2005 as a consequence of the time required to train staff and to purchase and distribute suitable equipment and consumables. A higher number of catches were performed during spring and autumn to better define the vector free period, which is defined by the total absence of C. imicola specimens and less than five parous/pigmented Culicoides per trap. This is important for the establishment of vector free areas and for the implementation of movement restrictions [22]. Samples were sent to the Interdisciplinary Centre of Research in Animal Health (CIISA) at the University of Lisbon for identification. Upon arrival they were transferred to 96% ethanol and identified using morphological keys based on wing patterns [23–25]. This permitted the identification of suspected vector species including C. imicola, members of the group Pulicaris (C. pulicaris (L.); C. lupicaris, C. newsteadi Austen, C. punctatus (Meigen)) and members of the Obsoletus group (C. obsoletussensu stricto (Meigen); C. chiopterus (Meigen); C. dewulf Goetghebuer;, C. scoticus Downes and Kettle; C. montanus Shakirzjanova), as well as C. circumscriptus Kieffer, C. maritimus Kieffer and C. univittatus Vimmer [26,27]. Other Culicoides were stored for more detailed taxonomic studies. Sex and the physiological condition of females (nulliparous/unpigmented, blood-fed, gravid, or parous/pigmented) were also recorded. In the case of large samples, a sub-sample of 2.5% (for samples containing more than 5,000 individuals) or 25% (for samples containing fewer than 5,000 individuals but more than 2,000) was analysed, following published guidelines [28]. Results were provided to the DGV in real time to inform policy makers in relation to the BTV situation, specifically animal movement restrictions and the prioritization of vaccination areas. Trapping sites were geo-referenced with a Trip Tracker GPS system (Amaryllo, Netherlands) wherever possible; when geographical coordinates could not be obtained, coordinates of the centroid of the parish were used. At each insect trapping site, environmental factors which might be expected to influence the presence/absence of BTV vectors were also noted. Associated climate data, monthly diurnal temperature range (DTR), frost days (FRS), precipitation (PRE), and median temperature (TMP), were extracted from the relevant pixels of the Climate Research Unit high-resolution gridded climatology (CRU TS3.10) raster layer (29) to form the basis of the analyses below. The primary variables (DTR, PRE and TMP) are monthly based values, derived from archives of climate station records from January 1901 to December 2009. Secondary variable (FRS) is entirely derived from the primary variables [29]. Variables were zero-centred and scaled to yield a standard deviation of one. However, minimum temperature (TMN), maximum temperature (TMX), potential evapotranspiration (PET), vapour pressure deficit (VAP) and rainday counts (WET) were excluded due to high levels of correlation.
Statistical analysis The datasets used in this study included all catches made within the Portuguese national entomological surveillance programme between 2005 and 2010 (S1 Table). All maps were designed using Quantum GIS version 1.8.0 [30]. A map (Fig 2) identifies all sampling sites and the number of catches performed in each GU for all the study period, representing the sampling effort by GU. Two other figures represent the sampling sites where C. imicola (Fig 3) or Obsoletus group (Fig 4) were captured, as well as the overall maximum capture of each species by GU in the five years in study. Also, presence or absence for each species in each GU was plotted by month (Fig 5 and Fig 6). Shapefiles for the Portuguese administrative areas from the “Carta
PLOS ONE | DOI:10.1371/journal.pone.0124019 April 23, 2015
6 / 19
Spatial and Temporal Distribution of Culicoides Species in Portugal
Fig 3. Sampling sites with presence of C. imicola Kieffer and maximum level collected per GU, during ESP. doi:10.1371/journal.pone.0124019.g003
Administrativa Oficial de Portugal” (CAOP) were downloaded from the Portuguese Geographical Information (Informação Geográfica; iGeo) repository (http://www.igeo.pt/produtos/ cadastro/caop/caop_vigor.htm). Wilcoxon two-sample test was used to compare pairwise the northern, center and southern groups of GUs as regard the maximum captures of C. imicola and Obsoletus group, during all the five years in study. A p-value less than 5% was chosen as significant level.
PLOS ONE | DOI:10.1371/journal.pone.0124019 April 23, 2015
7 / 19
Spatial and Temporal Distribution of Culicoides Species in Portugal
Fig 4. Sampling sites with presence of the Obsoletus group (C. obsoletus (Meigen); C. chiopterus (Meigen); C. dewulfi Goetghebuer; C. scoticus Downes and Kettle; C. montanus Shakirzjanova) and maximum level collected per GU, during ESP. doi:10.1371/journal.pone.0124019.g004
To determine the relative importance of season and climatological factors in the likelihood of collecting specimens from the Obsoletus group or C. imicola, a generalized linear mixed model (GLMM) approach was used with binomial errors and a logit link function in which collection site was represented as a random effect. A generalised model was used because we are modelling a binomial response (presence or absence of the vector species or group) and a mixed model was necessary because repeated
PLOS ONE | DOI:10.1371/journal.pone.0124019 April 23, 2015
8 / 19
Spatial and Temporal Distribution of Culicoides Species in Portugal
Fig 5. Presence and absence of C. imicola Kieffer per GU by month. doi:10.1371/journal.pone.0124019.g005
measures were taken at the same site, introducing random effects. GLMMs combine the properties of linear mixed models, which incorporate random effects, and generalised linear models, which handle nonnormal response data by using link functions [31]. The GLMM was implemented in R version 3.1.0 [32] using the function “bglmer” in the ‘blme’ package. The full models included the factors ‘month’, ‘DTR’, ‘FRS’, ‘PRE’ and ‘TMP’, with ‘SITE’ as a random effect. Quadratic terms for ‘PRE’ and ‘TMP’ were also included because the biological effects of these variables might reasonably be expected to exhibit local maxima or minima within the observed range and for the species studied. Backward stepwise elimination of variables was then implemented by dropping each term individually and performing a likelihood ratio test on the difference in the Akaike Information Criterion (AIC) using the function ‘dropterm’ from the ‘MASS’ package.
Results Entomological surveillance programme Two-hundred and seventy-four farms were sampled between September 2005 and December 2010 as part of the ESP, of which 212 (77.4%) were in mainland Portugal. In addition to the four GUs already mentioned where no farms were recruited due to low livestock densities, no collections were received from the farm in GU 19. The five GUs with the largest number of catches were GUs 20, 23, 17, 25 and 16, which accounted for 26% of the total number of catches (Fig 2). A total of 5,650 catches were performed in mainland Portugal. The highest number of catches was registered in the central region (57.7% of the total, 3,261/5, 650 catches) and the
PLOS ONE | DOI:10.1371/journal.pone.0124019 April 23, 2015
9 / 19
Spatial and Temporal Distribution of Culicoides Species in Portugal
Fig 6. Presence and absence of the Obsoletus group (C. obsoletus (Meigen); C. chiopterus (Meigen); C. dewulfi Goetghebuer; C. scoticus Downes and Kettle; C. montanus Shakirzjanova) per GU by month. doi:10.1371/journal.pone.0124019.g006
lowest number of catches occurred in the northern region of the country (21.6%, 1,221/ 5,650 catches). The number of collections by month varied from a minimum of 37 catches (0.65% of total) in December 2010 to 135 catches (2.4% of total) in April 2008. The months with the highest number of catches were April 2008, March 2009, March 2007 and July 2008. Regarding the season of the year, the highest number of catches occurred during autumn (1,587 catches, 28% of total) while the lowest number of catches was verified in winter (1,186 catches, 21% of total). Culicoides were present in 62.6% of valid catches (3,632/5,800) and 28 different species were identified. The potential vector species most commonly caught were Culicoides imicola and members of the Obsoletus group [33]. C. imicola was present in 74.8% of the collections, while specimens from Obsoletus group were present in only 7.7%. Group Pulicaris was present in only 0.1% of the collections. The central region of the country accounted for the highest catches of C. imicola. The highest maximum values of specimens captured, 107,880 and 450,800 specimens were reported respectively, in GUs 22 and 23 (Fig 3). GU23 was also the highest altitude location where
PLOS ONE | DOI:10.1371/journal.pone.0124019 April 23, 2015
10 / 19
Spatial and Temporal Distribution of Culicoides Species in Portugal
Fig 7. Seasonality of C. imicola and Obsoletus group between September 2005 and December 2010. doi:10.1371/journal.pone.0124019.g007
C. imicola was collected, 1,654m above sea level. C. imicola was collected less frequently and in smaller quantities in the north of the country, where the maximum catch was three individuals (in GU 10). The northernmost collection containing C. imicola was made at 41.92°N. Catches of Obsoletus group were highest in the north and centre of Portugal. GUs 4, 20 and 21 had the highest catches, with maximum catches of 12,120 specimens in GU4, of 6,179 specimens in GU21 and 6,160 specimens in GU20. The smallest catches of this group were observed in the south of the country, particularly in GUs 29 and 32 where collections only reached a maximum of one specimen per catch (Fig 4). C. imicola was collected in fewer GUs than the Obsoletus groups. Comparing our data with the most recent previous survey of Culicoides in Portugal dating from 2001–2002 [6], we detected C. imicola in five more GUs, mainly in the northern regions (GU number 1, 5, 8, 16 and 17), although no specimens were found in GU11 where the species had previously been reported. The maximum number of C. imicola captures per GU was lower in the northern region when compared with both centre and southern regions (Wilcoxon two-sample test, p < 0.001). There were no differences between C. imicola collections in the centre and south regions. For Obsoletus group, the same test did not shown differences between the three pairs of regions (Wilcoxon two-sample test, p >0.05). Fig 7 shows the monthly average of C. imicola and Obsoletus group collections in the mainland territory between September 2005 and December 2010. In general, C. imicola activity began between March and April, but between 2007 and 2008 there were collections of a limited number of C.imicola in January. The largest collections of this species were made in July, August and September 2006 and September and October 2007, with collections exceeding 100,000 specimens. In the centre of the country peak activity was observed between September and October, while in the southern regions the period of highest activity of C. imicola extended between September and November except in 2010 when, as a result of the lower number of catches performed, it reached the highest levels in April. In the southern region, the highest abundances of C. imicola occurred in GUs 34, 38 and 40. Although in small numbers, seasonal activity of Obsoletus group was detected as early as January. In the northern regions this species reached the highest abundances between May and August (commonly in GUs 1, 3 or 4), while in the central regions this occurred between May and June (in GUs 18, 20 or 21). In the southern regions, Obsoletus group typically reached peak abundance between April to May (in GUs 40, 42 or 44). The largest catches of this group
PLOS ONE | DOI:10.1371/journal.pone.0124019 April 23, 2015
11 / 19
Spatial and Temporal Distribution of Culicoides Species in Portugal
Table 1. Results of a generalized linear mixed model for the presence of Culicoides imicola Kieffer in light trap catches. Parameter
Value
Standard error
p-value
Intercept
-7.97995
0.83901