This is an open access article under the CC BY Patrícia Ferreira Ponciano Ferraz1licence et al. Creative Commons
346
Spatial and temporal distribution of enthalpy in aviary heated by industrial furnace Patrícia Ferreira Ponciano Ferraz1*, Gabriel Araújo e Silva Ferraz1, Tadayuki Yanagi Junior1, Luis Fillipe Leal de Melo2, Jaqueline de Oliveira Castro1, Daiane Cecchin3 10.1590/0034-737X201865040007
ABSTRACT The enthalpy is a thermodynamic property that can be used to evaluate thermal environment for chickens, considering the meteorological variables that most influence the animal’s thermal comfort, the dry-bulb temperature and the relative humidity. The aim was to analyze and compare the spatial variability of enthalpy in a broiler aviary during three periods of the day (morning, afternoon and night) for 14 living days, using geostatistical techniques. The experiment was performed in a commercial broiler aviary located in the western mesoregion of Minas Gerais, Brazil, where 28,000 male Cobb chicks were housed. The heating system consisted of an industrial indirect-fired biomass furnace. The heated air was inflated by an AC motor, 2206 W of power, 1725 RPM. Geostatistical techniques were used through semivariogram analysis and isochore maps were generated through data interpolation by kriging. The semivariogram was fitted by the restricted maximum likelihood method. The used mathematical model was the spherical one. After fitting the semivariograms, the data were interpolated by ordinary kriging. The semivariograms along with the isochore maps allowed identifying the non-uniformity of spatial distribution of the enthalpy throughout the broiler aviary for three periods during 14 days. It was observed that in the first two days of life, during the three evaluated periods the poultry kept most of the time and in most of the poultry shed under conditions of enthalpy below the recommended level in the literature. In the12th and 13th days during the three analyzed periods were the most critical because they showed values below the comfort throughout the day, over the entire broiler aviary. Possible failures in the heating system were also observed, especially at night, which can be a discomfort source for poultry and hence generate productive and economic losses. Keywords: ambience; chicks; geostatistics; poultry.
RESUMO Distribuição espacial e temporal da entalpia em um aviário aquecido por fornalha industrial A entalpia é uma propriedade termodinâmica que pode ser usada na avaliação do ambiente térmico para frangos, pois considera as variáveis meteorológicas que mais influenciam no conforto térmico animal, a temperatura do bulbo seco e a umidade relativa do ar. Objetivou-se analisar e comparar a variabilidade espacial da entalpia em um aviário de frangos durante três períodos do dia (manhã, tarde e noite) por 14 dias de vida das aves, empregando técnicas geoestatísticas. O experimento foi realizado em um aviário comercial onde estavam alojados 28.000 pintinhos machos da linhagem Cobb localizado na mesorregião oeste de Minas Gerais. O sistema de aquecimento consistia em um forno industrial de metal com queima indireta de biomassa. O ar aquecido foi insuflado por motor CA, 2206 W de potência, 1725 RPM. Utilizou-se técnicas de geoestatística por meio de análises de semivariograma e confecção de mapas de isocores por meio de
Submitted on March 20th, 2018 and accepted on August 21st, 2018. 1 Universidade Federal de Lavras, Departamento de Engenharia, Lavras, Minas Gerais, Brazil.
[email protected],
[email protected],
[email protected],
[email protected] 2 Universidade Federal de Lavras, Departamento de Zootecnia, Lavras, Minas Gerais, Brazil.
[email protected] 3 Universidade Federal Fluminense, Departamento de Engenharia Agrícola e Meio Ambiente, Niterói, Rio de Janeiro, Brazil.
[email protected] *Autora para correspondência:
[email protected]
Rev. Ceres, Viçosa, v. 65, n.4, p. 346-355, jul/ago, 2018
Spatial and temporal distribution of enthalpy in aviary heated by industrial furnace
347
interpolação dos dados por krigagem. O semivariograma foi ajustado pelo método da Máxima Verossimilhança Restrita. O modelo matemático utilizado foi o esférico. Após o ajuste dos semivariogramas foi realizada a interpolação dos dados por krigagem ordinária. Os semivariogramas juntamente com os mapas de isocores permitiram identificar a não-uniformidade da distribuição espacial da entalpia ao longo do aviário durante três períodos dos 14 dias análisados. Observouse que nos primeiros dois dias de vida durante os três períodos avaliados as aves ficaram a maior parte do tempo ao longo da maior parte do galpão sob condições de entalpia abixo do recomendado pela literatura. No 12º e 13º dias de vida durante os três períodos analisados, as aves ficaram submetidas as condições mais críticas de desconforto ao longo do dia, na maior parte do aviário. Observou-se também possíveis falhas no sistema de aquecimento, principalmente no período da noite, o que pode ser uma fonte de desconforto para as aves e consequentemente gerar perdas produtivas e econômicas. Palavras-chave: ambiência; avicultura; geoestatística; pintinhos.
INTRODUCTION The current perspective of poultry farming is characterized by animals that show high weight gain in a short growth period due to advances in genetic engineering, sanitation, nutrition and environmental thermal comfort (Carvalho et al., 2014). However, these poultry show low tolerance to thermal stress, which can result in productive and reproductive performance losses of these animals (Silva et al., 2015). The proper acclimatization of the environment inside the poultry aviary becomes essential in order to provide thermal comfort conditions to poultry, avoiding losses in productive efficiency (Nascimento et al., 2014). The thermal environment in which the chicks are subjected during their initial life will be crucial to guarantee comfort and animal welfare in order to achieve maximum yield, since physiological mechanisms of thermal control are developed during their initial development (Vieira et al., 2016). According to Yanagi Junior et al. (2011), it is important to keep a homogeneous environment inside the poultry aviary, besides being comfortable for poultry. Thus, the use of geostatistics becomes an effective methodology for the accurate analysis of the distribution of environmental variables, since it characterizes the magnitude of the spatial variability of data and allows generating maps that interrelate the analyzed variables in the space (Ferraz et al., 2017a). The enthalpy can be calculated in order to evaluate the thermal condition of the environment in which the animals are housed (H, ). According to Ferraz et al. (2016), the H is interesting in the evaluation of thermal comfort, since it expresses the amount of energy contained in a mixture of dry air and water vapor, influencing the thermal changes between the animal and the environment (Nazareno et al., 2012). According to Rodrigues et al. (2010), in case of changing relative humidity at the same dry-bulb
temperature, there is a change in the energy involved in the process and hence the thermal changes are altered. Thus, the aim was to analyze the spatial variability of H in a poultry aviary during three periods of the day, throughout the initial 14 days of housing, using geostatistical techniques.
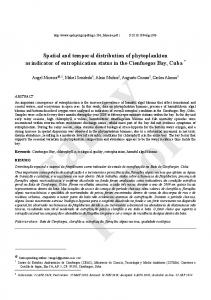
MATERIAL AND METHODS The experiment was performed in a commercial broiler aviary located in the western mesoregion of Minas Gerais, Brazil, at the geographic coordinates 20° 11’ 58" S and 45° 02' 08'’ W during the spring season. The poultry shed has northeast - southwest orientation and dimensions of 13.0 m width, 160.0 m length and 3 m height. The tiles are made of fiber cement of 6 mm thickness, concrete floor, rice husk bed, double side curtains (one internal and one external) of yellow plastic canvas (Figure 1). The broiler aviary heating system consisted of an industrial indirect-fired biomass furnace with 2.20 m length, 1.20 width, and 1.85 m height. The heated air was inflated by an AC motor, 2206 W of power, 1725 RPM and distributed by 28.50 m of metal pipe on the northeast side and 22.45 m on the southwest side installed inside the broiler aviary. The tube was 23 cm diameter and holes with 5 cm diameter alternately placed 1.0 m on each side of the tube for the outflow of heated air. The available area for the animals was delimited by plywood boards, so that the chicks were as close as possible to the heating systems. As the animals grew, the available area increased so that the density of animals would always be in line with that recommended for the lineage pattern and the age of poultry. At the beginning of the experiment, on the first day of life, the poultry were distributed in the density of 54 poultry m-2. Subsequently, the available area of the broiler aviary increased in order to Rev. Ceres, Viçosa, v. 65, n.4, p. 346-355, jul/ago, 2018
348
Patrícia Ferreira Ponciano Ferraz1 et al.
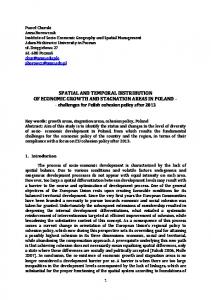
reduce the housing density, until the farming density of 13 poultry m-2 at the end of the heating phase. Inside the broiler aviary were housed 28,000 male Cobb lineage chicks. The chicks accessed water ad libitum and the supplied diets were formulated to meet nutrient requirements throughout the experimental period. The characterization of the thermal environment within the broiler aviary was done by measuring the dry-bulb temperature (tdb, °C), relative humidity (RH%), and dewpoint temperature (tdp, °C). Data collection was performed every 5 min during the 14 evaluated days. Subsequently, the thermal environment data were divided into three periods: morning (from 8 a.m. to 10 p.m.), afternoon (from 2 p.m. to 4 p.m.), and night (8 p.m. to 10 p.m.). The data were collected at 10 cm height from the ground in order to characterize the thermal conditions at the animal’s height. The position of the dataloggers changed as the placement of the plywood changed so that when the dataloggers registered the condition in which the birds were submitted, as illustrated in Figure 2, considering W is the width of the available area for birds and L is the length. W was 8 m and L was 62 m to the 1st until the 5th day of birds life. To the day 6 and 7, W was 11.06 m and L was 62 m. From the day 8 to the day 13, W was 11.06 m and L was 74.4 m. The day 14th presented W equal to 13 m and L equal to 74.4 m. The positioning of containment plates was established on the first day of the chicks’ life, and was changed in the sixth, the eighth and the fourteenth day. Sensors/recorders (Hobos Pro Series, Onset®) were used with a precision of ± 3% of reading, kept in wire mesh cages so that the animals could not damage them. Subsequently, the data were used to calculate H according to the equation by Albright (1990).
H = 1,006 * tdb + W * (2501 + 1,805 * tdb)
(1)
where, H is the enthalpy, in kJ kg-1dry air, W is the mixture ratio, in kJ , tdb is the dry-bulb temperature, in °C According to Rodrigues et al. (2010), H can be used to characterize the internal environment of poultry houses by portraying the energy present in the environment, correlating RH and tdb. The H is a physical variable that expresses the energy contained in a water vapor mixture (kJ ). The broiler aviary was divided into geographical coordinates (in meters) in order to allow a best spatialization of sensors and mapping of H. The initial coordinate was (0; 0) located at West end and the end point was given by the coordinate (13; 160) positioned at the East end. The spatial dependence of H was analyzed through semivariogram fitting and interpolation by ordinary kriging. The classic semivariogram was estimated by the Equation: (2) where, N (h) is the number of experimental pairs of observations Z(xi) and Z (xi + h) separated by a distance h. The semivariograms were fitted by the restricted maximum likelihood (REML) model, using the mathematical model of spherical fit. After fitting the semivariograms, the data were interpolated by ordinary kriging to best visualize
Figure 1: Three-dimensional scheme of the broiler aviary and heating system evaluated in this study with the main dimensions in meters.
Rev. Ceres, Viçosa, v. 65, n.4, p. 346-355, jul/ago, 2018
Spatial and temporal distribution of enthalpy in aviary heated by industrial furnace the spatial distribution of H inside the broiler aviary. The R statistical software (R Development Core Team, 2017) was used, through the geoR package. (Ribeiro Junior & Diggle, 2001).
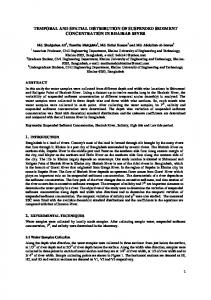
RESULTS AND DISCUSSION Figure 3 shows the values of the variables inside the broiler aviary during the experimental period and indicates the threshold of the variables t db ( oC) and RH (%) recommended by Medeiros et al. (2005) and H (kJ ) recommended by Ponciano et al. (2012) through dashed lines. According to Medeiros et al. (2005), for the first week of life, tdb should vary between 32 and 34 °C. In Figure 3 (a), it can be observed that the averages of tdb were lower than those recommended during all evaluated days in the first week of life. The low values of tdb inside the broiler aviary in the early days can be attributed to the inefficiency of the heating system in maintaining or generating enough heat to keep the environment warm for chicks. In the early stages of life, cold stress inside the aviary environment can alter metabolic functions and hence affect the immune system of these animals, increasing the mortality rate of flock (Staub et al., 2016). On the other hand, in the second week of life (Figure 3a), it is noted that even tdb did not remain homogeneous. According to Medeiros et al. (2005), tdb should range from 28 to 32 °C for the second week of life. Among all the evaluated period, the average of tdb was close to the comfort range recommended by the literature only on the ninth day (Figure 3a). As can be observed through Figure 3b, RH remained within the ideal comfort range, varying from 50 to 70% during the first two weeks of life (Medeiros et al., 2005), except for the eighth and tenth days, in which RH was above that considered as ideal (74.8 and 71.0, respectively). The variation of H during the 14 days of the experiment is illustrated in Figure 3c. During the experimental period,
349
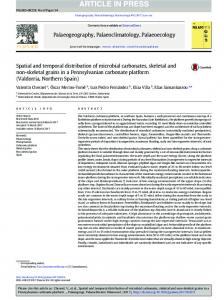
H remained close to the comfort recommended by the literature, ranging from 73 to 102 (kJ ) for the first week of life and 60 to 101 (kJ ), according to Ponciano et al. (2012). Although Figure 3 indicates variability in environmental data throughout the analyzed days, this exploratory analysis does not allow affirming in relation to the homogeneity of the spatial distribution of environmental variables within the broiler aviary analyzed during the first two weeks of life. In this way, a geostatistical analysis of H can aid in the evaluation of this variability (Table 1). Table 1 lists the estimated experimental semivariograms for H inside the poultry aviary from the 1st to the 14th day of life of the poultry during the three periods of the day. The data variability was due to the lack of homogeneity of the environmental conditions inside the broiler aviary during the experimental period. The nugget effect (C0) is a parameter that indicates unexplainable variability that can be expressed as sill ratio, which allows best comparing the spatial dependence degree (SDD) of the studied variables (Trangmar et al., 1985). According to Cambardella et al. (1994), semivariograms can be classified as follows: nugget effect < 25% of sill - strong spatial dependence; nugget effect between 25 and 75% - moderate spatial dependence; and nugget effect > 75% - weak spatial dependence. Semivariograms fitted to 1st day for morning period, 7th day for morning period, 9th day for morning and afternoon, 11th day for afternoon and night, 12th day for morning and afternoon, 13th day for afternoon and night, and 14th day for afternoon period show moderate SDD, while all others show strong SDD. The range (a) is shown as a relevant parameter of a semivariogram, since it is related to the determination of the spatial dependence threshold, indicating the threshold at which the variable is spatially correlated among the evaluated points. In the present study, the variable H had its range varying from 2.208 m to 9.818 m throughout the days and periods under study. In Figure 4 is illustrated the spatial distribution of H (kJ ), from the first to the seventh day of life of the chicks
Figure 2: Positioning of sensors / dataloggers in the broiler aviary. Caption: W - width (m), L - length (m), S - sensor/recorder and HS - heating system (furnace).
Rev. Ceres, Viçosa, v. 65, n.4, p. 346-355, jul/ago, 2018
350
Patrícia Ferreira Ponciano Ferraz1 et al.
during the three analyzed periods. A great variability of H inside the broiler aviary was observed, whereas regions with low H values are characterized by bluish and greenish colors and regions with high values are shown by colors that are more reddish. Based on isocolor maps (Figure 4), it can be stated that the thermal conditions ranged uniformly inside the broiler aviary during the day and along the first week of life of the poultry. It is observed that during the first week of life, the H ranged from 56 to 90 kJ . Ponciano et al. (2012) state that, for this chicks’ lifespan, ideal H values should range from 73 to 102 kJ , i.e., there were days and regions in the poultry shed that the poultry were subjected to conditions different from their comfort range. In the first two days of life during the three evaluated periods (Figure 4a, 4h, 4o, 4b, 4i, 4p) the poultry kept most
of the time and in most of the poultry shed under conditions of H below the recommended level in the literature, which is indicated by the greenish and bluish colors in Figure 4. In the first days of life, the thermoregulatory system of chicks is not yet fully developed and these animals do not yet have sufficient energy reserve to adapt to thermal stress conditions, which can be detrimental to the development of these animals (Menegali et al., 2013). Based on the spatial distribution of H in the night period of 1st, 2nd and 3rd days of life (Figures 4o, 4p and 4q, respectively), it is observed that the animals faced the worst thermal conditions of the week during these nights, with the lowest values of H over most of the broiler aviary. This occurrence is possibly due to a failure in the biomass feed of the heating system that did not have an automated feed system. In this way, the biomass was deposited inside the
Figure 3: Boxplot for dry-bulb temperature (tdb, °C) (a), relative humidity (RH, %) (b) and enthalpy (H, kJ ) (c) measured during the experimental period of 14 days and with the comfort range delimited by the dashed line.
Rev. Ceres, Viçosa, v. 65, n.4, p. 346-355, jul/ago, 2018
351
Spatial and temporal distribution of enthalpy in aviary heated by industrial furnace furnace before the employee end his or her working hours, working without supervision and refueling during all night. Such failures concerning the heating system can harm beyond the animal’s comfort and welfare, affecting also their productive performance. According to Cordeiro et al. (2010), mistakes in the thermal conditioning of chicks at this early stage of life may not be satisfactorily corrected in the future and may influence performance over the rest of the lives of these animals. Furthermore, according to Sartori et al. (2003), this thermal challenge may still cause malformation of the skeletal muscle of poultry, besides
affecting their productive performance and even lead to mortality. It is observed, however, that on the majority of days (1st, 2nd, 3rd, and 7th days), respectively represented by Figures 4h, 4i, 4j, and 4k, the afternoon showed the best H values over the broiler aviary. These conditions can be explained because the employees were present and more attentive to the internal thermal conditions. Figure 5 shows the spatial variability of H in the second week of life of the poultry. Due to an energy supply failure on the eighth day, it was not possible to collect data in the
Table 1: Method, model and estimated parameters of the experimental semivariograms for enthalpy within the poultry shed according to the age of chicks Day 1 1 1 2 2 2 3 3 3 4 4 4 5 5 5 6 6 6 7 7 7 8 9 9 9 10 10 10 11 11 11 12 12 12 13 13 13 14 14 14
Period of the day
Method
Model
C0
C1
C0 + C1
a
SDD
Morning Afternoon Night Morning Afternoon Night Morning Afternoon Night Morning Afternoon Night Morning Afternoon Night Morning Afternoon Night Morning Afternoon Night Morning Morning Afternoon Night Morning Afternoon Night Morning Afternoon Night Morning Afternoon Night Morning Afternoon Night Morning Afternoon Night
REML REML REML REML REML REML REML REML REML REML REML REML REML REML REML REML REML REML REML REML REML REML REML REML REML REML REML REML REML REML REML REML REML REML REML REML REML REML REML REML
Spherical Spherical Spherical Spherical Spherical Spherical Spherical Spherical Spherical Spherical Spherical Spherical Spherical Spherical Spherical Spherical Spherical Spherical Spherical Spherical Spherical Spherical Spherical Spherical Spherical Spherical Spherical Spherical Spherical Spherical Spherical Spherical Spherical Spherical Spherical Spherical Spherical Spherical Spherical Spherical
30.77 3.37 2.24 0.88 0.00 0.70 0.00 0.07 4.61 0.00 9.58 0.52 1.40 3.52 6.23 0.00 0.00 0.00 14.51 0.00 1.26 0.00 8.74 6.70 0.00 0.00 0.01 0.00 0.00 5.50 6.29 12.14 11.79 0.09 0.00 5.18 6.22 0.00 3.58 2.07
16.53 53.13 42.02 11.63 30.11 15.52 19.44 22.69 20.79 20.97 31.13 14.43 11.60 11.03 44.69 14.37 15.10 13.29 10.98 29.79 17.81 33.04 14.25 13.37 16.21 23.08 26.67 32.88 42.54 9.67 11.86 24.65 20.08 17.19 39.58 7.18 7.84 32.23 10.68 10.94
47.30 56.50 44.27 12.51 30.11 16.22 19.44 22.76 25.39 20.97 40.72 14.95 13.01 14.55 50.92 14.37 15.10 13.29 25.49 29.79 19.06 33.04 22.99 20.06 16.21 23.08 26.68 32.89 42.54 15.17 18.15 36.79 31.87 17.28 39.58 12.36 14.06 32.23 14.26 13.01
2.40 2.35 4.35 2.40 4.01 2.40 2.37 3.18 4.29 8.06 2.21 2.40 2.37 4.37 2.27 6.72 7.59 5.11 7.59 6.59 6.77 5.46 9.82 3.49 5.43 6.59 5.71 5.44 3.49 3.41 3.48 3.49 3.42 5.97 5.04 3.28 3.20 3.48 3.80 3.90
65.05 5.96 5.07 7.04 0.00 4.31 0.00 0.30 18.14 0.00 23.54 3.47 10.79 24.17 12.23 0.00 0.00 0.00 56.93 0.00 6.59 0.00 38.03 33.38 0.00 0.00 0.04 0.01 0.00 36.23 34.68 33.00 36.98 0.52 0.00 41.94 44.25 0.00 25.12 15.91
Rev. Ceres, Viçosa, v. 65, n.4, p. 346-355, jul/ago, 2018
352
Patrícia Ferreira Ponciano Ferraz1 et al.
afternoon and night periods on this day, which justifies the fact that the map of H distribution is presented only for the morning period. In this Figure, the regions with higher values of H are characterized by reddish colors and the low values of H are illustrated by bluish and greenish colors. During the second week of life, H values ranged from 48 to 91.8 kJ . In this way, the thermal conditions inside the
broiler aviary were mostly within the comfort range recommended by Ponciano et al. (2012), which should vary between 60 and 101 kJ . It is noteworthy that the 12th and 13th days during the three analyzed periods (Figure 5e, 5k and 5q) were the most critical because they showed values below the comfort throughout the day, over the entire broiler aviary. These conditions indicate that the broilers were subjected to
Figure 4: Spatial distribution of enthalpy on the 1st (a, h, o), 2nd (b, i, p), 3rd (c, j, q), 4th (d, k, r), 5th (e, l, s), 6th (f, m, t) and 7th days (g, n, u) (), in the morning, afternoon and night periods, respectively.
Rev. Ceres, Viçosa, v. 65, n.4, p. 346-355, jul/ago, 2018
Spatial and temporal distribution of enthalpy in aviary heated by industrial furnace thermal discomfort conditions, which may harm the formation of the thermoregulatory system and yield, especially in the first weeks of life of the poultry (Cordeiro et al., 2011). According to Ferraz et al. (2017b), chicks exposed to thermal challenges by cold in the first weeks of life may undergo a cumulative loss in relation to their live weight, feed intake, water intake, and weight gain, possibly affecting their productive life up to the end of their production phase.
353
Thus, similarly to the first week of life (Figure 4), during the second week of life (Figure 5), H values were lower at night in relation to other periods of the day. According to the isochore maps presented in Figures 4 and 5, relative to the animal’s first and second weeks of life, respectively, high variabilities of thermal conditions inside the broiler aviary were observed during the three analyzed periods. It can be observed that, the broilers were subjected to thermal conditions close to
Figure 5: Spatial distribution of enthalpy on the 8th (a), 9th (b, h, n), 10th (c, i, o), 11th (d, j, p), 12th (e, k, q), 13th (f, l, r) and 14th days (g, m, s) (kJ ), in the morning, afternoon and night periods, respectively.
Rev. Ceres, Viçosa, v. 65, n.4, p. 346-355, jul/ago, 2018
354
Patrícia Ferreira Ponciano Ferraz1 et al.
the comfort range in most of the days and in most of the broiler aviary. However, it is also observed that the distribution of H over the facility was not uniform, i.e. the poultry were subjected to different environmental conditions inside the same poultry shed. According to Yanagi Junior et al. (2011), a homogeneity of variables inside the facility is expected inside a production environment; otherwise, there may be an imbalance between the thermal conditions that the poultry are subjected to and the flock uniformity. In this way, it is highlighted that adequate thermal conditioning is essential at the beginning of life to meet the thermal comfort requirements for poultry, since the animal’s development depends on it. It is known that intensive farming directly influences on the animal’s comfort and welfare and on the expression of natural behaviors, affecting the productive performance of the poultry (Vigoderis et al., 2010). Therefore, it is important to adapt the thermal environment inside the broiler aviary to the ideal conditions for chicks in order to reach the best conditions, providing welfare and better productive performance and hence greater possibility of achieving better economic returns for the activity.
CONCLUSION Semivariograms allowed characterizing the magnitude of spatial variability of the enthalpy inside the broiler aviary during the first two weeks of life. Isochore maps allowed observing the spatial variability of the enthalpy throughout the 14 days and three periods. The non-uniformity of the spatial distribution of the enthalpy was identified inside the broiler aviary. The maps also allowed observing the existence of possible failures in the heating system in some days, especially in the night, which can cause discomfort for the poultry and hence productive and economic losses.
ACKNOWLEDGMENT The authors express their thanks to CAPES, CNPq and FAPEMIG for financial support to this research.
REFERENCES
Cordeiro MB, Tinôco IFF, Silva JN, Vigoderis RB, Pinto FDADC & Cecon PR (2010) Conforto térmico e desempenho de pintos de corte submetidos a diferentes sistemas de aquecimento no período de inverno. Revista Brasileira de Zootecnia, 39:217224. Cordeiro MB, Tinôco IFF, Mesquita Filho RM de & Sousa FC (2011) Análise de imagens digitais para a avaliação do comportamento de pintainhos de corte. Engenharia Agrícola, 31:418426. Ferraz GAES, Silva FM da, Oliveira MS de, Paiva AA & Ferraz PFP (2017a) Variabilidade espacial dos atributos da planta de uma lavoura cafeeira. Revista Ciência Agronômica, 48:81-91. Ferraz PFP, Junior TY, De Lima RR, Araujo G, Ferraz S & Xin H (2017b) Desempenho de pintinhos submetidos a estresse térmico. Pesquisa Agropecuária Brasileira, 52:113-120. Ferraz PFP, Junior TY, Ferraz GAS, Schiassi L & Campos AT (2016) Variabilidade espacial da entalpia em galpões avícolas na fase de aquecimento. Revista Brasileira de Engenharia Agrícola e Ambiental, 20:570-575. Medeiros MM, Baêta FC, Oliveira RFM, Tinôco IFF, Albino LFT & Cecon PR (2005) Efeitos da temperatura, umidade relativa e velocidade do ar em frangos de corte. Engenharia na Agricultura, 13:277-86. Menegali I, Tinoco IFF, Carvalho CCS, Souza CF & Martins JH (2013) Comportamento de variáveis climáticas em sistemas de ventilação mínima para produção de pintos de corte. Revista Brasileira de Engenharia Agrícola e Ambiental, 17:106-113. Nascimento GR, Naas IA, Baracho MS, Pereira DF & Neves DP (2014) Termografia infravermelho na estimativa de conforto térmico de frangos de corte. Revista Brasileira de Engenharia Agrícola e Ambiental, 18:658-663. Nazareno AC, Silva IJO, Nunes MLA, Castro AC De, Miranda KOS & Trabachini A (2012) Caracterização bioclimática de sistemas ao ar livre e confinado para a criação de matrizes suínas gestantes. Revista Brasileira de Engenharia Agrícola e Ambiental, 16:314-319. Ponciano PF, Junior TY, Lima RR De, Schiassi L & Teixeira VH (2012) Adjust of regression models to estimate the rectal temperature of broilers for the first 14 days of life. Engenharia Agrícola, 32:10-20. R Development Core Team (2017) R: A language and environment for statistical computing. Available at: . Acessed on: August 22nd, 2017. Ribeiro Junior PJ & Diggle PJ (2001) geoR: A package for geostatistical analysis. Available at: . Acessed on: August 22nd, 2017 Rodrigues VC, Silva IJO, Vieira FMC & Nascimento ST (2010) A correct enthalpy relationship as thermal comfort index for livestock. International Journal Biometeorology, 55:455-459.
Albright D (1990) Environment control for animals and plants. St. Joseph, American Society of Agricultural Engineers Michigan. 453p.
Sartori JR, Gonzales E, Macari M, Pai VD & de Oliveira HN (2003) Tipos de fibras no musculo flexor longo do hálux de frangos de corte submetidos ao estresse pelo calor e frio e alimentados em “pair-feeding”. Revista Brasileira de Zootecnia, 32:918-925.
Cambardella CA, Moorman TB, Parkin TB, Karlen DL, Novak JM, Turco RF & Konopka AE (1994) Field scale variability of soil properties in Central Iowa soils. Soil Science Society of America Journal, 58:1501-1511.
Silva GC, Nascimento MRB de M, Penha-Silva N, Fernandes E de A, Vilela DR & Souto MM (2015) Suplementação com zinco e selênio em frangos de corte submetidos a estresse cíclico de calor. Revista Ceres, 62:372-378.
Carvalho da CSC, dos Santos TC, Da Silva GC, Santos LV, Moreira JM de S & Botelho LF (2014) Conforto térmico animal e humano em galpões de frangos de corte no semiárido mineiro. Revista Brasileira de Engenharia Agrícola e Ambiental, 18:769773.
Staub L, Moares MDG De, Santos MG, Komiyama CM, Gonçalves NS, Fernandes Junior RB, Ton SPA & Roque FA (2016) Ambiência interna e externa em galpão de frangos de corte nas diferentes épocas do ano e fases de criação. Nativa, 4:128-133.
Rev. Ceres, Viçosa, v. 65, n.4, p. 346-355, jul/ago, 2018
Spatial and temporal distribution of enthalpy in aviary heated by industrial furnace Trangmar BB, Yost RS & Uehara G (1985) Applications of geostatistics to spatial studies of soil properties. Advances in Agronomy, 38:45-94. Vieira FMC, Silva IJO, Nazareno AC, Faria PN & Miranda KOS (2016) Termorregulação de pintos de um dia submetidos a ambiente térmico simulado de transporte. Arquivo Brasileiro de Medicina Veterinária e Zootecnia, 68:208-214.
355
Vigoderis RB, Cordeiro MB, Tinôco IFF, Menegali I, Souza Júnior JP & Holanda MCR (2010) Avaliação do uso de ventilação mínima em galpões avícolas e de sua influência no desempenho de aves de corte no período de inverno. Revista Brasileira de Zootecnia, 39:1381-1386. Yanagi Junior T, Amaral AG, Teixeira VH & Lima RR (2011) Caracterização espacial do ambiente termoacústico e de iluminância em galpão comercial para criação de frangos de corte. Engenharia Agrícola, 31:01-12.
Rev. Ceres, Viçosa, v. 65, n.4, p. 346-355, jul/ago, 2018