regions (Prealps) with an average altitude of 580 m.a.s.l. and peaks reaching ...... Switzerland, the Jura as well as over southern Germany and the Bavarian Alps.
Accepted Article
Spatial and temporal distribution of hailstorm in the Alpine region: a long-term, high resolution, radar-based analysis L. Nisi1,2,3,4, O. Martius1,2,3, A. Hering4, M. Kunz5, U. Germann4 1
University of Bern, Oeschger Centre for Climate Change Research, Bern, Switzerland
2
University of Bern, Institute of Geography, Bern, Switzerland
3
University of Bern, Mobiliar Lab for Natural Risks, Bern, Switzerland
4
Federal Office of Climatology and Meteorology MeteoSwiss, Locarno-Monti, Switzerland
5
Institute of Meteorology and Climate Research (IMK), Karlsruhe Institute of Technology (KIT), Karlsruhe, Germany
Abstract This paper presents a thirteen-year hail climatology for Switzerland based on volumetric radar reflectivity. Two radar-based hail detection products that are used operationally at MeteoSwiss, namely the Probability of Hail (POH) and the Maximum Expected Severe Hail Size (MESHS), have been reprocessed for the extended convective season (April-September) between 2002 and 2014. The result of these two products is a comprehensive hail distribution map, which highlights regional and local-scale hail characteristics. The map of the annual number of hail days shows a high spatial variability and several maxima over the foothills north and south of the Alps as wells as over the Jura mountains. Directly over the Alps hail frequency exhibits a minimum. Annual hail anomalies show a pronounced variability, which suggests that hail occurrence is strongly controlled by large-scale weather patterns. Furthermore, hail probability exhibits a strong seasonal and diurnal cycle with a maximum in July in the late afternoon. The hail peak over the northern prealpine region
occurs
approximately two hours earlier compared to the south. A possible explanation is the trigger mechanism between the cold pool initiated by early convective cells over the Jura mountains and the development of cells on the northern slope of the Alps. Since radar-based hail signals are only indirect measurements, statistical verification of the hail detection algorithms is crucial. Damage reports from an automobile insurance company are used as independent dataset. Verification results confirm that radar-based hail algorithms provide valuable information on hail probability. Finally the synoptic-scale hail-driving weather conditions are investigated using a weather type classification based on upper-air flow
This article has been accepted for publication and undergone full peer review but has not been through the copyediting, typesetting, pagination and proofreading process, which may lead to differences between this version and the Version of Record. Please cite this article as doi: 10.1002/ qj.2771 This article is protected by copyright. All rights reserved.
Accepted Article
direction and mean pressure from a NWP model. The results show that six out of nine main synoptic-scale patterns favour the development of hailstorms in Switzerland. Keywords: Hail, Hailstorms, Convection, Weather radar, Switzerland, Diurnal cycle
1 Introduction Hail has been a subject of scientific interest for many decades (e.g. Plumandon, 1901; Changnon, 1978) because of the severe damage it causes to agriculture, buildings and cars. For a specific location, hail is a low probability high impact weather event (e.g. Delobbe and Holleman, 2006). Hail is characterized by a strong local-scale variability of the occurrence and intensity and the small extent of the affected areas referred to as hailstreaks (e.g. Weisman et al., 1997; Bryan et al., 2003; Sánchez et al. 2013). As a consequence, point observations of hail are not representative for larger areas. Compared to other atmospheric parameters such as temperature or precipitation, observational networks need to be at least 10 times denser to capture all hailstreaks (Wieringa and Holleman, 2006). Physical measurements collected with dense networks are an ideal basis to investigate multi-year hail occurrence, hail variability and hail trends. Additional information are provided by reports from trained storm spotters or newspapers, which are archived in different databases, for example the European Severe Weather Database (ESWD). Several hail climatologies and analyses have been compiled worldwide during the last decades based on data from human or automatic observations (e.g. Changnon, 1978; Changnon and Changnon, 2000, Xie et al., 2008; Zhang et al., 2008; Tuovinen et al., 2009; Xie et al., 2010; Mezher et al., 2012) and hailpads (e.g. Dessens and Fraile, 1994; Sánchez et al., 1996; Eccel and Ferrari, 1997; Vinet, 2001, Dessens et al., 2001; Fraile et al., 2003; Giaiotti et al., 2003; Počakal et al., 2009; Berthet et al., 2011; Manzato, 2013; Sánchez et al. 2013). Unfortunately, only few dense hail observation networks exist worldwide (e.g., in several parts of France or northern Italy), and Switzerland does not have a ground-based hail observation network. For this reason, studies on hail occurrence require indirect observations, primarily radar data or insurance loss data. Weather radar-based hail detection algorithms can be useful for investigating hail frequency over larger areas (e.g. Basara et al., 2007; Cintineo et al, 2012) and in regions where long observation time series, like in Switzerland, do not exist. Hail detection by weather radar has a long history. In the fifties, first studies were conducted to investigate the presence of hail in
This article is protected by copyright. All rights reserved.
Accepted Article
thunderstorms by means of weather radars (e.g. Donaldson, 1961). A series of studies analysed the relation between the presence of hail and different radar parameters such as: vertical reflectivity profiles (Wilk, 1961), height of strong echos (e.g. Douglas 1963), maximum reflectivity (e.g. Rinehart et al., 1968), height of the 45-dBZ contours in storm profiles (Mather et al., 1976), height difference between the 45 dBZ reflectivity and the melting layer (Waldvogel et al., 1979), or vertical integrated liquid water (e.g. Amburn and Wolf, 1997). Several radar-based methods for estimating the probability of hail (e.g. Waldvogel et al., 1979), the hail kinetic energy (e.g. Sánchez et al., 2013) and the maximum expected hailstone size (e.g. Treloar, 1996; Edwards and Thompson, 1998; Witt et al., 1998) were developed and implemented operationally by weather offices. Summaries of the most commonly used hail detection techniques using single-polarization C-Band radars are presented in Holleman (2001), Sánchez et al. (2013) and Kunz and Kugel (2015). Insurance loss data usually have a high spatial coverage and are available over a long period, but are affected by several sources of uncertainty (e.g. Willemse, 1995; McMaster, 1999; Changnon et al., 2001; Webb et al., 2001a; Schuster et al., 2005; Kunz and Puskeiler, 2010). They are strongly dependent on non-meteorological characteristics like population density, object vulnerability and claim handling (Dessens et al., 2009; Mohr and Kunz, 2013). According to Vinet (2001), damage observations are the results of the combination of “object vulnerability” (property) and “agent risk” (hail). Nevertheless, these data sets provide one of the few possibilities for cross-validating radar-based hail observations in areas where ground-based hail observation networks are not available. For example, Kunz and Kugel (2015) and Skripniková and Řezáčová (2014) used building loss information for validating and adjusting radar-based hail detection algorithms. Switzerland is regularly affected by severe hailstorms causing substantial damage. Despite the high hail risk exposure, only a few climatological hail investigations based on insurance and radar data exist (e.g. Houze et al., 1993; Willemse, 1995; Stucki and Egli, 2007). Substantial improvements of the Swiss radar network offer the unique opportunity to extend and broaden the existing knowledge. Long-term information on hail occurrence is not only relevant for agriculture and the insurance industry, but also serves as basis for the advancement of hail forecasting in Switzerland. Building on climatological knowledge of the temporal and spatial distribution of hailstorms allows assessing the hail hazard and hail risk for different regions (Wieringa and Holleman, 2006).
This article is protected by copyright. All rights reserved.
Accepted Article
Forecasting severe storms is a challenging task due the chaotic nature of convective processes. In particular over complex orography, high spatial and temporal gradients make the task of observing and nowcasting thunderstorms challenging (e.g. Mecklenburg et al., 2000; Hering et al., 2004; Rotach et al., 2009; Mandapaka et al., 2012; Nisi et al., 2014). However, in mountainous areas the orographic forcing is a source of repeatability of precipitation and convective cells (Foresti et al., 2011), and knowledge about hail occurrence in the past is very valuable for many applications. The aim of this study is to investigate the distribution of hail over Switzerland and adjacent regions, which are characterized by complex terrain and the absence of hail detection networks (e.g. hailpads). Hail occurrence is assessed by using radar-based observations (full resolution) over a 13-year investigation period. Volumetric radar data from the Swiss radar network are combined with information from the regional Numerical Weather Prediction (NWP) model COnsortium for Small-scale MOdelling (COSMO-CH). Two operational single-polarization hail detection algorithms are reprocessed for the extended convective season (April-September) between 2002 and 2014. The results are analysed to address the following questions: (i) What is the annual, monthly and hourly distribution of hail occurrence over the prealpine and alpine region? (ii) Is it possible to identify and characterize the synoptic-scale hail favouring weather conditions? (iii) Does the application of radar-based hail detection algorithms over a region with complex terrain yield reliable results?
2
Domain and data-sets
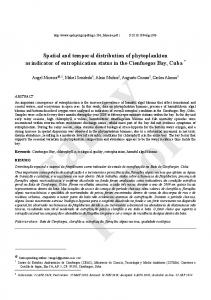
2.1. Investigation area The region under investigation has a complex orography, characterized by deep valleys with lowest altitude around 100 m.a.s.l. and mountains with peaks above 4000 m.a.s.l. , see Figure 1. We considered in the analysis both the whole domain and smaller subregions, see orange areas in Figure 1. The six sub-regions exhibit different terrain as well as climatological conditions. The Jura (1) is a long south-west to north-east oriented mountain ridge, the highest peak of which is the Crêt de la Neige at 1720 m.a.s.l.. The northern slopes of the Alps (2) encompass a mixture of flat and hilly terrain (Swiss Plateau) and mountainous regions (Prealps) with an average altitude of 580 m.a.s.l. and peaks reaching 1500 m.a.s.l. . The Alps (3) are characterized by deep valleys and high peaks with altitudes ranging between 400 and more than 4810 m.a.s.l. . The southern prealpine area (4) is dominated by hilly
This article is protected by copyright. All rights reserved.
Accepted Article
terrain. Finally the Po valley (Italy; ( 5) is characterizzed by flat terrain, t and the federall state of Württemberrg (Germanny; 6) enco ompasses a mixture off flat and hilly h terrainn (Black Baden-W Forest).
Figure 11: Investigattion area an nd the six su ub-regions analysed in this t paper (11: Jura; 2: N Northern Prealps;; 3: Alps; 4: Southern P Prealps; 5: Po valley; 6: 6 Baden-W Württembergg). Red dots indicate the location of the two t radars used u in this study. CH: Switzerland d; D: Germ many; Fr: Frrance; It: Italy; Au: Austria.
2.2. Ra adar data In this study two C-band Dooppler radaars from the MeteoSw wiss radar network n haave been used, thhat is Albiss and Montte Lema, seee Figure 1. For reasoons of data homogeneiity, data from thhe third rad dar on La Dôle D was noot includedd; rather thee maximum m range used in this study iss 160 km. Starting S from June 2011, the C-bband Doppller radar neetwork (Josss et al., 1998) hhas been co ompletely renewed and d extendedd adding duual-polarisattion capabiility and two addditional raddar sites to improve cooverage in the t inner-aalpine regio ons (Germannn et al, 2015). T This is the 4th generattion of weaather radars in Switzeerland. Dettails on 3rdd and 4th generation radar data d processsing are described inn Joss et all. (1998) and Germannn et al. bration is performed p with an innternal noise source generator every 5 (2015). The calib minutess, whereas an a externall calibration n using the sun is perfformed on a daily basis. To calcculate the Probability P Of Hail (PO OH) and thhe Maximum Expected Severe Hail H Size (MESH HS), the 455dBz and 50dBz 5 echo o top heighht products are used (ET45 annd ET50
This article is protected by copyright. All rights reserved.
Accepted Article
hereafter). ET45 and ET50 represent the highest altitude at which a radar reflectivity of at least 45 dBZ and 50 dBZ, respectively, can be detected (Donaldson, 1961). The parameters ET45, ET50, POH and MESHS are 2-dimensional, gridded Cartesian products. For more details see Table 1. Since many years echo top height products are used for the diagnosis of severe convection (e.g. Held, 1978; Waldvogel et al, 1979; Witt et al., 1998) and for radar-based thunderstorm nowcasting systems (e.g. Dixon and Wiener, 1993; Johnson et al., 1998; Hering et al., 2008). Quantitative radar estimation of precipitation over complex terrain has to cope with several major challenges (see Section 3.5).
Table 1: Specifics of the 3rd and 4th Swiss radar generation and related product resolutions.
Before June 2011
Inbetween
After June 2012
Radar generation
3rd
4th
Radar capabilities
Doppler
Doppler + polarimetric
Radar resolution (polar data)
1km x 1°
Spatial resolution of Cartesian products
Scan Strategy
Transition phase
500m x 1°
2 x 2 km²
1 x 1 km²
20 elevations (-0.3°-+40°) repeated every 5 min
20 elevations (-0.2°-+40°) repeated every 5 min
2.3. Freezing level height from the regional NWP model COSMO-CH The radar-based hail detection algorithms POH and MESHS require information on the freezing level height (hereafter H0). This information is extracted from COSMO-CH analysis (http://cosmo-model.org/). COSMO-CH is a non-hydrostatic, regional, high-resolution numerical weather prediction model operated by MeteoSwiss. The horizontal resolutions are 6.6 x 6.6 km² (COSMO-7) and 2.2 x 2.2 km² (COSMO-2), respectively, and the temporal resolution is 1 hour. H0 represents the model grid-cell, where the 3D temperature field is equal to 0 °C. During the investigation periods, the model set-up changed over time. Between March 2002 and March 2008 only one model resolution was available with a 7 x 7 km² mesh-grid, whereas after March 2008 both COMOS-7 and COSMO-2 were available. Another minor change concerns
This article is protected by copyright. All rights reserved.
Accepted Article
the algorithm for the diagnosis of the freezing level. The bottom-up algorithm was substituted with a top-down approach in May 2011. This modification had a significant effect during stable situations with a temperature inversion only, but no effect in case of convective events. The sensitivity of POH (or MESHS, respectively) to errors in the definition of H0 decreases with increasing difference between ET45 (or ET50, respectively) and H0. For example, an H0 error of ±1000m produces a variation in POH of ±20-40% if POH 80% (Figu ure 4, 7, 10 and 11), orr MESHS > 2 cm or MESHS M > 3 cm orr MESHS > 4 cm (Figuure 5). The 80% 8 POH thhreshold is selected baased on (i) statistical verificaation with in nsurance loss data (Secction 4.5) and a (ii) the evaluation of the appllicability of radarr-based hail algorithm ms over the Alps (Secttion 3.5). The T diurnal cycle is coomputed using thhe normalizzed average hourly hail frequencyy (Figure 9)). For each grid point, an “hail hour” iss consideredd when POH > 80%. Standardize S ed anomaliees N (Wilkss, 2006) aree used to discuss annual haill variability over Switzerland (Figuure 6): ,
(2)
where pi is the haiil frequencyy of the ith year, μ is tthe mean ovver several years, and σ is the standardd deviation (hereafter STD). S
3.5 Dis scussion of o radar-ba ased apprroaches over complex terrain n As oppposed to alll other haail observin ng systems,, a radar offers o a unnique capabbility to simultanneously observe hail cells down n to the size of few kkm2 and miinutes overr a large domain. However, some chaallenges which w can affect a the quality of the data must m be discusseed. Among them we find fi ground clutter andd bright bannd contamin nation, partiial beam
This article is protected by copyright. All rights reserved.
Accepted Article
blocking, beam shielding, overshooting and widening as well as different attenuation effects (e.g. Joss et al., 1998; Germann et al., 2006; Villarini and Krajewski, 2010, Mandapaka et al., 2013). Over complex terrain like the Alps some of these effects (e.g. beam shielding) may severely modify the observations, see for instance Germann et al. (2006). Bright-band contamination and beam overshooting only marginally affect POH and MESHS. The former, a local increase in reflectivity due to the melting of frozen hydrometeors, is an effect that is mainly relevant for stratiform precipitation, but not for convective cells. Even if occasionally the bright band may produce reflectivity values larger than 45 dBZ at the altitude of the freezing level, the difference in height between ET45 and H0 is too small to affect the identification of hail by radar, see Equation (1). Furthermore, beam overshooting, increasing with the distance off the radar, also affects both hail algorithms only marginally. The criteria for a positive detection by POH and MESHS require the ET45 and the ET50 to be located at mid and high levels of the troposphere. For example, assuming a freezing level at 3000 m, ET45 has to be 7200 m for a POH value of 80%. In such cases, beam overshooting does not play a role. Only during the early convective season (April-May), when usually airmass conditions limit the vertical development of convective cells to around 6000 – 8000 m and when the freezing level is still low, beam overshooting can be an issue. The spatial distribution of the hail signals, however, is mainly governed by the events during June and July (cf. Figure 7), where the effect of beam overshooting is negligible. The other three issues, namely ground clutter contamination, partial and total beam shielding and different types of attenuation, may affect the hail products. MeteoSwiss uses a sophisticated clutter suppression algorithm, based on Doppler and statistical filtering (Joss et al, 1998), which is continuously improved (Germann et al., 2006; Germann et al., 2015) and eliminates clutter efficiently. In the 4th generation radar data residual clutter is a marginal issue. In the 3rd generation radar data a few clutter pixels remain near to mountain peaks. However, the effect on the hail products is negligible because these radar echos are located at lower altitudes and do not result in high echotops used as criteria for hail. A particular type of clutter occurs in inversions with anomalous propagation. The impact on the hail studies is negligible because anomalous propagation is unlikely in convective situations and limited to low altitudes. Wet-radome attenuation affects the data used in this study only marginally. The concomitant occurrence of convective storms exactly over the radar site and the presence of hailstorms in the radar domain is rare. Based on our dataset less than 0.2% of all thunderstorms are
This article is protected by copyright. All rights reserved.
Accepted Article
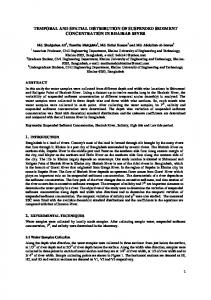
affectedd. Non-convvective rainn on the radar r site is more freequent, but here the rresulting attenuattion is limited to few deecibels (Germann et al., 1999). Path atttenuation caan have an effect on hail h data whhen a hailstoorms is located behindd intense precipittation. Statiistically speeaking this applies onnly to few hailstorms in our dattaset. At current status MetteoSwiss is testing an attenuationn correctionn algorithm using polaarimetric data of the t 4th geneeration. Beam w widening is another pottential errorr in radar appplications.. This effect increases with the distancee between thhe radar site and the loocation of thhe scattererr (e.g. Cintinneo et al., 2012). 2 In order too minimize this effect a two-radaar compositee has been used and thhe maximuum range has beenn reduced to o 160 km. Partial bbeam block king is another challennge especiaally in com mplex topog graphy. MetteoSwiss computees the visibility of eachh pixel of thhe domain from f a digittal terrain model. m Baseed on the visibilitty partial beam blockinng is corrected at the levvel of the poolar data. Beam sshielding by y obstacles and mounttain ranges has a direcct influencee on the alttitude of west radar beam. b These altitudess are particcularly hig gh over moountain rannges and the low over areeas behind higher mouuntains thatt are covereed only by a single radar. By meeans of a worst ccase example, Figure 3 shows the altitude of o the loweest visible beam b of thee Monte Lema raadar. Becauuse of the shielding s off a nearby mountain m p peak the alttitude of thee lowest radar beeam toward d northeast exceed 8 km k at a distaance of 150 0 km.
Figure 33: In the diirection of N NNE the beeam of Lem ma radar is severely sh hielded by a nearby mountaiin. At a disttance of 1500 km the rad dar can observe precipitation onlyy at a heightt of 8 km and high her. This is the directioon with moost severe sh hielding. The position of o the Albis radar is also shown.
This article is protected by copyright. All rights reserved.
Accepted Article
Taking profit from a two radar composite and limiting the radius to 160 km, the altitudes of the lowest radar beam over the Alps are generally below 5000 m. Over a limited area in the central Alps they range between 5000 and 6700 m. POH values of 40, 60 and 80% correspond to ∆z differences (see Equation 1) of 2400, 3070 and 4200 m, respectively (Foote et al., 2005). If a typical summertime freezing level located around 3000 m is considered, issues arise in locations where the altitude of the lowest radar beam exceed 5400, 6070 and 7200 m (for POH of 40, 60 and 80%, respectively). Since for all the presented investigations a POH threshold of 80% has been used, the shielding issue can be neglected. Evidently, by decreasing the freezing level height and the POH threshold, this issue may become more relevant. Generally speaking, it can be concluded that POH and MESHS are calculated using radar reflectivities at high altitudes. For this reason, they are less affected by radar issues which typically affect quantitative precipitation estimation near the ground.
3.6 Verification The algorithms employed in this study are validated against insurance claim reports by the method of categorical verification, which is widely applied in meteorology (e.g. Delobbe et al., 2003; Saltikoff et al. 2010; Skripniková and Řezáčová (2014); Kunz and Kugel, 2015). A 2 x 2 contingency table (Wilks, 2006) for radar detections and claims reports was used to compute probability of detection (POD), false alarm rate (FAR) and critical success index (CSI). Whereas POD describes the ability of the algorithms to detect hail correctly, FAR indicates the proportion of wrong detections, i.e. when the algorithm identifies hail over an area but no claims were recorded by the insurance. CSI describes the ability of the detection algorithms of having simultaneously a high POD and a low FAR. A perfect score is represented by a POD and CSI equal to unity and a FAR equal to zero. Recently Kunz and Kugel (2015) and Skripniková and Řezáčová (2014), for example, validated different hail detection algorithms against loss data provided by building insurance companies using different skill scores and quality measures from categorical verification (Wilks, 2006). They showed that in general radar-based hail information (Waldvogel’s method among them) provided a comparatively high probability of detection (POD), but also a high false alarm rate (FAR). Similar results were obtained by Delobbe et al. (2005), who verified the POH algorithm with ground reports. However, it is acknowledged that the
This article is protected by copyright. All rights reserved.
Accepted Article
assessment of the FAR is more complicated compared to the assessment of the POD (e.g. Delobbe et al., 2003, Saltikoff et al. 2010) or not possible at all (e.g. Delobbe and Holleman, 2006). This is due to the fact that if no damage was recorded for a specific area, this does not imply that there was no hail. The reason for any discrepancy might also be that insured losses are controlled by several other factors such as insurance coverage (i.e., the number of insured objects), land use, vulnerability of insured assets (crops, cars or buildings) and insurance regulatory practice. Since the radar usually detects hail at higher altitudes, also melting processes may affect the results. However, since the hailstone’s surface is proportional to the square of the radius but the volume is proportional to the cubic, melting may influence only small ice particles such as graupel and small hailstones (Mahoney et al., 2012).
4 Results and discussion Based on the two hail detection algorithms presented in the previous section, different statistics of the estimated hail signals were calculated. The gridded climatological frequency of hail will be discussed first, followed by the monthly distribution, the diurnal cycle and the hail frequency associated with different weather types. Finally, a preliminary validation of the hail products with insurance data is presented. In order to investigate regional differences in the alpine microclimates, hail occurrences are presented with the full radar resolution. We are aware that considering the limited length of the investigation period and the relative rarity of hailstorms, a resolution of 1 km2 is somewhat high and will reveal details that are partly related to individual events. However, the goal of the study being to present occurrence statistics without making any assumptions about an underlying statistical-physical model of hail, the results are presented in the full resolution of the radar grid.
This article is protected by copyright. All rights reserved.
Accepted Article
4.1. Cliimatologic cal freque ency
Figure 4. 4 Left: average numbeer of days with w POH > 80% per season s (Aprril - Septemb ber) and km2 durring the period 2002-22014; right: STD of th he number of o radar-deerived hail days d per season.
The seaasonal averaage number of hail dayss estimated from POH > 80% shoows several maxima with values betweeen 2 and 4 hail days per km². Thee most appaarent maxim ma on both sides of the Alpss (north andd south) are located maainly over thhe foothills in the preallpine regionn. On the northernn parts, enh hanced haill frequency is also fouund over th he Jura, thee Swabian Jura J and Bavariaan Alps in Germany. G T the southh of the Alpps, distinct maxima arre located along To a the foothillss and in thee Po valleyy (sub-regioons 4 and 5 in Fig. 1). Over the main chainns of the Alps, haail is rare, leess than oncce per year,, whereas inn other areaas the valuess range betw ween 0.5 and 2.0 days. s in Fiigure 4 rang ges betweenn 0 and 2.88 and correelates in moost areas The relaated STD shown with thhe mean freequency; areas a with higher freqquencies shhow also a high yearr-to-year variability. Exceptiions are fouund only foor the Jura and a the Po valley, where the STD D is low a variaability of despite the high freequency of hail. The STD reflect the well-knnown high annual hailstorm ms in generral, except for f the Jura and the Po valley. In addittion to the POH, P the MESHS M prodduct was coomputed ovver the samee period to estimate the freqquency of haailstorms inncluding thee sizes on thhe hailstoness. Three diaameter thressholds of D = 2, 3 and 4 cm m were conssidered (Figgure 5). Freequency maaxima of thhe MESHS are well related tto the distribbution of thhe POH signnals presentted in Figurre 4. For haiilstones greaater than
This article is protected by copyright. All rights reserved.
Accepted Article
2 cm, thhe frequenccy maxima reach 1.8 days d per seaason. For laarger hailsto ones, the frrequency maximaa decrease to t 1.4 days (for D > 3 cm) and 0.66 days per season (for D > 4 cm)). Due to sections the highh agreementt of POH annd MESHS S (D > 2 cm m), we consiider in the subsequent s only raddar-derived hail days orr events esttimated wheen POH > 80%.
Figure 55: Average number n of d days with MESHS M > 2ccm (top), > 3 cm (botto om left), and d > 4 cm (bottom m right) per season s (April - Septemb ber) and km m2 during 20002-2014.
Annual mean frequuency anom malies were calculated for f the whoole investigaation periodd and for 6 top), thee northern and the three different subb-regions: for the enttire domainn (Figure 6, southernn prealpinee and alpine regions (Figure ( 6, middle m andd bottom). The displayyed hail frequenncy was acccumulated over all piixels of thee regions. Positive (nnegative) annomalies indicatee years wherre hail was more (less)) frequent compared c to o the multi-y year averagge. In the
This article is protected by copyright. All rights reserved.
Accepted Article
entire ddomain, haill frequency is highly variable. STD D in northeern regions is i greater thhan STD in the ssouth (STD DNorth = 1.444*STDSouth). The yearss of 2003, 2008 and 2009 2 show positive anomaliies larger thhan 1 STD, whereas 20013 and 2014 show neegative anom malies exceeeding -1 STD.
Figure 6 Annual sttandardized d anomalies (POH > 800%) for thee entire dom main (top) and a subregions 1+2 (middlle) and sub-regions 4+ +5 (bottom; see Figure 1 for the location l of the subregions)).
This article is protected by copyright. All rights reserved.
Accepted Article
The decrease in hail frequency since 2009 in the entire domain is mainly due to a decrease of hail in the northern alpine area (Figure 6, middle). Four years (2005, 2007, 2010 and 2012) show a strong north-to-south anomaly. These deviations suggest that some of the general weather situations that favour the development of hailstorms in the North are not the same as for the South. In general, the alpine orography has a direct influence on the distribution of hailstorms; despite of the random nature of hail (Mezher et al., 2012), the identified hot spots suggest that orographic forcing mechanisms and related flow convergence are decisive for hailstorm formation. The repeatability of precipitation events over areas with complex orography has been used to develop a nowcasting systems based on past analogues (e.g. Panziera and Germann, 2010). The high spatial variability of hail days together with a maximum over and downstream of hilly terrain (or in its close proximity) as well as the minimum over the highest mountains were also found in other studies performed over regions with complex orography (Changnon and Changnon, 2000; Garcia-Ortega et al., 2007; Počakal et al., 2009; Kunz and Puskeiler, 2010; Berthet et al., 2011; Cintineo et al., 2012; Eccel et al., 2012; Mezher et al., 2012; Berthet et al., 2013; Merino et al., 2013). The reduced convective activity over the central chain of the Alps was also found by van Delden (2001) using observations from synoptic weather stations and by Nisi et al. (2014) using cloud to ground lightnings. The triggering and updraft enhancement process is particularly important over the foothills in the vicinity of the Alps or generally over hilly terrain (e.g. Barthlott et al., 2005; Kottmeier et al., 2008; Davolio et al., 2009). In those regions low level warm and moist air that origins from the plains or from the Mediterranean south of the Alps are forced to lift due to low level convergences. These convergence zones are caused by the flow deviations at the hills, by flow around regime, or by the outflow of previously developed thunderstorms cells in the alpine valleys. For example, it is well known that the Po valley and the southern Prealpine region is dominated by anabatic – katabatic wind systems (Morgan 1973; Gladich, 2011). For these reasons, the foothills of the alpine chain represent one of the regions in Europe with the most frequent convection initiation (Collier and Lilley, 1994; Huntrieser et al., 1996; van Delden, 2001).
This article is protected by copyright. All rights reserved.
Accepted Article
4.2 Mo onthly disttribution The raddar-derived hail frequeency showss a pronounnced seasonnal cycle with w a maxiimum in June/Jully (Figure 7). In Apriil and September, haillstorms are quite rare and occur without distinct spatial pattterns. From m October too March, haailstorms arre extremelyy rare (onlyy 5 cases l 13 yeaars). In thhese months, the airm masses are usually were observed duuring the last unfavouurable for seevere conveection due to t the low magnitude of the lapsee rate. In May, M hail frequenncy increasees slightly both b in the northern paart of the Alps A and in southern Germany, G whereass in June itt increases more or leess over thhe whole do omain. Duee to more unstable conditioons in the mean, m not only o pre-froontal and frontal f embbedded storm ms with higgh wind shear coonditions, but b also stattionary airm mass convecction are caapable to prroduce hail in June. Highestt hail frequeency can be found overr the Jura annd the alpinee foothills in n the Po vallley.
Figure 77: Average number of radar-derivved hail dayys (POH > 80%) for each e month (April Septemb ber) and km m2 during 20002-2014.
The moonth of July is the mostt active monnth with thee maximum frequency on both sidees of the Alps wiith values of o about 1.88 hail days. Most pronnounced are the maxim ma in the viccinity of
This article is protected by copyright. All rights reserved.
Accepted Article
the Alpps, i.e. on thhe northernn and southern side. Over O the Jurra and in so outhwest Germany, G howeveer, hail frequ uency is redduced comp pared to Junne. This sugggests again n that the Alps A play an impoortant role for f the initiation of sev vere convecctive stormss over the foothills. f In August, hail freqquency is lo ower in the entire dom main. The deecrease is paarticularly evident e nortth of the Alps, but b less in the t South, where warrm and moist conditioon due to the t presence of the Mediterrranean Seaa still providde favourabble conditioons for the developmen d nt of severee storms. Similar results werre found in Griffith (19972). The sttrong decreaase in hail activity a in August A is also connfirmed by the t monthlyy distributioon of insurannce claim reeports (Figu ure 8).
Figure 8: 8 Total num mber of claim ms per montth for the peeriod 2003-22012.
s for Switzerlandd (Admirat et al., 19885) found a maximum m in hail occcurrence Other studies betweenn mid-June and mid-JJuly, which is close too our results. Investiggations for adjacent regions like north-eeastern Italyy (Giaiotti et e al., 2003)), the continnental part of Croatia (Počakal ( et al., 22009) or Czechia C (Skkripniková and a Řezáčoová, 2014) identified the hail maximum m during JJune or July y (Southweest Germanyy; Mohr, 20013). Furthermore, in France Fraile et al. (2003) and a Berthett et al. (20111) found a bimodal diistribution, with an absolute maxiimum in May annd a secondary one in July. All climatoloogies over central Eurrope are coonsistent showingg the minim mum in hail occurrence in autumn, in winter and a in early in the sprinng. If the airmass conditions required foor sustaininng severe coonvection arre not met, i.e. high innstability o short lliving singlle cells with h a limitedd vertical and winnd shear coonditions, sttorms are often developpment and without w well-structuredd hail core. Because of o relatively y low tempperatures and the reduced efffect of meltting, graupeel showers are a commonn especiallyy early in thee spring. This is ooften observved in the nnorthern parrt of the Alpps, but also in other reggions. The presence p of coldd air massees and thee increasedd frequencyy of graup pel shower has alreaddy been hypotheesized by Mezher M et al. (2012).
This article is protected by copyright. All rights reserved.
Accepted Article
4.3 Diurnal cycle Hourly radar-derived hail frequency for the entire domain and for the six sub-regions features a distinct diurnal cycle during all months and regions with a maximum in the late afternoon and a minimum in the morning hours (Figure 9). Most hail events occur in the afternoon hours between 13 and 18 UTC (i.e., approx. 11:00 and 16:00 local time), whereas a minimum is evident in the early morning. From May to July, the three months when hail is more frequent, the diurnal cycle peaks slightly later south of the Alps compared to the northern subregions. For example, over the northern Prealps the peak is between 15 and 17 UTC, whereas it is two hours later over the southern Prealps.
This article is protected by copyright. All rights reserved.
Accepted Article This article is protected by copyright. All rights reserved.
Accepted Article Figure 99: Hourly raadar-deriveed hail frequ uency (norm malized) for the entire domain d and d six subregions. The diagra ams show the diurnal cyycle of hail days d between 00 and 24 UTC for th he period nd 2002-20114. A hail hour h is defin ned as the hour h when a POH valu ue above April-Seeptember an 80% is d detected in the t region.
This article is protected by copyright. All rights reserved.
Accepted Article
In the South, S late afternoon a - evening sttorms are reelatively freequent durinng summer months. Mesoscale descennt of cold air from the t Alps and a thundeerstorm outtflows mayy trigger convecttive cells inn the Prealppine area (M Morgan, 1973). Gladicch et al. (20011) found that the eveningg changes inn the diurnaal wind regim mes can prooduce flow convergencces that mayy trigger or inviggorate conveective cells.. Furthermoore, Giaiottii et al. (2003) found th hat a greaterr amount of wateer vapour from fr July too Septembeer is the reason for ann increasedd evening hailstorm h occurrennce over Frriuli Veneziia Giulia in the northeaastern part of Italy. Seecondary maaxima at night were also fouund over souuth-westernn France by Dessens (19 986). T is a Some ssub-regions show largeer variabilitty in some months (e.g. Jura in August). This mber of haillstorms invoolved. In th hese cases, relative r maxxima are consequuence of thee small num not statiistically reppresentativee. The spatial distributiion of the two-hour t peeriods (UTC C), were on averrage the hig ghest hail frequency f has h been reecorded, shhow severall larger andd almost homogeeneous areass (Figure 100), but also sharp gradiients reflectting the parttly stochastiic nature of deep moist convvection.
Figure 10: 1 Time (UTC) of the highest h rada ar-derived hail h frequenccy per km2 for f the periood AprilSeptemb ber 2002-20014. Only piixels affected by at leasst three haillstorms with h POH > 800% were considerred.
This article is protected by copyright. All rights reserved.
Accepted Article
The Swabian Jura and the Jura mountains in western part of Switzerland show the earliest hail peaks (10-14 UTC). Differential heating, orographic triggering and local low-level convergence may explain the early convection initiation over these regions (e.g. Kottmeier et al., 2008). Another possible explanation is the triggering of hailstorms by pre-frontal uplift (Schemm et al., submitted). Since most of the fronts enter the investigation area from the west, related convection must develop earlier in those areas. Outflow boundaries of the early convective development over the Jura mountains may act as additional triggering mechanism for the subsequent formation of convective cells over the western regions, where the peaks are between 12-16 UTC. These cells usually move towards the east during the afternoon, affecting the central part of the northern prealpine region (Luzern - Zurich) in the late afternoon with peaks between 16-20 UTC. These mechanisms may explain the pronounced west-to-east gradient visible in Figure 10 in the northern part of the Alps. In the southern prealpine area, a larger spatial variability of the hail peak hour is found compared to the northern parts. Over the same region, an interesting line of hail signals peaks late in the night (pink-violet colours corresponding to 02-06 UTC) is visible along the southern border of the prealpine foothills (right part of the investigation sub-region 4). This night-time convective development may be explained by low-level convergence produced by katabatic wind systems (Morgan 1973; Gladich, 2011). In the Po valley a large, almost homogeneous area with a peak frequency between 18 and 22 UTC is evident. Over flat areas, the absence of important triggering mechanisms such as differential heating or orographic uplift may delay convection initiation and, consequently, the formation of severe storms.
4.4 Hail occurrence and weather types Typical circulation patterns are investigated using large-scale weather types (WT) provided by MeteoSwiss (Weusthoff, 2011). A 10-class WT classification based on geopotential and wind direction at 500 hPa was used here. Since the frequency of the different WTs is not homogeneous, the results were normalized by the number of days for each weather type. WT1, WT2 and WT8, which correspond to westerly, south-westerly and southerly flow, are the most frequent WTs. Highest hail frequency is found during the south-western flow regime (WT2), with maximum frequency values of about 5% per grid point (Figure 11). Similar hailfavouring WTs were identified in several other studies for other areas in central and southern
This article is protected by copyright. All rights reserved.
Accepted Article
Europe (e.g. Bider 1954; Willlemse, 19955; Hohl and Schiesser, 2001; Kunzz et al., 20009; Kunz e al., 2013; Berthet et al., a 2013). Days D characcterized by westerly w and Pusskeiler, 20100; Merino et flow (W WT1) are lesss favourabble for hail. During souutherly flow w (WT8), haail occurs both over the Nortth and Soutth, but also over the Baavarian Alpss. Note, how wever, that the latter maximum m is foundd at a large distance d of the Albis raadar locationn, thus the results r may be not reliaable. For the types WT55, WT4 and WT3, nam mely north-easterly, norrtherly and north-weste n erly flow quent over the entire domain. over ceentral Europpe, radar-deerived hail signals occcur less freq Howeveer, some loccalized maxxima are alsoo present inn the southerrn Prealps for f WT4 andd WT5.
Figure 111: Normallized frequeency of rada ar-derived hail h days, i..e. days witth POH > 80%, 8 for differen nt weather tyypes for thee period Ap pril-Septemb ber 2002-2014. N is thee number off days in each claass. Only the six weatheer types wh hich show a hail frequeency in excess of 1% arre shown (westerlly flow (WT T1); south-w westerly flow w (WT2); ssoutherly floow (WT8); north-easteerly flow (WT5); northerly fllow (WT4); north-westeerly flow (W WT3); cf. Tab ble 2).
o radar-b based hail algorithm ms with ins surance data 4.5 Verrification of
This article is protected by copyright. All rights reserved.
Accepted Article
Since raadar-based hail h detectioon algorithm ms are baseed on proxy y data, verifi fication withh ground observaations is reequired. Siince no direct d hail measurem ments are available for the investiggation area,, a preliminnary assessment of thee POH andd MESHS sk kills uses loss data from ann automobiile insurancce companyy. Compareed to buildiings, cars have h the addvantage of a higgher vulnerability; how wever, theyy have the disadvantag d ge to be mo obile and innsurance loss datta may be affected a byy this additiional sourcee of uncertainty. Furth her on, thiss dataset does noot allow to perform verificationss over areaas with very y low popuulation density and does noot allow to evaluate e noon-severe sttorms with hailstone sizes s < 2cm m. Overalll the superp position of the t insuran nce claim reeports with daily max POH valuees shows a good agreement (Figure 122 an example for 23 Juuly 2009). Only over mountainous areas or less uurbanized regions, r whhere few roaads exist, thhe agreemeent is low.
Figure 12: POH dailly maximum (color shadiing) and num mber of car claims c per poostal code zoone(black 2 (left). squares) on 23 July 2009
We therrefore perfformed a quuantitative verificationn only overr areas wheere the pressence of cars is highly prrobable, naamely the 25 most populated urban areas in Switzerland
This article is protected by copyright. All rights reserved.
Accepted Article
(Appenndix A). Foor the verifi fication, moore than 2000 days hav ve been sellected; for each of these ddays the PO OH, the ME ESHS and//or insurannce claim reports (≥ 10 1 per urbaan area) indicateed that there was hail over o at leasst one of these areas. The purrpose of thhe preliminaary verificaation is to investigatee how well the differeent POH and ME ESHS thressholds relatte to the occcurrence of o damage to automobbiles. For this, t the 90th perrcentiles am mong the PO OH or MES SHS valuess distributioon of the coonsidered arrea have been used. It woould be intteresting too validate the hailsto one dimenssions provided by MESHS S, but unforrtunately inn the insuraance datasett this inform mation is noot availablee.
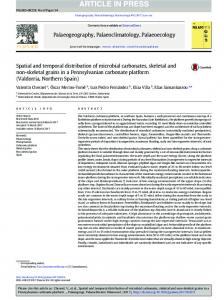
Figure 113: Comparrison of threee skill scorres (POD, FA AR and CSI, left axis) and numbeer of hail events ((right axis) detected with w differen nt POH and MESHS thresholds. The verificcation is perform med against car c insurancce reports over 25 seleccted urban areas a betweeen 2003 and 2012.
t skills scores for different POH P and MESHS M threesholds. Ovverall, a Figure 13 shows three OD (in this study POD D ≥ 0.84) iss found for all POH thhresholds (F Figure 13, left). l On high PO the otheer hand, the FAR is also a high (≥ ≥ 0.7 for PO OH ≤ 70%). An evideent decreasse of the FAR is visible forr increasingg POH threesholds (0.554 for POH H = 80% an nd 0.49 forr POH ≥ 90). A similar behhaviour of the t FAR was w observed by other authors, foor example Aran et al. (20007) or Kessiinger et al. (1995). Th his is an inddication thaat damage due d to hail increase i significcantly with POH valuees greater thhan 70-80% %. A furtheer confirmattion is provvided by Saltikofff et al. (20010) and Delobbe D et al. a (2005); which show wed that inn Belgium and The Netherlaands all events with hail h stones larger l than 2 cm correesponded too a POH off at least equal too 80%. According to thhe findingss of Saltikoff et al. (20 010) and Deelobbe et al.. (2005), it can bbe expected that the FAR for lower l POH H values will w decreasee if the raadar hail detectioons are validated agaiinst crop damage, d whhich occurrs for smalll hail alreeady. In Switzerrland, first results from m a pilot study s employing autoomatic hail detectors (Löffler( Mang eet al, 2011) showed thaat soft hail or even grraupel are often o detectted for low wer POH
This article is protected by copyright. All rights reserved.
Accepted Article
values (i.e. 20-50%). The values of the CSI are in the range of other studies, e.g., by Hollemann (2001) or Kunz and Kugel (2015). CSI values in excess of 0.4 for POH > 80% confirm the plausibility of this threshold considered in our study. Skills scores for the MESHS (Figure 13, right) show slightly lower PODs (≥ 0.74), but much lower FARs (≤ 0.53). On the one hand, it can be expected that higher MESHS values result in a higher POD (i.e. increased connection to damage to automobiles). On the other hand, the population of MESHS classes is not equally distributed (few cases of MESHS-60 mm compared to the number of MESHS-20 mm cases). Therefore the POD does not increase linearly with increasing MESHS thresholds. Because of small populations, the skill scores for MESHS values greater than 40 mm should be taken with care. The validation based on insurance loss data is challenging and the results have to be analysed carefully. Kunz and Kugel (2015) discuss several reasons for the high FARs. First, the POH algorithm was originally developed by comparing radar observations with hailpads data, which are able to detect smaller hailstones. Therefore, high POH values (i.e. > 70%) can be reached even if no damaging hailstones for cars, i.e. hail stones ≥ 2cm, are present. Furthermore, the spatial resolution and errors of both datasets may influence the skill scores considerably. For example, in case of strong winds, hailstone drift represents an error source for the radar data (Schuster et al., 2006). Concerning insurance claim reports, uncertainties in the spatial and temporal allocation of the damage and uncertainty in the presence of cars (population density, insurance contract distributions) are main error sources. Since for our investigation domain no other hail observations exist, insurance claim reports represents the best available verification data for hail.
5 Summary and conclusions A 13-year hail assessment has been conducted by reprocessing and homogenizing volumetric radar data (from April to September) over Switzerland and adjacent countries. Radar-based hail detection algorithms have been used to investigate the spatial distribution and frequency of hail signals with a high spatiotemporal resolution. Indirect hail observations based on radar reflectivity and melting height as proxy data is valuable especially in areas where no ground observations are available like the area considered in this study.
This article is protected by copyright. All rights reserved.
Accepted Article
The results in terms of radar-derived hail days during the 13-year period are located along the foothills of the Alps in the northern and southern prealpine region, over north-western Switzerland, the Jura as well as over southern Germany and the Bavarian Alps. Maximum values range between 2 and more than 4 hail days per summer season. It has been found that the variability in hail occurrence in the North is greater compared to the South (144% of the STD). Monthly radar-derived hail maps show a distinct seasonal cycle with the maximum for June and July. During May and August differences in the hail frequency are found for areas north and south of the Alps. During late spring, hailstorm activity is more pronounced in the North., whereas in late summer, hail is more frequent in the South, especially over the Po valley, where the Mediterranean sea still provides the warm and moist air favourable for the development of hailstorms. An evident diurnal cycle is found for all six sub-regions from April to September. Clear spatial differences in the time of the day, when hail is most frequent, are found. Hail occurs earlier in the day in the western part of Switzerland and in the Swabian Jura. In the northern prealpine area a clear west-to-east gradient is visible, whereas in the southern prealpine area hail tends to occur later on the day. However, in these areas a larger variability is found. Several weather types are favourable for hail formation. Considering wind direction at 500 hPa, hail occurs most frequently with south-westerly flow regimes. For both sides of the Alps the second most hail-producing wind regime is represented by the westerly flow. In this case, hail occurrences and distributions are strongly reduced, especially in the southern areas. However, the results show that hail can also occur on a more local scale during southerly, north-easterly, northerly and north-westerly flow regimes. The two considered radar-based hail detection algorithms were validated with motor loss data from an insurance company. The results show that both POH and MESHS are reliable proxies for hail detection, yielding a POD higher than 75%.Several uncertainties related to the insurance claim reports result in a high FAR, especially for low POH values. However, for POH values greater than 80%, which is used in this study, the FAR decreases rapidly to almost 50%. Despite of a slight overestimation of radar-derived hail occurrence against insurance claims reports, it can be concluded that the hail distributions presented in this work are fairly robust and reliable. The challenges in using radar-based approaches over complex terrain have been described previously, showing that several effects can affect the radar measurements. However, most of
This article is protected by copyright. All rights reserved.
Accepted Article
them do not or only marginally affect the radar products used in this study. The fact that two or more hail events can affect the same area in one day results in a slight underestimation of the number of hail events since monthly and yearly distributions base on daily hail maxima. However, over the considered period 0.02% of the area has been affected by two hailstorms (POH>80%) in one day. By using MESHS or reducing the time aggregation (hourly composites) this issue is even less important. The two empirical algorithms (POH, MESHS) used in this study are based on the idea that strong radar reflectivities are mainly caused by large hydrometeors. The POH has been verified and used operationally since several years, providing reliable results (e.g. Delobbe et al., 2005; Saltikoff et al., 2010; Skripniková and Řezáčová, 2014; Kunz and Kugel, 2015) and independent verifications with insurance data are presented in section 4.5. Because of the scarcity of hail size observations over Switzerland in the past, further effort for the verification of the MESHS is needed in the near future. Next steps include its verification by means of data collected with (1) the new automatic hailsensors network in Switzerland (Löffler-Mang et al, 2011) and (2) hail crowd-sourcing data (e.g. Elmore et al, 2014). Furthermore, an object-based analysis of hailstorms characteristics and their environmental conditions over Switzerland is going to be performed using a radar based thunderstorm tracking algorithm (Hering et al., 2008). The overall goal is to investigate the conditions and the characteristics which leads to the formation and intensification of hailstorms. Expected findings will be potentially interesting for thunderstorm nowcasting purposes.
This article is protected by copyright. All rights reserved.
Accepted Article
A. Appendix
Figure A A.1: the 25 most m populatted urban areeas in Switzeerland (red areas) a selecteed for the verification of the radar r based hail identiffication. Folllowing aggglomerations have been considered: Zürich, Genève, Basel, Laussanne, Bern, Witerthur, Luzern, L St. Gallen, G Luganno, Biel, Thu un, Köniz, La ChauxYverdonde-Fondds, Freiburg, Schaffhauseen, Chur, Verrnier, Neuchhâtel, Uster, Sitten, Lancy, Emmen, Y les-Bainns, Zug, Krienns.
Ackno owledgm ments The autthors thankk M. Boscaacci and L. Clementi (MeteoSw wiss) for tecchnical suppport, P. Ambrossetti, S. Zannini (MeteoS Swiss), A. Martynov M a A. Zischhg (Universsity of Bernn) and S. and Schemm m (Universiity of Bergeen) for scienntific discussions as well w as for providing p suupport in the reviiew of the scientific s doocumentatio on. We kinddly thank M. M Künzler and L. Thoomi (Die Mobiliaar) for provviding insuraance loss data d and relaated supporrt and S. Morel M (University of Bern) foor the prepaaration and preliminary p y analysis off the insurannce claim report dataseet and S. Nisi forr the graphicc design.
This article is protected by copyright. All rights reserved.
Accepted Article
References Admirat P, Goyer GG, Wojtiw L, Carte EA, Roos D, Lozowki E. 1985. A comparative study of hailstorms in Switzerland, Canada and South Africa. J. Climatol., 5 : 35 – 51.
Amburn SA, Wolf PL. 1997. VIL density as a hail indicator. Wea. Forecasing, 12: 473 – 478.
Aran M, Sairouni A, Bech J, Toda J, Rigo T, Cunillera J, Moré J. 2007. Pilot project for intensive surveillance of hail events in Terres de Ponent (Lleida). Atmos. Res., 83: 315-335.
Barthlott C, Corsmeier C, Meißner C, Braun F, Kottmeier C. 2005. The influence of mesoscale circulation systems on triggering convective cells over complex terrain. Atmos. Res. 81: 150–175.
Basara JB, Cheresnick DR, Mitchell D, Illston BG. 2007. An Analysis of Severe Hail Swaths in the Southern Plains of the United States. Transactions in GIS. 11(4): 531-554.
Berthet C, Dessens J, Sánchez JL. 2011. Regional and yearly variations of hail frequency and intensity in France. Atmos. Res., 100: 391 – 400.
Berthet C, Wesolek E, Dessens J, Sánchez JL. 2013. Extreme hail day climatology in Southwestern France. Atmos. Res., 123: 139 – 150.
Betschart M, Hering A. 2012. Automatic Hail Detection at MeteoSwiss. Arbeitsbericht MeteoSchweiz Nr. 238, 59 pp. Available: http://www.meteoschweiz.admin.ch/content/dam/meteoswiss/en/UngebundeneSeiten/Publikationen/Fachberichte/doc/ab238.pdf (accessed 01 Sep 2015).
This article is protected by copyright. All rights reserved.
Accepted Article
Bider M. 1954. Statistische Untersuchungen über die Hagelhäufigkeit in der Schweiz und ihre Beziehungen zur Großwetterlage. Archiv für Meteorologie, Geophysik und Bioklimatologie, 6: 66-90. (only in German)
Bryan GH, Wyngaard JC, Fritsch JM. 2003. Resolution requirements for the simulation of deep moist convection. Mon. Wea. Rev. 131 : 2394 – 2416.
Changnon SA. 1978. The climatology of hail in the United States. Hail: A Review of Hail Science and Hail Suppression, Meteor. Monogr: Amer. Meteor. Soc., 38 : 107–128.
Changnon SA, Changnon D. 2000. Long-Term Fluctuations in Hail Incidences in the United States. J. Climate. 13: 658 – 664.
Changnon D, Changnon SA, Changnon SS. 2001. A method for estimating crop losses from hail in uninsured periods and regions. J. Appl. Meteor. 40: 84 – 91.
Cintineo JL, Smith TM, Lakshmanan V, Brooks HE, Ortega KL. 2012. An objective high resolution hail climatology of the contiguous United States. Wea. Forecasting. 27: 1235– 1248.
Collier CG, Lilley RBE. 1994. Forecasting thunderstorm initiation in north-west Europe using thermodynamic indices, satellite and radar data. Meteorol. Appl. 1: 74–84.
Davolio S, Buzzi A, Malguzzi P. 2009. Orographic triggering of long lived convection in three dimensions. Meteorol. Atmos. Phys. 103: 35–44.
This article is protected by copyright. All rights reserved.
Accepted Article
Dee DP, Uppala SM, Simmons AJ, Berrisford P, Poli P, Kobayashi S, Andrae U, Balmaseda MA, Balsamo G, Bauer P, Bechtold P, Beljaars ACM, van de Berg L, Bidlot J, Bormann N, Delsol C, Dragani R, Fuentes M, Geer AJ, Haimberger L, Healy SB, Hersbach H, Hólm EV, Isaksen L, Kållberg P, Köhler M, Matricardi M, McNally AP, Monge-Sanz BM, Morcrette JJ, Park B-K, Peubey C, de Rosnay P, Tavolato C, Thépaut J-N, Vitart F. 2011. The ERAInterim reanalysis: configuration and performance of the data assimilation system. Q.J.R. Meteorol. Soc., 137: 553–597. doi: 10.1002/qj.828
van Delden A. 2001. The synoptic setting of thunderstorms in western Europe. Atmos. Res., 56: 89 – 110.
Delobbe L, Dehenauw D, Hamid K, Neméghaire J. 2003. Hail detection using radar observations: case studies in the summer 2002. Scientific and Technical Publication Royal Meteorological Institute of Belgium Nr. 029, 39 pp
Delobbe L, Holleman I, Dehenauw D, Neméghaire J. 2005. Verification of radar-based hail detection products. In Proceedings of the W.W.R.P. Symposium on Nowcasting and Very Short Range Forecasting (WSN05), 5-9 September 2005, Toulouse, France, P8.07.
Delobbe L, Holleman I. 2006. Uncertainties in radar echo top heights used for hail detection, Meteor. Appl.. 13: 361– 374.
Dessens J. 1986. Hail in Southwestern France: I: Hailfall Characteristics and Hailstorm Environment. J. Climate Appl. Meteor. 25: 35–47.
Dessens J, Fraile R. 1994. Hailstone size distributions in southwestern France. Atmos. Res., 33: 57–73.
This article is protected by copyright. All rights reserved.
Accepted Article
Dessens J, Fraile R, Pont V, Sánchez JL. 2001. Day-of-the week variability of hail in southwestern France. Atmos. Res. 59-60: 63 – 76.
Dessens J, Berthet C, Sánchez JL. 2009. Yearly fluctuation of hail precipitation in France. In Proceeding of 5th European Conference on Severe Storms, 12-16 October, Landshut, Germany.
Dixon M, Wiener G. 1993. TITAN: Thunderstorm identification, tracking, analysis, and nowcasting –a radar-based methodology. J. Atmos. Oceanic Technol. 10: 785–797.
Donaldson R. 1961. Radar reflectivity profiles in thunderstorms. J. Meteor. 18: 292–305.
Douglas RH. 1963. Recent Hail Research: A Review. Meteorological Monographs, 5 (27): 157 - 172.
Eccel E, Ferrari P. 1997. La grandine in Trentino: risultati dell’analisi climatologica per il ventennio 1974–1993. Istituto Agrario di S. Michele. Quaderni di Esperienze & Ricerche n. 3. (only in Italian)
Eccel E, Cau P, Riemann-Campe K, Biasoli F. 2012. Quantitative hail monitoring in an alpine area: 35-year climatology and links with atmospheric variables. Int. J. of Climatol., 32: 503 – 517.
Edwards R, Thompson RL. 1998. Nationwide Comparisons of Hail Size with WSR-88D Vertically Integrated Liquid Water and Derived Thermodynamic Sounding Data. Wea. Forecasting. 13: 277–285.
This article is protected by copyright. All rights reserved.
Accepted Article
Elmore KL, Flamig ZL, Lakshmanan V, Kaney BT, Farmer V, Reeves HD, Rothfusz LP. 2014. mPING: Crowd-sourcing weather reports for research. Bull. Amer. Meteor. Soc. 95: 1335–1342. doi:10.1175/BAMS-D-13-00014.1.
Foote GB, Knight CA. 1979. Results of a randomized hail suppression experiment in northeast Colorado. Part I: Design and conduct of the experiment. J. Appl. Meteor. 18: 1526– 1537.
Foote GB, Krauss TW, Makitov V. 2005. Hail metrics using convectional radar. In Proceedings of 16th Conference on Planned and Inadvertent Weather Modification, 10-13 January 2005, San Diego, California: 1-6. American Meteorological Society: Boston, MA.
Foresti L, Kanevski M, Pozdnoukhov A. 2011. Data-driven exploration of orographic enhancement of precipitation, Adv. Sci. Res. 6: 129-135.
Fraile R, Berthet C, Dessens J, Sánchez JL. 2003. Return periods of severe hailfalls computed from hailpad data. Atmos. Res., 67–68: 189–202.
Garcia-Ortega E, Fita L, Romero R, Lopez L, Ramis C, Sánchez, JL, 2007. Numerical simulation and sensitivity study of a severe hailstorm in northeast Spain. Atmos. Res. 85: 225–241.
Germann U. 1999. Radome attenuation – A serious limiting factor for quantitative radar measurements? Meteorol. Zeitschrift. 8: 85–90.
Germann U, Galli G, Boscacci M, Bolliger M. 2006. Radar precipitation measurement in a mountainous region. Q. J. R. Meteorol. Soc. 132: 1669–1692.
This article is protected by copyright. All rights reserved.
Accepted Article
Germann U, Boscacci M, Gabella M, Sartori M. 2015. Radar design for prediction in the Swiss Alps. Meteor. Techn. Int. 4: 42-45.
Giaiotti D, Nordio S, Stel F. 2003. The climatology of hail in the plain of Friuli Venezia Giulia. Atmos. Res. 67-68: 247-259.
Gladich I, Gallai I, Giaiotti DB, Stel F. 2011. On the diurnal cycle of deep moist convection in the southern side of the Alps analysed through cloud-to-ground lightning activity. Atmos. Res. 100: 371-376.
Griffith MM Jr. 1972. A General Description of the Hail Problem in the Po Valley of Northern Italy. J. Appl. Meteor. 12: 338–353.
Held G. 1978. The probability of hail in relation to radar echo heights on the South African Highveld. J. Appl. Meteor. 17: 755–762.
Hering AM, Morel C, Galli G, Sénési S, Ambrosetti P, Boscacci M. 2004. Nowcasting thunderstorms in the Alpine region using a radar based adaptive thresholding scheme. In Proceedings of 3rd European Conference Radar in Meteorology and Hydrology (ERAD), 6– 10 September 2004, Visby, Sweden. 1–6. Copernicus: Goettingen, Germany.
Hering AM, Germann U, Boscacci M, Sénési S. 2008. Operational nowcasting of thunderstorms in the Alps during MAP D-PHASE. In Proceedings of 5th European Conference on Radar in Meteorology and Hydrology (ERAD), 30 June–4 July 2008, Helsinki, Finland. 1–5. Copernicus: Goettingen, Germany.
Hohl R, Schiesser HH. 2001. Cloud-to-ground lightning activity in relation to the radar-derived hail kinetic energy in Switzerland. Atmos. Res. 56: 375-396.
This article is protected by copyright. All rights reserved.
Accepted Article
Hohl R, Schiesser HH, Knepper I. 2002. The use of weather radars to estimate hail damage to automobiles: an exploratory study in Switzerland. Atmos. Res. 61: 215-238.
Holleman I, 2001. Hail detection using single-polarization radar. KNMI publication: WR2001-01, pp 72. Available: http://www.knmi.nl/publications/fulltexts/wr_hail.pdf (accessed 01 Sep 2015).
Houze RA, Schmid W, Fovell RG, Schiesser HH. 1993. Hailstorms in Switzerland: Left Movers, Right Movers and False Hooks. Mon. Weather Rev. 121: 3345 – 3370.
Huntrieser H, Schiesser HH, Schmidt W, Waldvogel A. 1996. Comparison of traditional and newly developed thunderstorm indices for Switzerland. Wea. Forecasting. 12: 108–125.
Joe P, Burgess D, Potts R, Keenan T, Stumpf G, Treloar A. 2004. The S2K severe weather detection algorithms and their performance. Wea. Forecasting. 19: 43–63.
Johnson JT, MacKeen PL, Witt A, Mitchell ED, Stumpf GJ, Eilts MD, Thomas KW. 1998. The Storm Cell Identification and Tracking (SCIT) algorithm: An enhanced WSR-88D algorithm. Wea. Forecasting. 13: 263–276.
Joss J, Schaedler B, Galli G, Cavalli R, Boscacci M, Held E, Della Bruna G, Kappenberger G, Nespor V, Spiess R. 1998. Operational Use of Radar for Precipitation Measurements in Switzerland. vdf Hochschulverlag AG ETH Zuerich: Zuerich, Switzerland. Available:
http://www.meteoschweiz.admin.ch/content/dam/meteoswiss/fr/Mess-und-
Prognosesysteme/doc/meteoswiss_operational_use_of_radar.pdf (accessed 02 Dec 2015).
This article is protected by copyright. All rights reserved.
Accepted Article
Kessinger CJ, Brandes EA, Smith JW. 1995. A comparison of the NEXRAD and NSSL hail detection algorithms. In Preprints of 27th Conference on Radar Meteorology, Vail, Colorado, 603-605. American Meteorological Society: Boston, MA.
Kottmeier C, Kalthoff N, Bathlott C, Corsmeier U, Van Baelen J, Behrendt A, Behrendt R, Blyth R, Coulter R, Crewell S, Di Girolamo P, Dorninger M, Flamant C, Foken T, Hagen M, Hauck C, Hoeller H, Konow H, Kunz M, Mahlke H, Mobbs S, Richard E, Steinacker R, Weckwerth T, Wieser A, Wulfmeyer V. 2008. Mechanisms initiating deep convection over complex terrain during COPS. Meteorol. Zeitschrift. 6: 931–948.
Kunz M, Sander J, C. 2009. Recent trends of thunderstorm and hailstorm frequency and their relation to atmospheric characteristics in southwest Germany. Int. J. of Climatol., 29: 2283 – 2297.
Kunz M, Puskeiler M. 2010. High-resolution assessment of the hail hazard over complex terrain from radar and insurance data. Meteor. Zeitschrift, 19 : 427 – 439.
Kunz M, Kugel PSI. 2015: Detection of hail signatures from single-polarization C-band radar reflectivity . Atmos. Res. 153: 565-577.
Löffler-Mang M, Schön D, Landry M. 2011. Characteristics of a new automatic hail recorder. Atmos. Res. 100: 439-446.
Mahoney K, Alexander MA, Thompson G, Barsugli JJ, Scott J. 2012. Changes in hail and flood risk in high-resolution simulations over Colorado’s mountains. Nature Climate Change. 2(2): 125-131. Mandapaka PV, Germann U, Panziera L. 2013. Diurnal cycle of precipitation over complex Alpine orography: inferences from high-resolution radar observations. Q. J. R. Meteorol. Soc. 139: 1025–1046.
This article is protected by copyright. All rights reserved.
Accepted Article
Mandapaka PV, Germann U, Panziera L, Hering A. 2012. Can Lagrangian extrapolation of radar fields be used for precipitation nowcasting over complex Alpine orography? Wea. Forecasting. 27: 28–49.
Manzato A. 2013. Hail in Northeast Italy: Climatology and Bivariate Analysis with the Sounding-Derived Indices. Atmos. Res. 51: 449 – 467.
Mather GK, Treddenick D, Parsons R. 1976. An observed relationship between the height of the 45-dBZ contours in storm profiles and surface hail reports. J. Appl. Meteor. 15: 1336– 1340.
McMaster HJ. 1999. The potential impact of global warming on hail losses to winter cereal crops in New Southwales. Climatic Change. 43 : 455 – 476.
Mecklenburg S, Joss J, Schmid W. 2000. Improving the nowcasting of precipitation in an Alpine region with an enhanced radar echo tracking algorithm. J. Hydrol. 239: 46–68.
Merino A, García-Ortega E, López L, Sánchez JL, Guerrero-Higueras AM. 2013. Synoptic environment, mesoscale configurations and forecast parameters for hailstorms in Southwestern Europe. Atmos. Res. 122: 183–198.
Mezher RN, Doyle M, Barros V. 2012. Climatology of hail in Argentina. Atmos. Res., 114115 : 70 – 82.
Mohr S. 2013. ‘Änderung des Gewitter- und Hagelpotentials im Klimawandel‚. PhD thesis, KIT Scientific Publishing, Karlsruhe, 243 pp.
This article is protected by copyright. All rights reserved.
Accepted Article
Mohr S, Kunz M. 2013. Recent trends and variabilities of convective parameters relevant for hail events in Germany and Europe. Atmos. Res. 123: 211 – 228.
Morel S. 2014. ‘Verification of radar-based hail detection algorithms with insurance loss data in Switzerland’. Master Thesis, 83pp. Faculty of Science, University of Bern, Bern, Switzerland.
Morgan, GM. 1973. A General Description of the Hail Problem in the Po Valley of Northern Italy. J. Appl. Meteor. 12: 338–353.
Nisi L, Ambrosetti P, Clementi L. 2014. Nowcasting severe convection in the Alpine region: the COALITION approach. Q.J.R. Meteorol. Soc., 140: 1684–1699. doi: 10.1002/qj.2249
Panziera, L, Germann U. 2010. The relation between airflow and orographic precipitation on the southern side of the Alps as revealed by weather radar. Q.J.R. Meteorol. Soc. 136: 222– 238. doi: 10.1002/qj.544
Plumandon JR.1901.Les orages et la grêle. Ed. Masson et Cie, Paris, 192 pp. (only in French)
Počakal D, Večenaj Z, Štalec J. 2009. Hail characteristics of different regions in continental part of Croatia based on influence of orography. Atmos. Res. 93: 516 – 525.
Puskeiler, M. 2013. Radarbasierte Analyse der Hagelgefährdung in Deutschland. KIT Scientific
Publishing,
Karlsruhe,
202
http://dx.doi.org/10.5445/KSP/1000034773 (accessed 01 Sep 2015).
This article is protected by copyright. All rights reserved.
pp.
Available:
Accepted Article
Puskeiler, M, Kunz M, Schmidberger M. 2015. Hail statistics over Germany derived from single-polarization Radar Data. (submitted Atmos. Res.).
Rinehart RE, Staggs DW, Changnon SA. 1968. Identification of Hail and No-Hail Echoes. In Proceedings of the 13th Radar Meteorology conference, 20-23 August 1968, Montreal, Canada, 422-427. American Meteorological Society: Boston, MA.
Rotach MW, Ambrosetti P, Ament F, Appenzeller C, Arpagaus M, Bauer HS, Behrendt A, Bouttier F, Buzzi A, Corazza M, Davolio S, Denhard M, Dorninger M, Fontannaz L, Frick J, Fundel F, Germann U, Gorgas T, Hegg C, Hering A, Keil C, Liniger MA, Marsigli C, McTaggart-Cowan R, Montaini A, MylneK, Ranzi R, Richard E, Rossa A, Santos-Munoz D, Schaer C, Seity Y, Staudinger M, Stoll M, Volkert H, Walser A, Wang Y, Werhahn J, Wulfmeier W, Zappa M. 2009. MAP D-PHASE: Real-time demonstration of weather forecast quality in the Alpine region. Bull. Am. Meteorol. Soc. 90: 1321–1336.
Šálek M, Cheze JL, Handwerker J, Delobbe L, Uijlenhoet R. 2004. Radar techniques for identifying precipitation type and estimating quantity of precipitation. Document of COST Action
717,
WG
1,
51
pp.
Available:
http://www.smhi.se/cost717/doc/WDF_01_200407_1.pdf (accessed 01 Sep 2015).
Saltikoff E, Tuovinen JP, Kotro J, Kuitunen T, Hohti H. 2010. A Climatological Comparison of Radar and Ground Observations of Hail in Finland. J. Appl. Meteor. Climatol., 49: 101– 114. doi: http://dx.doi.org/10.1175/2009JAMC2116.1
Sánchez JL, Fraile R, DelaMadrid JL, DelaFuente MT, Rodriguez P, Castro A. 1996. Crop damage: the hail size factor. J. App. Meteor. 35: 1535–1541.
This article is protected by copyright. All rights reserved.
Accepted Article
Sánchez JL, López L, García-Ortega E, Gil B. 2013. Nowcasting of kinetic energy of hail precipitation using radar. Atmos. Res. 123: 48-60.
Schemm S., Nisi L., Martinov A., Martius O. 2015. Hail formation in pre-frontal environments: A long-term study over Switzerland. (submitted ASL).
Schuster SS, Blong RJ, Speer M. 2005. A hail climatology of the Greater Sydney Area and New South Wales, Australia. Int. J. of Climatol.. 25: 1633 – 1650.
Schuster SS, Blong RJ, McAneney KJ. 2006. Relationship between radar-derived hail kinetic energy and damage to insured buildings for severe hailstorms in Eastern Australia. Atmos. Res. 81: 215-235.
Skripniková K, Řezáčová D. 2014. Radar-based hail detection. Atmos. Res. 144: 175-185.
Stucki M, Egli T. 2007. Synthesebericht Elementarschutzregister Hagel. Präventionsstiftung der kantonalen Gebäudeversicherungen. Available: http://praeventionsstiftung.ch/getmedia/da25e9c1-dfe7-465e-a04c6c03de8fe073/Hagel_d.pdf.aspx (accessed: 01 Sep 2015).
Treloar ABA. 1996. Vertically Integrated Liquid Water Content as an Indicator of Severe Hail in New South Wales. In Preprints of 5th Australian Severe Thunderstorm Conference, 28 July-2 August 1996, Avoca Beach, New South Wales. Bureau of Meteorology: Melbourne, Australia.
Treloar ABA. 1998. Vertically integrated radar reflectivity as an indicator of hail size in the Greater Sydney region of Australia. In Proceedings of 19th Conference on Severe Local
This article is protected by copyright. All rights reserved.
Accepted Article
Storms, 14-18 September 1998, Minneapolis, Minnesota, 48-51. American Meteorological Society: Boston, MA.
Tuovinen J, Punkka A, Rauhala J, Hohti H, Schultz D. 2009. Climatology of severe hail in Finland: 1930–2006. Mon. Weather Rev. 137: 2238 – 2249.
Uppala SM, KÅllberg PW, Simmons AJ, Andrae U, Bechtold VDC, Fiorino M, Gibson JK, Haseler J, Hernandez A, Kelly GA, Li X, Onogi K, Saarinen S, Sokka N, Allan RP, Andersson E, Arpe K, Balmaseda MA, Beljaars ACM, Berg LVD, Bidlot J, Bormann N, Caires S, Chevallier F, Dethof A, Dragosavac M, Fisher M, Fuentes M, Hagemann S, Hólm E, Hoskins BJ, Isaksen L, Janssen PAEM, Jenne R, Mcnally AP, Mahfouf J-F, Morcrette J-J, Rayner NA, Saunders RW, Simon P, Sterl A, Trenberth KE, Untch A, Vasiljevic D, Viterbo P, Woollen J. 2005. The ERA-40 re-analysis. Q.J.R. Meteorol. Soc., 131: 2961–3012. doi: 10.1256/qj.04.176
Villarini G, Krajewski WF. 2010. Review of the different sources of uncertainty in single polarization radar-based estimates of rainfall. Surv. Geophys. 31: 107–129.
Vinet F. 2001. Climatology of hail in France. Atmos. Res. 56: 309 – 323.
Waldvogel A, Federer B, Grimm P. 1979. Criteria for the detection of hail cells. J. Appl. Meteor. 18: 1521-1525.
Webb JDC, Elsom DM, Reynolds DJ. 2001a. Climatology of severe hailstorms in Great Britain. Atmos. Res. 56: 291 – 308.
Webb RM, Treloar ABA, Colquhoun JR, Potts RJ, Bally J, Keenan TD, May PT. 2001b. Overview of Sydney weather during the Forecast Demonstration Project. In Preprints of 30th
This article is protected by copyright. All rights reserved.
Accepted Article
International Conference on Radar Meteorology, 19-24 July 2001, Munich, Germany, 477– 479. American Meteorological Society: Boston, MA.
Weisman ML, Skamarock WC, Klemp JB. 1997. The resolution dependence of explicitly modeled convective systems. Mon. Wea. Rev. 125 : 527 – 548.
Weusthoff T. 2011. Weather Type Classification at MeteoSwiss – Introduction of new automatic classifications schemes, Arbeitsberichte der MeteoSchweiz, 235, 46 pp. Available on:
http://www.meteoschweiz.admin.ch/content/dam/meteoswiss/en/Ungebundene-
Seiten/Publikationen/Fachberichte/doc/ab235.pdf (accessed 01 Sep 2015).
Wieringa J, Holleman I. 2006. If cannons cannot fight hail, what else? Meteor. Zeitschrift. 15: 659 – 669.
Wilk KE. 1961. Radar Investigations of Illinois Hailstorms. Scientific Report No. 1, Contract No. AF19(604)-4940, State Water Survey, Urbana, Ill., Jan. 15, 1961, 42 pp.
Wilks DS. 2006. Statistical Methods in the Atmospheric Sciences: An Introduction. 2nd Edition. Academic Press: Amsterdam; 627pp.
Willemse S. 1995. A statistical analysis and climatological interpretation of hailstorms in Switzerland. Ph.D. Thesis No. 11137, ETH Zürich, 194 pp.
Witt A, Eilts MD, Stumpf GJ, Johnson JT, Mitchell ED, Thomas KW. 1998. An enhanced hail detection algorithm for the WSR-88D. Wea. Forecasting. 13: 286-303.
Xie B, Zhang QH, Wang Y. 2008. Trends in hail in China during 1960-2005. Gephys. Res. Letters. 35: L13801.
This article is protected by copyright. All rights reserved.
Accepted Article
Xie B, Zhang Q, Wang Y. 2010. Observed Characteristics of Hail Size in Four Regions in China during 1980-2005. J. Climate. 23: 4973 – 4982.
Zhang C, Thang Q, Wang Y. 2008. Climatology of hail in China: 1961-2005. J. Appl. Meteorol. Climatol. 47: 795-804.
This article is protected by copyright. All rights reserved.