933
Vol.52, n. 4: pp. 933-944, July-August 2009 ISSN 1516-8913 Printed in Brazil
BRAZILIAN ARCHIVES OF BIOLOGY AND TECHNOLOGY A N
I N T E R N A T I O N A L
J O U R N A L
Spatial and Temporal Distribution of Ichthyoplankton in the Upper Uruguay River, Brazil Samara Hermes-Silva, David Reynalte-Tataje and Evoy Zaniboni-Filho* Laboratório de Biologia e Cultivo de Peixes de Água Doce; Universidade Federal de Santa Catarina; Rodovia SC 406, 3532; 88066-000; Florianópolis - SC - Brasil
ABSTRACT The distribution and abundance of fish eggs and larvae was analyzed in three sections of the Upper Uruguay river, in a stretch of 290 km. Samples were collected monthly from October, 2001 to March, 2002 during 48-h cycles at 6h intervals between each sampling. Surface and bottom samples were collected with a 0.5-mm mesh cylindroconical net. Fishes from the Upper Uruguay river were reproductively active mainly from October to January, and this activity was more intense at the Ligeiro and Chapecó tributaries and Chapecó main river. It was observed that the tributaries are important spawning grounds and larval nursery sites, indicating the importance of preserving such environments. Key words: Ichthyoplankton, fish eggs and larvae, Uruguay river, 48-h cycles
INTRODUCTION Most South American freshwater fish species exhibit seasonal reproductive cycles related to favorable environmental conditions that maximize the reproductive success (Vazzoler, 1996; LoweMcConnel, 1999; Zaniboni-Filho and Nuñer, 2004). Many fish species migrate upstream to spawning areas in the flood period and then the larvae drift downstream to suitable nursery habitats (Vazzoler, 1996). Many studies have reported that, in species that undertake reproductive migrations, gonadal maturation is initiated when the water temperature increases (spring-summer), but the fish wait for the first rains of the season to move up the river to spawning grounds (Lowe-McConnel, 1999; Zaniboni-Filho and Schulz, 2003). There are two *
forms of fish migration in the Uruguay river basin, one in which the fish remain in the mainstream and another in which the fish enter tributary rivers (Zaniboni-Filho and Schulz, 2003). By studying the distribution of fish eggs and larvae, we can provide evidence on spawning time and natural breeding areas, which present valuable information for the protection of fish populations and the management of fishery resources, especially in relation to successful recruitment (Araújo-Lima and Oliveira, 1998; Bialetzki et al., 2004; Lima and Araújo-Lima, 2004). The Upper Uruguay river is characterized by flowing stretches separated by geographical features, such as rapids, waterfalls and gorges (Zaniboni-Filho and Schulz, 2003). After the construction of two hydroelectric power plants, Itá and Machadinho, which began to operate in 2000
Author for correspondence:
[email protected]
Braz. Arch. Biol. Technol. v.52 n.4: pp. 933-944, July/Aug 2009
934
Hermes-Silva, S. et al.
and 2002, respectively, many of these structures were flooded, changing the hydrological regimen and dynamics and, consequently, affecting the structure of native fish communities. By investigating the distribution and abundance of fish eggs and larvae in three different sections in the Upper Uruguay river basin, under the influence of the hydroelectric power plants, this study attempted to identify spawning sites and natural rearing areas, and to determine temporal and spatial distribution patterns. Such information is essential for native fish management and conservation.
MATERIAL AND METHODS This study was conducted in the Upper Uruguay river region in a stretch of approximately 290 km, between Machadinho dam (27º31′ S; 51º47′ W) and Balneário de Pratas, just below the confluence of the Chapecó and Uruguay rivers (27°05′ S; 53°01′ W). In this stretch, the river flows through a steep valley, with a small floodplain and no marginal lagoons. The tributaries are short and have many waterfalls, which hinder the movement of fish (Zaniboni-Filho and Schulz, 2003).
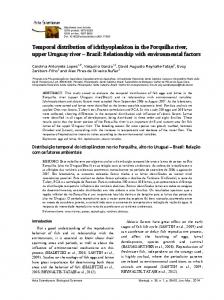
Three sampling sections were selected (Fig. 1). For each section, two sampling sites next to the mouth of a tributary with the main river were considered. One site was located in the tributary river and the other in the Uruguay river, upstream from the confluence with the tributary. At each site, samples were collected, in three replicates, at two depths: surface and bottom. The selected sections were the following: o Ligeiro (27º31′ S; 51º50′ W): located 5 km downstream from the Machadinho dam and approximately 150 km upstream from the Itá dam, in a free-flowing river stretch of approximately 6 km. Ligeiro river is the only tributary in this free stretch upstream from the Itá reservoir. o Palomas (27º17′ S; 52º19′ W): located just downstream from the Itá dam. Palomas river is the first tributary downstream. This sampling site is directly influenced by the water discharged by the power plant. o Chapecó (27º05′ S; 53º01′ W): located approximately 140 km downstream from the Itá dam. Chapecó river is an important tributary of the Upper Uruguay river basin and a possible migratory route of rheophilic fish (Zaniboni-Filho and Schulz, 2003).
Figure 1 - Map of the Upper Uruguay river with the location of the sampling sites.
Braz. Arch. Biol. Technol. v.52 n. 4: pp. 933-944, July/Aug 2009
Spatial and Temporal Distribution of Ichthyoplankton
Samplings were done monthly between October, 2001 and March, 2002 during 48-h cycles at 6-h intervals (0300h, 0900h, 1500h, and 2100h), using a 0.5-mm mesh cylindro-conical net with a mouth area of 0.11 m2. A flow meter was fixed to the mouth of each net to determine the volume of water filtered. The equipment was used in the water for 1 h at both sampling sites in each section, tied to a cable stretched from one margin of the river to the other. In situations in which the tributary river was dammed by the main river, resulting in a stream speed lower than 0.01 m.s-1, surface trawls were pulled for 20 min by a boat at low speed. Samples were fixed in 4% formalin and transferred to the laboratory, where fish eggs and larvae were separated from the rest of the plankton and quantified. All the collected larvae were identified to the lowest taxonomic level possible. The abundance of eggs and larvae was standardized per 10 m3 of filtered water (Nakatani et al., 2001). Water samples were obtained at each sampling site to determine the temperature (ºC), dissolved oxygen (mg.L-1), pH, alkalinity (mgCaCO3.L-1) and hardness (mgCaCO3.L-1). Water transparency (cm) was determined using a Secchi disc. Differences of environmental variables between the tributary and the main river during the study period at each section were analyzed by one-way ANOVA. Differences between egg and larval densities at different sampling sites (main river and tributaries) and months (October to March) were analyzed by factorial ANOVA and, when necessary, the Tukey test. The influence of sampling time (0300h, 0900h, 1500h and 2100h) and layer (surface and bottom) on the abundance of fish eggs and larvae at each sampling site were also analyzed by factorial ANOVA and, when necessary, the Tukey test. The site located at the Palomas tributary was excluded from this analysis because samples were taken only from the surface. According to the presuppositions of ANOVA, data were first
935
transformed logarithmically (x+1). The relation of environmental variables with the distribution of egg and larval densities were analyzed through Pearson’s correlation. Principal Components Analysis (PCA) was first used to select the most representative environmental variables. Data were standardized due to the differing units of measurement. Differences were considered significant at P < 0.05.
RESULTS AND DISCUSSION A total of 1,205 samples were collected over the 6month period, of which 759 contained eggs and/or larvae. In those samples, 52,422 eggs and 2,958 larvae were found. Fish larvae were identified belonging to five orders, 20 families, and 50 taxa, though the composition varied between sampling sites (Table 1). At the Ligeiro section, the number of taxa registered at the tributary was higher than at the main river. Approximately 48.7% of the species were common to both rivers and 38.5% were registered exclusively at the tributary. These results showed the importance of the tributary at this section of the Uruguay river. The presence of Machadinho dam 6 km upstream on the Uruguay river may be the reason why many species look for tributaries to spawn. At the other study sections, Palomas and Chapecó, the number of taxa registered at the main river was higher than at the tributaries. Regarding Palomas, which was also located just below a dam (Itá), the short draining area of this tributary may not attract many species, which may complete their life cycle in the main stream. At Chapecó, 66.7% of the species were common to both rivers and only 11.9% were exclusive to the tributary. One of the species that exclusively used the tributary was Prochilodus lineatus, an important long-distance migratory species (Zaniboni-Filho and Schulz, 2003).
Braz. Arch. Biol. Technol. v.52 n. 4: pp. 933-944, July/Aug 2009
936
Hermes-Silva, S. et al.
Table 1 - List of identified taxa of fish larvae collected in each sampling site in three different sections of the Upper Uruguay river during the study period. Ligeiro Palomas Chapecó Reproductive Main river Tributary Main river Tributary Main river Tributary ORDER / Family / Taxa strategy ATHERINIFORMES Atherinidae Odontesthes aff. perugiae S + + CHARACIFORMES Anostomidae Leporinus amae SM + + + Leporinus obtusidens LM + + Leporinus striatus SM + Schizodon nasutus SM + + + + + Characidae Acestrorhynchus pantaneiro ** + + + + + Astyanax bimaculatus S + + + Astyanax eigenmanniorum S + + Astyanax fasciatus SM + + + + Astyanax gr. + + scabripinnis SM + + + Astyanax spp. + Bryconamericus iheringii SM + + + + + + Bryconamericus spp. + + Bryconamericus + + stramineus SM + + + + Galeocharax humeralis ** + + + Oligosarcus jenynsii ** + + + + + + Salminus brasiliensis LM + Serrasalmus maculatus S + Curimatidae Steindachnerina spp. SM + + + Erythrinidae Hoplias spp. S + + + + + Parodontidae Apareiodon affinis SM + + + Prochilodontidae Prochilodus lineatus LM + GYMNOTIFORMES Apteronotidae Porotergus ellisi S + Gymnotidae Gymnotus carapo S + + + + + Sternopygidae Eigenmannia virescens S + + + + + PERCIFORMES Cichlidae + + + Scianidae Pachyurus bonariensis S + SILURIFORMES Aspredinidae Bunocephalus doriae ** + (cont...)
Braz. Arch. Biol. Technol. v.52 n. 4: pp. 933-944, July/Aug 2009
Spatial and Temporal Distribution of Ichthyoplankton
937
(cont. Table 1)
ORDER / Family / Taxa
Auchenipteridae Auchenipterus sp. Tatia spp. Cetopsidae Cetopsis gobioides Heptapteridae Imparfinis sp. Pimelodella sp. Rhamdella longiuscula Rhamdia quelen Loricaridae Ancistrus taunayi Cf. Rhinelepis Hypostomus spp. Loricariichthys sp. Paraloricaria vetula Rineloricaria sp. Pimelodidae Iheringichthys labrosus Parapimelodus valenciennis Pimelodus absconditus Pimelodus atrobrunneus Pimelodus maculatus Pimelodus spp. Steindachneridion scriptum Pseudopimelodidae Microglanis eurystoma Trichomycteridae Paravandellia bertoni Tricomycterus sp.
Ligeiro Reproductive strategy Main river Tributary
SM SM
+ +
SM ** SM SM SM S LM S S S S
+ + +
Palomas
Chapecó
Main river Tributary
Main river Tributary
+ +
+
+ +
+
+
+
+ +
+
+
+
+
+
+
+ + +
+ +
+
+
+
+
+ + + + +
+ + + + +
+
+
+ +
+ +
+
+
+
SM
+
SM SM SM SM
+
SM
+
SM
+
+
** **
+
+
+ + + + +
+
+ +
+ + +
+
S= Sedentary; SM = Short distance migratory; LM = Long distance migratory; ** no information.
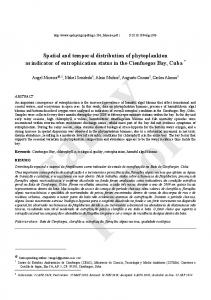
Most environmental variables showed differences between the main river and the tributary in each section during the study period. Water temperature, pH, alkalinity and hardness were mainly higher in the tributaries during most of the months analyzed (Fig. 2). ANOVA showed significant differences between the distribution of egg (df = 25; F = 6.38; P = 0.000) and larval (df = 25; F = 5.645; P = 0.000)
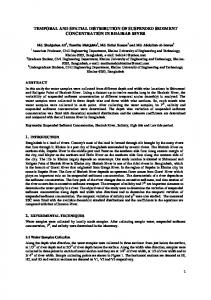
densities across sampling sites and months. The highest concentrations of eggs were registered in the Ligeiro tributary in November, the Chapecó tributary in October, November, and December, and the Chapecó main river in November and December. The highest concentrations of larvae were registered in the Ligeiro tributary in November, the Chapecó tributary in December, and the Chapecó main river in January (Fig. 3).
Braz. Arch. Biol. Technol. v.52 n.4: pp. 933-944, July/Aug 2009
938
Hermes-Silva, S. et al.
Figure 2 - Mean (±SE) of environmental parameters of the main river (——) and the tributary (- - -) in each section during the study period (*P < 0.05).
Braz. Arch. Biol. Technol. v.52 n. 4: pp. 933-944, July/Aug 2009
Spatial and Temporal Distribution of Ichthyoplankton
939
Figure 3 - Average density and standard error for fish eggs and larvae captured in the different sampling sites and months.
These results demonstrated that fishes from the Upper Uruguay river are reproductively active during the same period as that the observed in the lower section of the Uruguay river by Mantero and Fuentes (1997). Higher concentrations of eggs and larvae were registered in the Ligeiro and Chapecó tributaries and in the Uruguay river in the Chapecó section. These results suggest that reproductive activity begins sooner in the tributaries than in the main river, probably related to fluctuations of environmental variables such as water temperature, which, as observed in the present study, was normally higher in the tributaries.
The low densities of eggs and larvae observed in the Palomas section could be a result of the influence of the Itá dam. Although it was the most upstream site of the long free stretch of the Uruguay river – more than 900 km without dams or geographical accidents – this section was located immediately below Itá dam, under the direct influence of water from the turbines and/or discharged by the power plant. There is much evidence that the water from the turbines of reservoirs disrupts the life cycle and causes fragmentation of downstream fish populations (Humphries and Lake, 2000). This control of water produces direct effects on the river flow, altering
Braz. Arch. Biol. Technol. v.52 n.4: pp. 933-944, July/Aug 2009
940
Hermes-Silva, S. et al.
the volume and period of floods and, indirectly, modifying the quality of the water downstream by, for example, decreasing the water temperature and causing qualitative and quantitative changes in the organic and inorganic matter transported by the river (Humphries and Lake, 2000; Humphries et al., 2002). Differences were also observed between the abundance of fish eggs and larvae at different times and layers. At most sampling sites, the highest densities of eggs and larvae were observed during the night, mostly at 2100h (Fig. 4 and 5; Tables 2 and 3). It is worth emphasizing the high
density of eggs registered at 3 a.m. at the Chapecó main river and tributary. This result could be a reflection of the position of the sampling site. Chapecó is the only section of the Uruguay river without any direct influence of dams and reservoirs, located in a long free stretch of the river (about 140 km downstream from Itá dam) on which there might be other spawning sites. Regarding sampling layers, few significant differences were observed in the eggs and larvae captured in surface and bottom samples (Fig. 4 and 5; Tables 2 and 3).
Figure 4 - Average density and standard error for fish eggs captured in each sampling site at different sampling times and layers. Letters represent significant differences.
Braz. Arch. Biol. Technol. v.52 n. 4: pp. 933-944, July/Aug 2009
Spatial and Temporal Distribution of Ichthyoplankton
941
Figure 5 - Average density and standard error for fish larvae captured in each sampling site at different sampling times and layers (bottom = white squares; surface = black squares). Letters represent significant differences.
Table 2 - Results of factorial ANOVA applied to verify the influence of sampling time and layer on the densities of eggs captured at each sampling site. Factor Section Sampling site Time Layer Time × layer Ligeiro Main river 39.92* 1.87 0.33 Tributary 23.74* 0.68 0.37 Palomas Main river 9.46* 9.65* 1.16 Chapecó Main river 31.21* 0.28 0.53 Tributary 47.65* 4.32* 0.90 *P