Three Agricultural Landscapes of Southern Quebec,. Canada. RETO SCHMUCKI1. SYLVIE DE BLOIS*. ANDRE´ BOUCHARD. Institut de recherche en biologie ...
DOI: 10.1007/s00267-002-2704-9 RESEARCH Spatial and Temporal Dynamics of Hedgerows in Three Agricultural Landscapes of Southern Quebec, Canada RETO SCHMUCKI1 SYLVIE DE BLOIS* ANDRE´ BOUCHARD Institut de recherche en biologie ve´ge´tale Universite´ de Montre´al 4101 est, rue Sherbrooke Montre´al, Que´bec, H1X 2B2, Canada GE´RALD DOMON Faculte´ d’ame´nagement, Universite´ de Montre´al, C.P. 6128, Succursale Centre-Ville Montre´al, Que´bec, H3C 3J7, Canada ABSTRACT / Noncrop areas such as hedgerows in agricultural landscapes can perform several ecological and agronomic functions (e.g., habitat, movement corridors, windbreak, etc.), but their dynamics and drivers of changes are often poorly known. We conducted a study in three agricultural landscapes of southern Quebec, Canada, to assess and compare the spatial and temporal (1958 –1997) dynamics of three hedgerow networks in relation to geomorphic conditions
Management practices in agricultural landscapes are mostly directed toward maintaining agricultural production. There is an increasing awareness that such activities, if they are to be sustainable, should also take into account the preservation of ecological processes and biological diversity (Mineau and McLaughlin 1996, Craig and others 2000). There is, however, still much to learn about how to achieve conservation objectives in farm systems. In this respect, elements that can provide structural diversity in an otherwise relatively homogeneous landscape deserve particular attention (Thies KEY WORDS: Corridor; Field margin; Hedgerow network; Landscape dynamics; Noncrop habitat 1 R. Schmucki’s current address: Department of Plant Science, McGill University, Macdonald Campus, 21, 111 Lakeshore, Ste. Anne de Bellevue (Que´bec), H9X 3V9, Canada.
*Author to whom correspondence should be addressed at current address: Department of Plant Science, McGill University, Macdonald Campus, 21, 111 Lakeshore, Ste. Anne de Bellevue (Que´bec), H9X 3V9, Canada.
Environmental Management Vol. 30, No. 5, pp. 651– 664
(marine, glacial, and mixed deposit) and land-use changes. Hedgerow networks were mapped and described in terms of their structure (density, degree of connectivity, and presence of trees or shrubs) and their relationship to other components of the landscape (connection to woodland). Relationships were assessed in time and space using nonparametric correlation, Mantel test, and principal components analysis (PCA). Results show significant differences between hedgerow structure for the three landscapes and distinct temporal and spatial dynamics that can be related to changes in management practices and agricultural policies. On marine deposits, increases in hedgerow density did not always correspond to an increase in their degree of connectivity, suggesting a possible reduction in network quality. On glacial deposits, hedgerow density declined following abandonment of agricultural land, but rather than disappearing, these linear structures were integrated into adjacent brush or forested areas. Our analysis reveals the complex spatial and temporal dynamics of the hedgerow networks and highlights the need to take into account spatial attributes such as connectivity and connection to woodland to evaluate more accurately overall network quality.
and Tscharntke 1999). As such, uncultivated field margins, especially woody hedgerows, have been the object of several investigations because they are assumed to fulfill important ecological and agronomic functions (Forman and Baudry 1984, Baudry and others 2000). There is no doubt that they harbor a higher level of biodiversity than adjacent fields, providing at least temporary habitats for plant and animal species, some of which can be beneficial predators of agricultural pests (Dennis and Fry 1992, Bunce and others 1994, Marshall and Arnold 1995, Burel 1996, Jobin and others 1996, Petit and Usher 1998, McCollin and others 2000). Although this is still a matter of debate, there is also evidence that hedgerows may function as corridors connecting populations in remnant fragmented habitats (Fahrig and Merriam 1985, 1994, Fritz and Merriam 1993, Corbit and others 1999). Finally, hedgerows improve agricultural productivity by modifying climatic conditions in adjacent fields, by reducing soil erosion, and/or improving water quality and water regime (Kort 1988, Burel and Baudry 1995). ©
2002 Springer-Verlag New York Inc.
652
R. Schmucki and others
Changes in agricultural practices, their intensification, reduction, or the transformation of the nature of farming operations, often follow shifts in markets, technology, and policies (Paquette and Domon 1997, Pan and others 1999). The consequences are that land-use patterns are often modified in ways that have not always been well assessed in relation to the preservation of biological diversity and ecological processes (Bouchard and Domon 1997, de Blois and others 2001). Because, by definition, woody hedgerows are boundary structures that surround or separate fields, their dynamics and composition will likely depend on management practices in adjacent lots and on widespread changes in the whole landscape (Le Cœur and others 1997, Macdonald and Johnson 2000, de Blois and others 2002). In Europe, especially in France and England where scientific investigations of hedgerow dynamics have been extensively conducted, hedgerows have been an integral part of farming systems for centuries (Barr and Gillespie 2000, Baudry and others 2000, Oreszczyn and Lane 2000). They have usually been planted and are often managed for fuel or other needs. In agricultural landscapes of eastern North America, where the present study was conducted, hedgerows are most often the result of field margins and fences that were left uncultivated and are derived from natural recolonization by local plant species. Their composition and dynamics in this context are poorly known, most probably because they have not been given the same economic, ecological, and cultural importance that their European counterparts have received. They are often perceived by landowners as marginal structures that can become a nuisance when fields need to be widened or ditches need to be maintained. In an environmental management perspective that aims to integrate agricultural production and nature conservation, it becomes important to assess the factors that drive their dynamics. The present study was conducted in an agricultural area of southern Quebec, Canada, to assess and compare the spatial and temporal (1958 –1997) dynamics of three hedgerow networks in relation to geomorphic features and land-use changes. Because geomorphic features are a primary determinant of land-use patterns and land-use dynamics (Pan and others 1999) in our study area, we hypothesize that different landscape configurations would lead to distinct hedgerow dynamics. A previous study of the same territory showed little variation in the total area occupied by cultivated fields from 1958 to 1993, but revealed fluctuations in patch size and patch number that could have affected boundary structures (Pan and others 1999). Pastures were also abandoned during that period, and previously fallow
land reverted to forests through natural succession. All of these processes have occurred differentially according to environmental constraints related to the type of surface deposits and were likely to have influenced hedgerow dynamics.
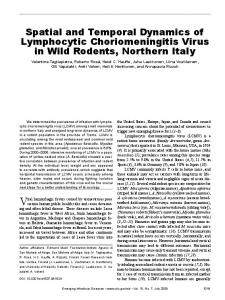
Methods Study Area The study area is located in Godmanchester, a rural municipality of 139 km2 within the Haut-St-Laurent region in the southernmost part of the Province of Quebec, Canada (Figure 1). The Haut-St-Laurent region has a humid continental climate with hot summers and cold winters. The mean annual temperature and total precipitation are, respectively, 6.5°C and 1006.9 mm for the years 1961–1990 (Huntingdon meteorological station). The mean temperature reaches a high of 21°C in July and a minimum of !9.5°C in January (Environment Canada 1993). The bedrock is composed of Beekmantown dolomite, which is the main element found in regional moraine deposits. The relief is mostly flat, with ridges and mounds of morainic deposits merging from the marine plain of clay deposits (Bariteau 1988). The Haut-St-Laurent region is located within the Maple–Bitternut Hickory Bioclimatic Domain (Ministe`re des Ressources naturelles du Que´ bec 1998), and the St. Lawrence Lowlands Ecoregion (Ecoregions Working Group 1989). Mesic forests are generally dominated by Acer saccharum Marsh, with subdominants such as Carya cordiformis (Wang.) K. Koch, Ostrya virginiana (Mill.) K. Koch., Tilia americana L., Fagus grandifolia (Ehrh.), and Tsuga canadensis (L. Carr). Following European settlement in the 19th century, the area was extensively exploited first for timber and then for agriculture (Simard and Bouchard 1996, Paquette and Domon 1997). Today, uncultivated vegetation patches are mostly confined to the numerous moraine islets and ridges of glacial origin, which are now generally considered unsuitable for intensive agriculture. Agricultural activities, especially dairy farming and grain and cereal production, are concentrated in the rich lowlands covered with marine clay deposits. Privately owned, the woodlands are often used as a source of firewood and/or as pasture for cattle (Domon and others 1993). Land-use dynamics in this area are typical of many other agricultural or semiagricultural landscapes in eastern North America. Historical patterns have resulted in usually long, narrow land parcels lying parallel to each other and perpendicular to the St. Lawrence River.
Hedgerows Dynamics in Agricultural Landscapes
653
Figure 1. Location of study area.
Using digitized geomorphic maps and land-use maps developed with SPANS GIS (Intera Tydac 1993) as a tool to conduct integrated ecological and landscape management studies in Godmanchester, we first delineated three characteristic landscape units (600 ha each; Figure 2) that differed by the spatial arrangement of their marine and glacial surface deposits and, consequently, in the intensity of agricultural use. The first unit, referred to hereafter as the clay plain landscape, is dominated by marine clay deposits of the Champlain sea. Agriculture is intensive with land being mostly cultivated for cash crops such as corn (Zea mays), which usually require high inputs of herbicides and fertilizers, as well as annual tillage. The second unit, referred to as the mixed landscape, is dominated by marine clay deposits, interspersed with islets of glacial deposits. The clay deposits are cultivated mostly for grains and cereals, whereas the glacial islets are left uncultivated. Finally the third unit, the glacial landscape, is dominated by continuous glacial deposits with a few pockets of peat. It is characterized by low agricultural intensity and shows a relatively continuous vegetation cover, with a few embedded fields generally used for fodder crops.
Noncrop vegetation patches include forest, brush, and pasture. Sampling We recorded data of three types in each of our landscape units: (1) geomorphic deposits, (2) type of land use, and (3) structure of hedgerow networks. Whereas the surface deposit is stable, the other two variables change in time. Data on land use and hedgerows were obtained from the interpretation of aerial photographs (black and white, 1:15,000) covering five years (1958, 1968, 1979, 1992, and 1997). The availability of aerial photographs and the quality of their resolution determined the time period. Data for 1997 were first obtained from field sampling done during the summer of 1997 and were subsequently mapped with aerial photos. Fieldwork allowed us to validate our photo-interpretation and to refine our knowledge of hedgerow conditions and dynamics. In order to reduce errors related to the interpretation of aerial photographs, land-use classes were limited to five (pasture, fodder crop, cereal crop, brush, and forest). Brush is composed of mostly shrubs and/or low
654
R. Schmucki and others
Figure 2. Geomorphic deposit types within Godmanschester and location of the three landscapes: (from left to right) clay plain, glacial, and mixed.
trees with no more than 20% tree cover. Hedgerows were categorized based on the height of the vegetation as being dominated by shrubs or trees. This categorization reflects habitat quality as well as disturbances related to management activities within the hedgerow. Our photo-interpretation allowed the production of maps (1:14,000) that represent land uses and the spatial structure of hedgerow networks for each of the three studied landscapes. All of these data were superimposed upon geomorphic maps obtained from the studies of Bariteau (1987, 1988). We sampled each of the three landscapes using plots distributed systematically (checkerboard pattern) on each series of maps (five maps per landscape type). The plots, each 4 ha (200 " 200 m) in area, were spaced every 200 m, a distance based on the average width of agricultural fields. Only plots that had hedgerow segments for at least one of the five sampled years were retained. In total, we sampled 51 plots in the clay plain landscape, 54 in the mixed landscape, and 39 in the glacial landscape. For each of the plots, the area covered by the various types of surface deposits (glacial, marine, and biogenic) and the area covered by the land-use types (pasture, fodder, cereals, brush, forest, others) were measured from pixels whose size (14 " 14 m # 196 m2) was determined in relation to the mapping scale (1:14,000). As for the hedgerow networks, they were characterized by four structural variables that were selected as potential indicators of the ecological functions that hedgerows are thought to accomplish in agricultural landscapes (Baudry and others 2000). First,
the density (meters per hectare) was calculated as the total length of hedgerows in each plot to evaluate the quantity of potential plant habitat (Corbit and others 1999, de Blois and others 2002), wildlife habitat (Burel 1992), or movement corridors (Bennett 1990, Merriam and Lanoue 1990, Bennett and others 1994). Next, the degree of connectivity (Burel and Baudry 1990; Riffell and Gutzwiller 1996) between the different hedgerows of the networks was calculated by attributing a numerical value to each intersection as a function of the number of links that it supports. This value reflects the movement potential offered by the network as it corresponds to the number of new directions that an organism can select at the intersection of several hedgerows, multiplied by the number of access ways leading to this structure. Hence, the value 2 is attributed to an Lshaped intersection linking two hedgerows, because it offers only one new direction and has two access ways. A T-shaped intersection linking three hedgerows receives a value of 6 (2 " 3), and a X-shaped intersection receives a value of 12 (3 " 4) (Burel and Baudry 1990). The number of connections to woodlands is a third structural variable measured that takes into account the physical links existing between hedgerow network and woodlands. By reducing the isolation of woodlands within agricultural landscapes, these connections may increase the survival rate of some animal or plant populations by facilitating movement between the different forest fragments (Fahrig and Merriam 1985, Bennett 1990). Finally, a distinction was made between shrubby hedgerows and hedgerows made up mostly of trees, in order to account for the dynamics and diversity of
655
Hedgerows Dynamics in Agricultural Landscapes
Table 1.
Structural characteristics of hedgerow networks for the three landscapes Year
Structural variables
Landscape
1958
1968
1979
1992
1997
Mean $ SD
Density (m/ha)
Clay plain Mixed Glacial Clay plain Mixed Glacial Clay plain Mixed Glacial Clay plain Mixed Glacial Clay plain Mixed Glacial
14.99 12.23 26.32 0.13 0.02 0.67 —a 0.04 0.12 39.31 48.09 41.49 60.69 51.91 58.51
18.33 14.28 28.33 0.12 0.03 0.63 —a 0.05 0.10 43.03 39.22 25.86 56.97 60.78 74.14
14.39 11.11 25.29 0.04 —a 0.52 —a 0.04 0.12 49.10 53.78 18.82 50.90 46.22 81.18
21.97 21.33 23.10 0.07 0.21 0.32 —a 0.05 0.12 79.49 73.63 29.90 20.51 26.37 70.10
23.88 17.45 22.77 0.04 0.20 0.45 —a 0.05 0.11 44.10 58.29 21.72 55.90 41.71 78.28
18.71 $ 4.18 15.28 $ 4.15 25.16 $ 2.31 0.08 $ 0.04 0.12 $ 0.10 0.52 $ 0.14 —a 0.05 $ 0.01 0.11 $ 0.01 51.01 $ 16.30 54.60 $ 12.80 27.56 $ 8.84 48.99 $ 16.30 45.40 $ 12.80 72.44 $ 8.84
Degree of connectivity/ha Number of connections to woodlands/ha Proportion of shrubby hedgerows (%) Proportion of tree hedgerows (%)
a
Value %0.005.
available habitats and different levels of soil protection (Bennett and others 1994, Best and others 1995, Choinie`re and Be´ langer 1995, de Blois and others 2002). Note that the width of hedgerows in this landscape usually ranges from 5 to 12 m, whereas woodlands are usually !1 ha (de Blois and others 2002). Data Analysis The data on total length, degree of connectivity, and number of connections with woodlands were adjusted by hectare in order to compare the networks of the three landscapes. The shrub- or tree-dominated hedgerows were described as a proportion of total length. Based on values obtained for the five sampled years and each of the three different landscapes, comparisons were made using analysis of variance with single criterion of classification (Kruskal-Wallis). The relationships between the density of hedgerow networks and their degree of connectivity were examined using rank correlation (Kendall’s coefficient). A modified Bonferroni procedure was used to adjust levels of significance to take into account multiple testing [Holm procedure (Holm 1979)]. Relationships between land use and surface deposit patterns were measured using Mantel’s (1967) test, for each of the five years sampled, by grouping the sample plots of the three landscapes. In order to do this, similarity matrices were calculated from land-use and surface deposit data using Gower’s (1971) similarity coefficient. These calculations were done using the R statistical package (Legendre and Vaudor 1991). Principal components analyses (PCAs) (SAS Institute 1996) were done to express the relationships between hedg-
erow network dynamics and land use. This type of analysis allows a representation of relationships between objects in a two-dimensional space while preserving the Euclidean distance between them. Results are displayed using two-dimensional ordinations (Gabriel 1971), where the descriptors are represented by orthonormal vectors and objects are represented by points. In order to illustrate land-use dynamics in each of the landscapes, a curve was drawn linking the centroids of each sampled date (1958, 1968, 1979, 1992 and 1997) on the PCA ordinations. Finally, the variations in the density of hedgerow networks were calculated for the four time intervals studied: 1958 –1968, 1968 –1979, 1979 –1992, and 1992–1997. Each sample plot was characterized as having had an increase or a reduction in hedgerow density during the reference period. The centroids of these groups of sample plots were plotted on the PCA ordinations to evaluate the influence of land-use changes on hedgerow density.
Results Temporal and Spatial Variation in Structural Characteristics The structural characteristics of the hedgerow networks are significantly different between the three sampled landscapes, and this is true for the entire time period (Table 1). The networks of the glacial, mixed, and clay plain landscapes are different in terms of their density (H " 9.38; P " 0.0092), their degree of connectivity (H " 9.52; P " 0.0086), their number of connections to woodlands (H " 13.18; P " 0.0014),
656
R. Schmucki and others
Table 2. Rank correlations between hedgerows density and their degree of connectivity Year Landscape Clay plain Mixed Glacial
1958 0.3577 0.2283 0.5731a
1968 a
0.5101 0.1704 0.7281a
1979
1992
1997
0.2225 — 0.7086a
0.2571 0.5338a 0.6106a
0.1541 0.4657a 0.5200a
a
Significant relationship at the Holm-corrected probability level for an overall probability level of 0.05.
and in the proportion of shrub versus tree hedgerows (H " 8.06; P " 0.0178). These differences are particularly important between the networks of the glacial landscapes and those of the mixed and clay plain landscapes. Contrary to those of the mixed and clay plain landscapes, the degree of connectivity of the hedgerow network of the glacial landscape is significantly correlated to the density of the network for each of the years analyzed (Table 2). This relationship, when significant, is weaker in the mixed and clay plain landscapes. For the clay plain landscape, this relationship is considerably reduced after 1979. For the mixed landscape, there is an increase in the link between the density of the hedgerow networks and the degree of connectivity after 1979. With respect to the dynamics of hedgerow networks, three broad time periods can be identified (Table 1). Whereas other structural characteristics of the networks show large variations during these periods, the number of connections with woodlands remains constant in each of the landscapes. Extending from 1958 to 1968, the first period is characterized for each landscape by increases in density and relatively stable degrees of connectivity. However, as opposed to those of the clay plain landscapes, hedgerows of the mixed and glacial landscapes showed increases in the proportion of hedgerows dominated by trees. The second period, between 1968 and 1979, is characterized by decreases in the densities of hedgerows in all landscapes, accompanied by decreases in the degree of connectivity. Table 1 shows that the decreases in density coincide, for mixed and clay plain landscapes, with decreases in the proportion of hedgerows with trees. The third period extends from 1979 to 1997. It is characterized by major fluctuations that clearly differentiate the hedgerow networks of the three landscapes. During this period, the hedgerow networks of the clay plain had an increase in density of 66%, whereas in the mixed landscape an increase of 92% occurred between
1979 and 1992, but was followed by a decrease of 18% between 1992 and 1997. The glacial landscape had an almost constant decrease (10%) of hedgerow network density during this period (Table 1). These changes in density were accompanied by a decrease in the degree of connectivity only in the glacial landscape, the mixed and the clay plain landscapes remaining relatively stable in this respect (Table 1). Moreover, in 1992 more than 70% of hedgerows found in the clay plain and the mixed landscapes were shrubby hedgerows (Table 1). Land-Use Dynamics Besides cyclic changes due to crop rotations, the agricultural and forest mosaics of the three landscapes have undergone substantial transformations of their land-use patterns (Table 3). However, the dynamics involved differ considerably among the three landscapes. On the clay plain, the transformation essentially affected agricultural land uses. Between 1958 and 1979, more than half of the cultivated areas was devoted to fodder crops; these were largely replaced after 1979 by cereal crops, which occupied more than half of the sampled agricultural area in 1992. The areas allocated to pasture fluctuated between 1958 and 1979, but decreased considerably in 1997, whereas nonagricultural land (forest, brush), occupying smaller areas, remained relatively unchanged. In contrast to the clay plain, the mixed landscape had major changes occurring in each type of land use (Table 3). Thus, after increasing between 1958 and 1979, fodder crop areas decreased considerably in 1992, whereas cereal crops increased markedly after 1979. Pasture areas decreased considerably in between 1958 and 1997, and nonagricultural land-use areas (brush and forest) expanded considerably, going from 9% of the total area in 1958 to more than 20% in 1997. In the glacial landscape, the transformation also affected all of the land uses (Table 3). As in both preceding cases, the proportion of areas used for fodder crops greatly diminished between 1979 and 1997, whereas areas used for cereal crops increased between 1969 and 1997. Occupying close to 10% of sampled areas in 1958, 1979, and 1997, the pasture areas had an increase between 1958 and 1968, followed by a decrease in between 1968 and 1992. Finally, the areas occupied by brush increased considerably in between 1968 and 1997, whereas the forested areas increased less markedly. The Mantel test results shown in Table 4 indicate that land-use patterns are significantly (P " 0.001) associated with the type and configuration of surface
Hedgerows Dynamics in Agricultural Landscapes
Table 3.
657
Proportion (%) of area occupied by different land uses adjacent to hedgerows Year
Land use
Landscape
1958
1968
1979
1992
1997
Pasture
Clay plain Mixed Glacial Clay plain Mixed Glacial Clay plain Mixed Glacial Clay plain Mixed Glacial Clay plain Mixed Glacial Clay plain Mixed Glacial
8.65 19.81 10.89 72.44 53.21 43.71 7.95 11.90 0.35 0.60 0.41 1.88 —a 8.78 28.48 10.36 5.89 14.69
1.12 6.26 19.96 71.81 62.04 41.70 15.61 10.04 1.84 0.54 1.69 0.52 —a 11.98 24.16 10.91 7.99 11.81
10.78 7.98 11.07 68.24 62.70 47.56 7.25 8.09 —a 0.38 1.53 1.44 —a 11.65 28.81 13.36 8.05 11.11
6.06 7.30 5.79 20.44 12.66 40.20 59.93 57.62 4.28 0.62 — 3.93 —a 13.16 34.90 12.95 9.26 10.91
2.35 2.42 10.70 35.60 24.80 26.14 49.16 39.72 9.29 1.75 4.28 14.40 —a 18.84 30.18 11.14 9.94 9.29
Fodder crops Cereal crops Brush Forest Other
a
Value %0.005.
Table 4. Mantel statistics between land uses and geomorphic surface deposit similarity matrices (P # 0.001) Year
R
1958 1968 1979 1992 1997
0.20 0.25 0.20 0.43 0.35
deposits for each of the sampled periods. This relationship tends to increase between 1958 and 1997. Relationship Between Land-Use Patterns and Changes in Density of Hedgerow Networks The PCAs (Figures 3–5), which illustrate land-use pattern dynamics, reveal two distinct periods (1958 – 1979 and 1979 –1997) for the mixed and clay plain landscapes. This distinction is also seen, but much less markedly, in the glacial landscape. The PCA ordinations of the three landscapes also show the complex relationships, varying spatially and temporally, between land-use and changes in the density of hedgerow networks. For the clay plain landscape, the PCA expresses 74% of the variance of the land-use matrix (Figure 3). The centroids of the sample plots from 1958, 1968, and 1979 are located in the negative half of the first axis, and thus appear strongly associated with fodder crop
production. The centroids of the sample plots from 1992 and 1997 are positioned toward the positive extreme of the first axis, which is strongly correlated with cereal production. As for the changes in hedgerow density, the analyses reveal two different trends among the sample plots showing decreases. During the periods 1958 –1968, 1968 –1979, and 1979 –1992, these plots were associated with large areas under fodder production. However, between 1992 and 1997, the plots were more frequently associated with cereal production areas. As for sample plots that had increases in hedgerow density, they were associated between 1968 and 1992 with a combination of pastures and fodder crops; between 1958 and 1969 with fodder crop production, and finally, in between 1992 and 1997 with cereal crop production. For the mixed landscape, the ordination, which expresses 59% of the variance contained in the land-use matrix (Figure 4), has a similar structure to that obtained for the clay plain landscape (Figure 3). Thus, the first axis of the PCA very clearly separates the centroids of the years 1958, 1968, and 1979, from those of 1992 and 1997. The centroids of the sample plots showing decreases in hedgerow density are associated with pastures between 1958 and 1968, with fodder production between 1968 and 1992, and with cereal production between 1992 and 1997. As for those sample plots that had increases in hedgerow density between 1958 and 1968, as well as between 1979 and 1992, they are associated with fodder production. Other time intervals are not as strongly linked to a particular land-use type.
658
R. Schmucki and others
Figure 3. Principal component analysis of land-use dynamics for the clay plain landscape showing increases and decreases in hedgerow density for each time period. Centroids have been linked to illustrate land-use changes.
For the glacial landscape, the PCA ordination expresses 58% of the variance of the land-use matrix (Figure 5). As opposed to the two other landscapes, the centroids of the sample plots from 1958, 1968, 1979, and 1992 are not segregated into two distinct periods. Only the 1997 centroid stands out from the others, by being associated with an increase in forested areas, cereal production, and abandoned land returning to brush. For the period between 1958 and 1992, the sample plots that had decreases in hedgerow density are associated with large areas of fodder crops, whereas between 1992 and 1997, they are mostly associated with forested areas. Sample plots that have increases in hedgerow density between 1958 and 1992 are associated with pasture areas.
Discussion The three landscapes differ by the nature and configuration of their surface deposits. Our results indicate that this heterogeneity exerts a considerable influence on land-use patterns and land-use changes and consequently regulate the structuring of hedgerow networks (Figure 6). Hedgerows, here, as is often the case in
agricultural landscapes of northeast America, originated from the natural encroachment of noncultivated margins between agricultural parcels. During the period investigated, these margins have been constantly subjected to disturbances linked to changes in agricultural practices, which have varied in nature and intensity according to the type of landscape and time period considered. Consequently, the hedgerow networks of each of these landscapes show clear structural differences and distinct temporal dynamics that can be linked to the evolution of the context of agricultural exploitation. In the following sections, we will discuss the temporal dynamics that have occurred, comparing and contrasting the three networks in relation to the processes that have produced the structural patterns observed. Landscape and Hedgerow Dynamics Prior to 1958 In 1958, all three landscapes had hedgerow networks that were already clearly distinct in terms of their density and their degree of connectivity. Although tree hedgerows dominated in all three landscapes in 1958, the hedgerow networks of the mixed and clay plain landscapes had low densities with very few connections,
Hedgerows Dynamics in Agricultural Landscapes
659
Figure 4. Principal component analysis of land-use dynamics for the mixed landscape showing increases and decreases in hedgerow density for each time period. Centroids have been linked to illustrate land-use changes.
whereas hedgerows in the glacial landscape were denser and very highly connected among each other and with the woodlands. These patterns have their origin in the changes in agricultural management practices that began in the first half of the 20th century. In the study area, agricultural development initially took place in the 19th century at a pace and at an intensity that did not vary much according to the nature of the surface deposit (Paquette and Domon 1997). Historical data from this period indeed suggest that, prior to agricultural intensification, the three landscapes most likely showed similar land-use patterns, characterized by diverse agricultural practices occurring in small parcels (Se´ guin 1980, Paquette and Domon 1997). During the first half of the 20th century, Quebec farms switched to a more intensive and mechanized type of agriculture. This agricultural intensification and mechanization has not occurred equally over the whole study area, the clay soils of the mixed and clay plain landscapes offering better potential for intensive crops (Pan and others 1999). Merging of parcels and more homogeneous practices in these two landscapes have resulted in the structural characteristics observed (low densities, few connections). Changes
were likely less drastic in the glacial landscape, where hedgerows originated along stone fences that were built when the land was cleared for agriculture. These structures are far more stable, as considerable investment is required to eliminate them. Consequently, hedgerows in this landscape in 1958 are still dense and very highly connected among each other and with the woodlands compared to the other landscapes. Stabilization of Field Margins: 1958 –1968 Between 1958 and 1968, the density of hedgerow networks considerably increased in each landscape (Table 1). In the mixed and clay plain landscapes, increases were generally associated with sample plots that showed large areas of fodder crop production (Figures 3 and 4). They coincide with an increase in animal and crop production that was facilitated at the time by an increase in the use of inorganic fertilizers and pesticides. Our results suggest that more intense agricultural practices and the use of fertilizers in the agricultural matrix may have contributed to reduce exploitation pressure on the margins of fields (e.g., humid areas adjacent to ditches), therefore allowing their stabilization (Jobin and others 1997).
660
R. Schmucki and others
Figure 5. Principal component analysis of land-use dynamics for the glacial landscape showing increases and decreases in hedgerow density for each time period. Centroids have been linked to illustrate land-use changes.
Figure 6. Schematic representation of the relationship between surface deposits, land uses, and hedgerows networks.
From a spatial point of view, however, increases in the density of hedgerow networks during this period did not result, as we might have expected, in a corresponding increase in the degree of connectivity. The presence of transverse hedgerows generally separating different crops on the same property strongly influences the degree of connectivity of the networks (Fig-
ure 7). The observed increase was more in the number of parallel hedgerows rather than of transverse hedgerows. Such patterns, while contributing to increase the proportion of available habitats in the landscape, may result in lower network quality and greater habitat isolation, the ecological consequences of which remains to be assessed in agricultural landscape.
Hedgerows Dynamics in Agricultural Landscapes
661
Figure 7. Schematic representation of hedgerow network dynamics for the three landscapes.
Decrease in Density and Connectivity: 1968 –1979 During the period between 1968 and 1979, hedgerow networks of the three landscapes underwent important transformations. These transformations resulted in general decreases in the density of hedgerow network, and in large reductions in the degrees of connectivity for the mixed and clay plain landscapes. Decreases in the proportion of hedgerows with trees were also observed in these two landscapes. In the glacial landscape, the hedgerow networks remained predominantly (81%) made up of hedgerows with trees. The hedgerow networks of this landscape, therefore, were subjected to disturbances different from those encountered on marine deposits. As shown by PCAs, the decreases in hedgerow density measured between 1968 and 1979 in the mixed and clay plain landscapes are strongly associated with fodder production. These decreases are closely linked to the profound changes that have marked the context of agricultural exploitation during the 1970s and the beginning of the 1980s. Quebec’s agriculture, which was heavily oriented towards milk production [70% of all Quebec farm producers in 1971 (Statistiques Canada 1971)], was confronted at the beginning of the 1970s with the saturation of milk markets. This situation, coupled with a constant increase in farm productivity, had the effect of provoking a major production crisis (De´ bailleul and Erhensaft 1987).
In these circumstances, the conversion of milk farms (requiring large areas of fodder crops) into cereal crop farms was strongly encouraged by agricultural policies (Domon and others 1993). However, because of climatic constraints (short growing season), this conversion required an improvement of drainage conditions to accelerate soil drainage in spring to make earlier seeding possible. In order to achieve this, policies were launched to encourage the installation of underground drainage systems, the straightening of streams, and the maintenance of drainage ditches. These actions generated considerable investments throughout the 1970s and the early 1980s, reaching a maximum in 1977. They also led to a spectacular increase in areas of corn (Zea mays) cultivation; 43,000 ha in 1973 vs 180,000 in 1983 (Domon and others 1993). The period (1968 –1979) for which we observed a marked decrease in the density and degrees of connectivity of hedgerow networks therefore corresponds to an intense period of conversion of milk farms that also resulted in a reduction in the number of producers and an increase in the average size of farm holdings (Statistique Canada 1997). These changes were reflected in an enlargement of cultivated fields and the elimination of some of their surrounding hedgerows. Furthermore, the reduction in the degrees of connectivity of the networks suggests that the eliminated hedgerows were generally transverse hedgerows connecting with other hedgerows (Figure 7).
662
R. Schmucki and others
As opposed to landscapes with a high agricultural potential (mixed and clay plain landscapes), the reduction in densities and degrees of connectivity of the hedgerow networks of the glacial landscape appears to be linked instead to the abandonment of several agricultural fields between 1968 and 1979 (Figure 7). Indeed, the results show an increase in areas occupied by brush and forest (Table 3), an increase that had, as a consequence, the incorporation of hedgerows into brush and forests developing on the abandoned agricultural fields. These transformations were also observed in the mixed landscape, where some agricultural fields (mostly pastures) located on islets of glacial deposits were abandoned in between 1958 and 1979. In summary, the decreases in density of the hedgerow networks of the mixed and clay plain landscapes for the period 1968 –1979 is closely linked to an intensification of agricultural practices, whereas in the glacial landscape, the decreases were instead linked to the invasion of abandoned fields by brush and forest. The ecological consequences of these dynamics are evidently very different. In the first case, the disappearance of hedgerows caused a loss of habitats and possibly reduced corridor function for the movements of species in the agricultural landscape (Bennett and others 1994), whereas in the second case, we observed an assimilation of the hedgerows into forest fragments. Recovery of Hedgerows: 1979 –1997 The densities of hedgerow networks of the mixed and clay plain landscapes have considerably increased during the 1980s and 1990s (Table 1). After the profound transformation in farm management that reached its peak at the beginning of the 1980s (Domon and others 1993), the stabilization of agricultural practices allowed natural successional processes to go on at field margins. Reinvasion by natural vegetation has produced, in 1992, large increases in the proportion of shrubby hedgerows, which were starting to grow into tree hedgerows in 1997. During this period, the hedgerow networks of the glacial landscape continued to undergo decreases in their density and their degree of connectivity. These transformations are still associated with decreases in agricultural areas and increases in brush and forest areas, and thus correspond to an assimilation of hedgerows into nonagricultural land uses. In fact, on the glacial surface deposits, agricultural activities seem to be declining, with decreases in fodder crop areas corresponding to increases in brush areas.
Conclusions Our three landscape units represent a gradient of agricultural intensification in space and time that is typical of many areas where agriculture developed on previously forested soil in eastern North America. Changes in the nature and intensity of agricultural practices, as constrained by the physical environment, have clearly driven changes in the spatial characteristic of hedgerow networks. As a result, the hedgerow networks of the clay plain, the mixed, and the glacial landscapes developed in very different ways during the second half of the 20th century. Contrary to the conclusions of some European studies (Braekevelt 1988, Burel and Baudry 1990), the hedgerows of our study area have not been affected by a uniform decline during the second half of the 20th century. If, in Southern France, the “remembrement” program has profoundly influenced the delimitation of agricultural fields for entire regions (Burel and Baudry 1990), in Quebec, it is the intensification of cereal crop production, its concentration on clay soils, and the subsequent modification of drainage patterns as supported by government incentives that have shaped agricultural fields and adjacent habitats. As a result, for the time period considered, it is more the spatial arrangement of hedgerows than their density that has changed. In areas of agricultural intensification, hedgerow density fluctuates as transverse hedgerows are lost, new drainage ditches are built, and field margins are intensively managed and then allowed to stabilize for some time. These fluctuations are likely to have an impact on the quality of available habitats (decrease in connectivity, shrub versus stable tree hedgerow). In areas of agricultural marginalization, hedgerows become incorporated into nascent brush and forests developing in adjacent parcels. They may serve as sources of seeds for forest species and therefore contribute to accelerate the consolidation of forested areas in regions undergoing agricultural abandonment or facilitate the movement of forest species in fragmented landscape (Corbit and Gardescu 1999, de Blois and others 2002). Our findings highlight the importance of taking into account parameters other than density alone in order to adequately analyze hedgerow networks and their evolution. For instance, there is not necessarily a correlation between the degree of connectivity and changes in the density of hedgerow networks. Although the ecological significance of the connectivity parameter remains to be clarified, its inclusion at least provides a more spatially accurate picture of the development of hedgerow networks. Other methodologies also need to
Hedgerows Dynamics in Agricultural Landscapes
663
be explored to improve our evaluation of the fine-scale spatial dynamics of linear landscape structures. Finally, hedgerows as potential habitats in this territory occupy essentially residual agricultural spaces. The future conservation and management of these linear units for the protection of biodiversity, soil quality, or water quality in agricultural areas must take into account the processes that drive their dynamics. As our study shows, changes in agricultural policies and their implementation as constrained by the physical environment can have a large impact on the quantity and spatial characteristics of noncrop land in agricultural landscapes. Yet, the ecological consequences of such policies outside of the agricultural matrix are rarely taken into account. Only by evaluating the resulting patterns both at the field and landscape scale will we be able to devise better production and conservation strategies that will ensure the overall sustainability of our agricultural landscapes.
Burel, F. 1992. Effect of landscape structure and dynamics on species diversity in hedgerow networks. Landscape Ecology 6:161–174.
Acknowledgments
Burel, F. 1996. Hedgerows and their Role in agricultural Landscapes. Critical Reviews in Plant Sciences 15(2):169 –190.
We thank J. Gerwein and H. B. Tirion for their critical and constructive comments on earlier versions of the manuscript. This work was funded by a FCAR grant to A. Bouchard and G. Domon.
Literature Cited Bariteau, L. 1987. Haut-Saint-Laurent: e´ cologie et ame´ nagement, carte ge´ omorphologique, feuillet I. Carte a` 1/20 000 de Cazaville (feuille no. 31 g 01-200-0101). Centre de recherches e´ cologique de Montre´ al (CREM), Universite´ de Montre´ al. Bariteau, L. 1988. La cartographie ge´ omorphologique au 1:20 000 de mode`les polyge´ niques: un exemple des basses terres du Saint-Laurent. MSc thesis. Universite´ de Montre´ al, 185 pp. and appendix. Barr, C. J., and M. K. Gillespie. 2000. Estimating hedgerow length and pattern characteristics in Great Britain using Countryside Survey data. Journal of Environmental Management 60:23–32. Baudry, J., R. G. H. Bunce, and F. Burel. 2000. Hedgerow: an international perspective on their origin, function and management. Journal of Environmental Management 60:7–22. Bennett, A. F. 1990. Habitat corridors and the conservation of small mammals in a fragmented forest environment. Landscape Ecology 4:109 –122. Bennett, A. F., G. Merriam, and K. Henein. 1994. Corridor use and the elements of corridor quality: chipmunks and fencerows in a farmland mosaic. Biological Conservation 68: 155–165. Best, L. B., K. E. Freemark, J. J. Dinsmore, and M. Camp. 1995. A review and synthesis of habitat use by breeding birds in agricultural landscapes of Iowa. The American Midland Naturalist 134:1–29.
Bouchard, A., and G. Domon. 1997. The transformations of the natural landscapes of the Haut-Saint-Laurent (Quebec) and their implications on future resource management. Landscape and Urban Planning 37:99 –107. Braekevelt, A. 1988. Evolution of the spatial structure of the hedgerow in the Hautland (NW Belgium). Pages 153–161 in K. F. Schreiber (ed.), Connectivity in landscape ecology. Proceedings of the 2nd international seminar of the International Association for Landscape Ecology. Mu¨ nstersche Geographische Arbeiten 29, Mu¨nster. Bunce, R. G. H., D. C. Howard, C. J. Barr, R. C. Cummins, and D. French. 1994. Botanical diversity in British hedgerows. Pages 43–52 in N. Boatman (ed.), Field margins integrating agriculture and conservation. Proceeding of a symposium organized by the British Crop Protection Council in association with the British Ecological Society and the Association of Applied Biologist and held at the University of Warwick, Coventry on 18 –20 April 1994. British Crop Protection Council, Farnham.
Burel, F., and J. Baudry. 1990. Structural dynamic of a hedgerow network landscape in Brittany, France. Landscape Ecology 4(4):197–210. Burel, F., and J. Baudry. 1995. Social, aesthetical and ecological aspects of hedgerows in rural landscapes as a framework for greenways. Landscape and Urban planning 33(1–3):327– 340. Choinie`re, L., and L. Be´ langer. 1995. Fre´ quentation des haies brise-vent par la faune aviaire en milieu agricole et perspectives d’inte´ gration faune-agriculture. Service canadien de la faune, Re´ gion du Que´ bec. Se´ rie de rapports techniques (Service canadian de la faune) no. 239. Sainte-Foy, Quebec. Corbit M., P. L. Marks, and S. Gardescu. 1999. Hedgerows as habitat corridors for forest herbs in central New York, USA. Journal of Ecology 87(2):220 –232. Craig, J., N. Mitchell, and D. A. Saunders. 2000. Nature conservation in production environments: managing the matrix (1997: Taupo, New Zeland). Surrey Beatty and Sons, Chipping Norton, New South Wales, 712 pp. De´ bailleul, G., and P. Erhensaft. 1987. Crise de l’agriculture et de la politique agricole ame´ ricaine. Cahiers de recherche sociologique 5(1):125–156. de Blois, S., G. Domon, and A. Bouchard. 2001. Environmental, historical and contextual determinants of vegetation cover: a landscape perspective. Landscape Ecology 16:421– 436. de Blois, S., G. Domon, and A. Bouchard. 2002. Factors affecting plant species distribution in hedgerows of southern Quebec. Biological Conservation 105:355–367. Dennis, P., and G. L. A. Fry. 1992. Field margins: can they enhance natural enemy population densities and general arthropod diversity on farmland. Agricultural, Ecosystems & Environment 40:95–115. Domon, G., A. Bouchard, and M. Garie´ py. 1993. The dynamics of the forest landscape of Haut-Saint-Laurent (Quebec,
664
R. Schmucki and others
Canada): interactions between biophysical factors, perceptions and policy. Landscape and Urban Planning 25:53–74. Ecoregions Working Group. 1989. Ecoclimatic regions of Canada: first approximation. Committee on Ecological Land Classification, Canada (final complilation of the report, W. Strong and S. C. Zoltai). Sustainable Development Branch, Canadian Wildlife Service, Conservation and Protection, Environment Canada, Ottawa. 119 pp. and map at 1:7,500,000. Environment Canada. 1993. Climate normals 1961–1990. Canadian climate program. Environment Canada. Atmospheric Environment Service, Downsview, Ontario, 157 pp. Fahrig, L., and G. Merriam. 1985. Habitat patch connectivity and population survival. Ecology 66:1762–1768. Fahrig, L., and G. Merriam. 1994. Conservation of fragmented populations. Conservation Biology 8:50 –59. Forman, R. T. T., and J. Baudry. 1984. Hedgerows and hedgerow networks in landscape ecology. Environmental Management 8:499 –510. Fritz, R., and G. Merriam. 1993. Fencerow habitats for plants moving between farmland forests. Biological Conservation 64: 141–148. Gabriel, K. R. 1971. The biplot graphic display of matrices with application to principal component analysis. Biometrika 58:453– 467. Gower, J. C. 1971. A general coefficient of similarity and some of its properties. Biometrics 27:857– 871. Holm, S. 1979. A simple sequentially rejective multiple tests procedure. Scandinavian Journal of Statistics 6:65–70. Intera Tydac. 1993. SPANS. Spatial analysis system reference manual, version 5.2., Nepean, Ontario, Canada. Jobin, B., C. Boutin, and J.-L. DesGranges. 1996. Habitats fauniques du milieu rural que´ be´ cois: une analyse floristique. Canadian Journal of Botany 74:323–336. Jobin, B., C. Boutin, and J.-L. DesGranges. 1997. Effects of agricultural practices on the flora of hedgerows and woodland edges in Southern Quebec. Canadian Journal of Plant Sciences 77:293–299. Kort, J. 1988. Benefits of windbreaks to field and forage crops. Agriculture, Ecosystems & Environment 22–23:165–190. Le Cœur, D., J. Baudry, and F. Burel. 1997. Field margins, plant assemblages: variation partitioning between local and landscape factors. Landscape and Urban Planning 37:57–71. Legendre, P., and A. Vaudor. 1991. Le progiciel R—analyse multidimensionnelle, analyse spatiale. De´ partement de sciences biologiques, Universite´ de Montre´ al, Montreal. iv & 144 pp. Macdonald, D. W., and P. J. Johnson. 2000. Farmers and the custody of the countryside: trends in loss and conservation of non-productive habitats 1981–1998. Biological Conservation 94:221–234. Mantel, N. 1967. The detection of disease clustering and a generalized regression approach. Cancer Research 27:209 – 220.
Marshall, E. J. P., and G. M. Arnold. 1995. Factors affecting field weed and field margin flora on a farm in Essex. Landscape and Urban Planning 31:205–216. McCollin, D., J. Jackson, R. G. H. Bunce, C. J. Barr, and R. Stuart. 2000. Hedgerows as habitat for woodland plants. Journal of Environmental Management 60:77–90. Merriam, G., and A. Lanoue. 1990. Corridor use by small mammals: Field measurements for the three experimental types of Peromyscus leucopus. Landscape Ecology 4:123–131. Mineau, P., and A. McLaughlin. 1996. Conservation of biodiversity within canadian agricultural landscape integrating habitat for wildlife. Journal of Agricultural and Environmental Ethics 9:93–113. Ministe`re des Ressources naturelles du Que´ bec. 1998. Domaines et sous-domaines bioclimatiques du Que´ bec. Comite´ sur la carte des re´ gions e´ cologiques (3e version). Online document: www.mrn.gouv.qc.ca/3/30/300/zones_vegetation/zone_vege.asp. Oreszczyn, S., and A. Lane. 2000. The meaning of hedgerows in the English landscape: Different stakeholder perspectives and the implications for future hedge management. Journal of Environmental Management 60:101–118. Pan, D., G. Domon, S. de Blois, and A. Bouchard. 1999. Temporal (1958 –1993) and spatial patterns of land use changes in Haut-Saint-Laurent (Quebec, Canada) and their relation to landscape physical attributes. Landscape Ecology 14:35–52. Paquette, S., and G. Domon. 1997. The transformation of the agroforestry landscape in nineteenth century: a case study. Landscape and Urban Planning 37:197–209. Petit, S., and M. B. Usher. 1998. Biodiversity in agricultural landscapes: the ground beetle communities of woody uncultivated habitats. Biodiversity and Conservation 7:1549 –1561. Riffell, S. K., and K. J. Gutzwiller. 1996. Plant-species richness in corridor intersections: is intersection shape influential? Landscape Ecology 11(3):157–168. SAS Institute. 1996. JMP start statistics: a guide to statistical and data analysis using JMP and JMP IN software. Wadsworth Thomson Publishing, Belmont, California, 521 pp. Se´ guin, N. 1980. Agriculture et colonisation au Que´ bec: aspects historiques. Bore´ al Express, Montreal, 220 pp. Simard, H., and A. Bouchard. 1996. The precolonial 19th century forest of the Upper St. Lawrence region of Quebec: a record of its exploitation and transformations through notary deeds of woods sales. Canadian Journal of Forestery Research 26:1670 –1676. Statistique Canada. 1971. Agriculture Que´ bec. Recensement du Canada, 1971. Catalogue No. 96-706. Bureau fe´ de´ ral de la Statistique, Ottawa. Statistique Canada. 1997. Aperc¸ u historique de l’agriculture canadienne, Catalogue 93-358-XPB, Ottawa. Thies, C., and T. Tscharntke. 1999. Landscape structure and biological control in agroecosystems. Science 285(5429): 893– 895.