spatial and temporal trends of white-tailed deer across Ohio and to relate these patterns to the formerly ...... economic effects of deer collisions are enormous.
The Ohio State University Knowledge Bank
kb.osu.edu
Ohio Journal of Science (Ohio Academy of Science)
Ohio Journal of Science: Volume 99, Issue 4 (September, 1999)
1999-09
Spatial and Temporal Trends of Deer Harvest and Deer-Vehicle Accidents in Ohio Iverson, Aaron L.; Iverson, Louis R. The Ohio Journal of Science. v99, n4 (September, 1999), 84-94 http://hdl.handle.net/1811/23828 Downloaded from the Knowledge Bank, The Ohio State University's institutional repository
Spatial and Temporal Trends of Deer Harvest and Deer-Vehicle Accidents in Ohio1 AARON L. IVERSON AND LOUIS R. IVF.RSON, Buckeye Valley High School, Delaware, OH 43015 and USDA Forest Service, Delaware County, Delaware, OH 43015
ABSTRACT. White-tailed deer (Odocoileus virginianus} have been increasing dramatically in the eastern United States, with concomitant increases in impacts resulting from deer browsing and deer-vehicle collisions. In Ohio, the number of deer were estimated at near zero in 1940 to over 450,000 in 1995. We analyzed estimates of deer harvest and deer-vehicle collisions in 1995 for 88 counties in Ohio. These data were also related to county-level spatial data on the length of major highways, urban land, rural land, crop land, forest land, all land, and human population. The objectives of this study were to evaluate the spatial and temporal trends of white-tailed deer across Ohio and to relate these patterns to the formerly mentioned environmental and human variables. For 1995 data, positive relationships existed between the amount of urban land in the county versus the number of deer-vehicle collisions, the amount of forest land in the county versus the number of deer harvested, the human population of a county versus the number of deer-vehicle collisions, and the length of major highways in a county versus the number of deer-vehicle collisions. Negative relationships existed between the amount of crop land in a county versus the number of deer harvested, the amount of crop land versus the number of deer-vehicle collisions, and the amount of urban land versus the number of deer harvested. Nine counties, representing various levels of land-use and human population tendencies, were analyzed for historic trends in deer harvest (19851995) and deer-vehicle collisions (1988-1995); in each case, there were substantial rises over the previous decade. Extensions of the resulting regression lines show the possibility for continued increases in deervehicle collisions, especially those with a high human population and forest cover. The dramatic increases in deer populations can be attributed to increasing forest land in the state, more habitat of shrubby land, few predators, mild winters, and the deer's ability to adapt to human-inhabited environments.
OHIO J SCI 99 (4): 84-94, 1999
INTRODUCTION Deer overabundance is one of the most challenging problems facing wildlife and land managers across the United States today (Alverson and others 1988; Healy and others 1997; Warren 1997; McShea and others 1997; Stromayer and Warren 1997). Most people have long considered the white-tailed deer {Odocoileus virginianus) to be a highly desired wildlife resource, so that society has had a difficult time accepting the fact that deer are increasingly becoming detrimental in many areas. Marchinton (1997) summed up the primary obstacle to deer management with the term urbanism. By urbanism, he states that "...we have a public that seems to be developing a very unnatural relationship with nature." Thus, the opinions and views of some people contrast with a healthy and sustaining ecosystem. Before European colonists in the pre-1700s settled Ohio, land was not ideal for deer. The forests were too dense, and covered over 95% of the state (Griffith and others 1993). With dense forest canopy, the shrubs and other low vegetation within the 'deer molar zone' did not grow well. These shrubs were the deer's main food and, without that necessity, deer did not flourish and their population was minimal. The settling of Ohio in the early 1800s expanded the deer population as the settlers cleared more and more of the forested land and
'Manuscript received 23 March 1999 and in revised form 15 August 1999 (#99-05).
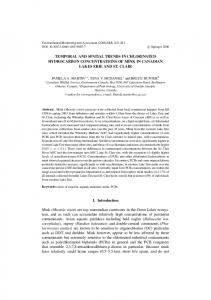
growth of the low, deer-accessible vegetation increased. The settlers also killed many of the deer's predators. The combination of these factors led to a rise of deer population for a time. However, in the later 1800s and early 1900s, deer were practically extirpated from the state, due to habitat loss and unrestricted exploitation. In the 1920s, deer started immigrating from Pennsylvania and Michigan into Ohio. The population went from being nearly extirpated, to an estimated 550,000 for the fall of 1996 (Fig. 1, ODNR 1996). This great increase can be credited to better habitat and improved deer harvest and population management. The white-tailed deer now thrives in Ohio
Total Deer Population Since 1940
o o o
600 500 400 c o 300 200 3 a. 100 o 0 Q_
T
y
y
1 1
r
y
-!1
=
.
1
"
1940 1950 1960 1970 1980 1990 2000 Year FIGURE 1. Estimated trends in deer populations in Ohio, 1940-1996.
OHIO JOURNAL O F SCIENCE
A. L. IVERSON AND L. R. IVERSON
as a result of suitable cover, abundant natural and cultivated foods, mild winters, and being able to adapt to human-dominated areas. The population of deer present today is related to two primary problems for society, an increasing human competition for critical elements of deer habitat/land area, and the fundamental issue of human population growth associated with increasing road densities. Many studies have shown that deer browsing affects forest regeneration in Pennsylvania (Marquis 1975; Whitney 1984), Illinois (Strole and Anderson 1992), Michigan (Frelich and Lorimer 1985), and Ohio (Boerner and Brinkman 1996). There is also evidence for deer browsing to substantially affect the abundance and diversity of herbaceous species. Herbaceous species provide the bulk of deer summer diet (87%, McCaffery and others 197'4). Rare species, especially orchids and other monocots, have been shown to be further endangered by deer
85
(Miller and others 1992). Although deer impacts on forest communities in Ohio are probably not as problematic as in some places such as the Allegheny National Forest in Pennsylvania, there are likely more impacts in Ohio than previously realized. It is also likely that substantial damage to farmer's crop yields occurs in some places during certain times. A second major problem associated with the overpopulation of deer is deer-vehicle accidents. Across the United States, Romin and Bissonette (1996) estimated over 538,000 deer were killed by vehicles in 1991. These accidents cost over a billion dollars in damages plus the enormous societal loss due to fatalities and injuries. In Ohio between 1989 and 1994, 17 deaths and 6,506 personal injuries resulted from approximately 128,000 deervehicle accidents (Tonkovich 1995). Most deer-vehicle accidents in Ohio occur during the peak of the deerbreeding season, the period of October to December,
Forest Land
Selected Counties Forest, ha
4000 - 8000 8000 - 15000 15000 - 30000 30000 - 60000 60000 - 120000 FIGURE 2. Map of Ohio (a) forest land and (b) deer harvested in 1995, by county.
Deer Harvested, 1995
Deer Harvested 309 - 600 601 - 990 991 - 1709 1710 - 3918 3919 - 5895
86
VOL. 99
DEER TRENDS IN OHIO
also known as "the rut." During this time, deer are highly focused on breeding and the mate-seeking bucks tend to be less concerned about vehicular traffic. November is the single month with the most deer accidents. Most deer are also struck by vehicles around the hours of dusk and dawn, with 58% occurring between 5:00 PM and midnight on rural state and county roads (Wisse 1997a). The objectives of this study were to evaluate the spatial and temporal trends of white-tailed deer across Ohio and to relate these patterns to environmental and human variables. MATERIALS AND METHODS Historic records on deer harvest and deer-vehicle accidents were acquired from the Ohio Departments of Transportation and Natural Resources, and the State Highway Patrol. Data included deer harvest by county for 1985-1995 (ODNR 1996), data on deer-vehicle accidents from 1988-1995 (Baker 1996), and the estimated deer populations since 1940. County-level information on the amount of forest was from the 1991 inventory of the USD A Forest Service (Griffith and others 1993), while data on human population (1990 census), urban land, crop land, rural land, length of major highways, and total
land in the county were extracted from the ArcUSA data sets (ESRI 1992). First, data were analyzed to assess relationships among county-level variables. These analyses were clone via correlation analysis and stepwise regression analysis. Maps were created in ArcView (ESRI 1996) for selected variables to visually display spatial trends. Second, to assess trends in harvest and collisions, nine counties were selected which represent various levels of forest, human population, and deer densities: Allen, Greene, Williams, Hamilton, Ashland, Vinton, Jefferson, Lawrence, and Delaware (Fig. 2). From these counties, trends were evaluated via linear regression to assess the rate of increase in deer harvested (1985-1995) and cleervehicle collisions (1988-1995). Extrapolation of the regression lines provides some capability for prediction beyond the period of evaluation, assuming historical trends continue. RESULTS Spatial Relationships Table 1 shows the primary data of deer harvest and deer-vehicle collisions (1995) along with several environmental variables for each county. Analysis of the
Crop Land vs. Deer Harvest 1995
Forest Land vs. Deer Harvest 1995 By County CD CO
I
i_
CD CD Q »*— O
"c O