ECOSYSTEMS
Ecosystems (2003) 6: 353–367 DOI: 10.1007/s10021-003-0125-0
© 2003 Springer-Verlag
Spatial and Temporal Variability in Growing-Season Net Ecosystem Carbon Dioxide Exchange at a Large Peatland in Ontario, Canada Jill L. Bubier,1* Gaytri Bhatia,1 Tim R. Moore,2 Nigel T. Roulet,2 and Peter M. Lafleur3 1 Environmental Studies Program, Department of Earth and, Environment, Mount Holyoke College, 50 College Street, South Hadley, Massachusetts, 01075, USA; 2Department of Geography and Centre for Climate and Global, Change Research, McGill University, 805 Sherbrooke Street W., Montreal, Quebec, H3A, 2K6 Canada; 3Department of Geography, Trent University, Peterborough, Ontario, Canada
ABSTRACT tween years; by contrast, the sedge-dominated areas (fen sites) showed signs of early senescence under drought conditions. Water table position was the strongest control on respiration in the drier summer, whereas surface peat temperature explained most of the variability in the wetter summer. Q 10 temperature-respiration quotients averaged 1.6 to 2.2. The ratio between maximum photosynthesis and respiration ranged from 3.7:1 in the poor fen to 1.2:1 at some bog sites; it declined at all sites in the drier summer owing to greater respiration rates relative to photosynthesis in evergreen shrub sites and a change in both processes in sedge sites. Our ability to predict ecosystem responses to changing climate depends on a more complete understanding of the factors that control NEE across a range of peatland plant communities.
We measured net ecosystem exchange of carbon dioxide (CO2) (NEE) during wet and dry summers (2000 and 2001) across a range of plant communities at Mer Bleue, a large peatland near Ottawa, southern Ontario, Canada. Wetland types included ombrotrophic bog hummocks and hollows, mineral-poor fen, and beaver pond margins. NEE was significantly different among the sites in both years, but rates of gross photosynthesis did not vary spatially even though species composition at the sites was variable. Soil respiration rates were very different across sites and dominated interannual variability in summer NEE within sites. During the dry summer of 2001, net CO2 uptake was significantly smaller, and most locations switched from a net sink to a source of CO2 under a range of levels of photosynthetically active radiation (PAR). The wetter areas—poor fen and beaver pond margin— had the largest rates of CO2 uptake and smallest rates of respiratory loss during the dry summer. Communities dominated by ericaceous shrubs (bog sites) maintained similar rates of gross photosynthesis be-
Key words: peatland; net ecosystem exchange; carbon dioxide; respiration; photosynthesis; climate change; bog; fen.
INTRODUCTION The carbon dioxide (CO2) exchange (or net ecosystem exchange [NEE]) of terrestrial ecosystems is driven by the balance between the uptake of CO2 by photosynthesis and its emission via plant and soil
Received 4 February 2002; accepted 9 September 2002; published online May 20, 2003. *Corresponding author; e-mail:
[email protected]
353
354
J. L. Bubier and others
respiration. As a result of differences in photosynthetic uptake and respiratory loss, there can be considerable interannual variability in NEE (Schimel and others 2001). It is still not clear whether this interannual variability is controlled by variations in photosynthesis or respiration, even within European forests; studies by Janssens and others 2001; Valentini and others 2000 have shown that the variability in soil processes is as important as plant productivity in determining the sink/source function of ecosystems. Thus, our understanding of the relative responses of respiration and photosynthesis to climate change is still incomplete. In the first coupled biosphere– climate global climate model, Cox and others (2000) predicted that terrestrial ecosystems will eventually switch from a net sink to a source of CO2, primarily because respiration increases at a faster rate than photosynthesis as ecosystems adjust to climate change. Peatlands have accumulated large amounts of organic matter (100 kg C m-2 or more). They contain between one-third and one-half of global soil carbon (C) (Turunen and others 2002; Gorham 1991), primarily because the long-term fixation of C is greater than its release through respiration, with average annual accumulation rates between 10 and 30 g C m-2 y-1 (Turunen and others 2002). However, climate models predict warmer, drier conditions in high latitudes, an area of the Earth where peatlands are an important component of the landscape. These conditions may result in the release of large amounts of CO2 to the atmosphere, thereby fueling a positive feedback to climatic warming (Roulet 2000; Moore and others 1998; Rapalee and others 1998). Most of our understanding of environmental influences on peatland C exchange comes from shortterm plot-scale studies. For example, previous studies have shown the importance of the temperature (McKenzie and others 1998; Bubier and others 1998; Silvola and others 1996; Kim and Verma 1992) water table (Christensen and others 1998; Moore and others 1998; Alm and others 1997; Chapman and others 1996; Johnson and others 1996), plant activity (Whiting and Chanton 2001; Griffis and others 2000; Bellisario and others 1998; Silvola and others 1996), and mineral nutrient characteristics of soil (Bridgham and others 1998; Thormann and Bayley 1997; Updegraff and others 1995) on NEE and respiration. The effects of the water table are less well understood than some of the other factors, in part because of the confounding effects of several variables, which interact in field situations. In most cases, lowering of the water table increases CO2 loss (Aurela and others 2001;
Alm and others 1999) through a thickening of the aerobic zone, thereby increasing oxygen availability, organic matter decomposition rates (Scanlon and Moore 2000), and enzymatic processes (Freeman and others 2001). This view has been substantiated to some extent by observations that within a single peatland water table differences produced by microtopography and hydrology can result in variation in the C balance (Waddington and Roulet 2000; Bubier and others 1999; Alm and others 1997). Interannual comparisons show that drier conditions can change peatlands from a CO2 sink to a source of CO2 in a single season (Griffis and others 2000; Joiner and others 1999; Shurpali and others 1995). In a comparison of NEE at a forest and fen site in subarctic Canada over 3 years, Lafleur and others (2001) found that lowering of the water table had a significant effect on NEE in the fen but not in the forest. However, Griffis and others (2000) attributed the interannual variability at the same fen to differences in gross photosynthesis, not respiration. The timing of spring greening triggered by wet or dry conditions was determined to have a greater influence on the annual C balance than respiration fluxes during the growing season. Therefore, it is not clear whether drought conditions have a greater effect on respiration or plant production in peatlands, or if there are different responses in bogs versus fens. In this study, we measured NEE using climatecontrolled chambers for 2 growing seasons across a range of plant communities at a peatland near Ottawa, Ontario, Canada. The purpose was to determine the controls on NEE, gross photosynthesis, and respiration. Fortuitously, the 1st season was wetter than normal and the 2nd was exceptionally dry; therefore, we were able to make a direct comparison of NEE under an extreme range of naturally varying moisture conditions. A study of long-term C accumulation at this site (P. Richard and others unpublished) revealed that this bog has accumulated between 15 and 20 g C m-2 y-1 on average over the last 6500 years, similar to the estimate for North American peatlands (Gorham 1991). With the use of micrometeorological techniques, the recent rate of C accumulation was determined to be closer to 60 g C m-2 y-1 (N.T. Roulet and others unpublished; Lafleur and others 2001). Frolking and others (2002), who developed a process-based peatland C model, found that the largest discrepancy between measured and modeled NEE fluxes at this bog site concerns rates of respiration. The present study adds to our understanding of the
Variability in CO2 Exchange at a Large Peatland
355
ecosystem-level controls on NEE, photosynthesis, and respiration at the plant community scale.
METHODS Site Description Mer Bleue is a raised ombrotrophic bog located near Ottawa, Ontario, in the Ottawa Valley – St. Lawrence Lowland physiographic region (45°24'N latitude, 75°30'W longitude). Mean annual temperature is 5.8°C, ranging from monthly averages of –10.8°C in January to 20.8°C in July. Mean annual precipitation is 910 mm, with 257 mm during the summer months of June, July, and August. Mean air temperature for the 3 months is 19.3°C (30-year normals; Environment Canada). The summer of 2000 was slightly wetter (8% more precipitation) and cooler than average, with 277 mm of precipitation and a mean daily temperature of 17.5°C; whereas 2001 was drier than normal, with 105 mm precipitation (only 41% of the long-term mean) and an average daily temperature of 19.4°C. By the end of the summer, the water table in 2001 was approximately 30 cm lower than in 2000 (Figure 1). The bog is located in a melt-water channel of the postglacial Ottawa River. Its current elevation is 67–76 m a.s.l., and it covers an area of 2800 ha. Peat depths range from 2.0 m at the edges to more than 5.0 m in the center and are underlain by Champlain Sea marine clays. Peat accumulation began between 7000 and 8500 years BP and the bog phase has been continuous for the last 6500 years (P. Richard unpublished). The lagg at the edge of the bog has been dammed by beavers (Castor canadensis), creating a zone of fluctuating water levels and different plant communities from those found at the bog center. Groundwater flow alternates between recharge in wetter conditions and discharge in drier periods. These sustained moisture deficits can be important to biogeochemical functioning when electrical conductivity and cation concentrations increase up to 60% during discharge flow conditions (Fraser and others 2001). Plant communities at the bog are dominated by ericaceous shrubs (Chamaedaphne calyculata, Ledum groenlandicum, Kalmia angustifolium) and Sphagnum mosses (primarily S. capillifolium, S. fuscum, and S. magellanicum). Secondary components of the community include deciduous shrubs, such as Vaccinium myrtilloides; sparse clumps of the sedge cottongrass (Eriophorum vaginatum); and trees (Picea mariana, Larix laricina). Microtopography consists of hummocks and hollows, with an average height difference of 25–30 cm. Although most of the peatland is
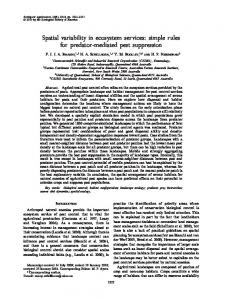
Figure 1. Daily precipitation and daily average water table position (cm below bog hollow peat surface) for Mer Bleue in June–August 2000 and 2001.
composed of bog vegetation, areas of poor fen occur where pore waters are slightly enriched with cations, especially sodium (Na) (Fraser and others 2001). Poor fen vegetation is composed primarily of sedges (Carex oligosperma, Rhyncospora alba) and Sphagnum mosses (S. fallax and S. papillosum). Plant communities on the edge of the bog leading into the beaver ponds are dominated by ericaceous shrubs at the driest end of the gradient and by an increasing dominance of cattail (Typha latifolia), sedges (Duli-
356
J. L. Bubier and others
Table 1. Dominant Vascular Plant and Moss Species and Biomass at Each Sampling Location
Site
Vascular Plants
Mosses
BP dry
Chamaedaphne calyculata Ledum groenlandicum Kalmia angustifolium Carex brunnescens Carex oligosperma Typha latifolia Calla palustris Juncus spp. Dulichium arundinaceum Chamaedaphne calyculata Ledum groenlandicum Eriophorum vaginatum Kalmia angustifolium Vaccinium myrtilloides Maianthemum trifoliata Carex oligosperma Eriophorum vaginatum
Sphagnum capillifolium Sphagnum fuscum Polytrichum strictum Sphagnum magellanicum Sphagnum fallax
BP mesic
BP wet
Bog hk
Bog hw
Poor fen
Sphagnum majus Drepanocladus fluitans Sphagnum capillifolium Sphagnum fuscum Polytrichum strictum Sphagnum magellanicum Sphagnum rubellum Sphagnum papillosum Sphagnum fallax
Total Aboveground Biomass
Foliar Biomass (Vascular Only)
Foliar biomass (Vascular plus Moss)
628(111)
228(58)
310 (73)
358(224)
196(83)
144(108)
176 (50)
109(59)
176 (50)
527 (43)
194(31)
337
431(147)
175 (2)
302(101)
317 (36)
147(22)
307 (34)
(7)
Site designations are beaver pond transect from the edge of the bog (BP dry), to a mesic site upslope of the pond (BP mesic), and a saturated site on the edge of the pond (BP wet); bog hummock (bog hk), bog hollow (bog hw), poor fen (PF). Total (includes vascular plants and moss) and foliar aboveground biomass data are means (SD) of three to five plots in g m-2 dry biomass.
chium arundinaceum, Carex spp.), and floating Sphagnum mosses (for example, S. majus) toward the wetter zones (Table 1). Surface water pH ranges from 3.9 in the bog hollows to 4.5 in the poor fen and the beaver pond margin (C. Roehm unpublished). Boardwalks were installed during 1998 –99 so that measurements could be made on a regular basis with minimal disturbance. Site designations are bog hummock (bog hk), bog hollow (bog hw), poor fen (PF), and beaver pond (BP) transect (dry, mesic, and wet).
CO2 Flux Measurements We measured NEE, photosynthetically active radiation (PAR), relative humidity (RH), and chamber temperature with a LI-COR 6200 portable photosynthesis system (LiCor Inc., NE, USA), which includes an LI-6250 infrared gas analyzer, thermistor, hygrometer, quantum sensor, and data logger. Whole-ecosystem measurements were made with clear, climate-controlled chambers modeled after a chamber described in Carroll and Crill (1997). The chamber walls were constructed of clear Lexan and had a removable top to allow equilibration of plant communities to ambient conditions between sampling runs. The climate-control system consisted of a heat exchanger and a cooler to store cold water, which was pumped to and from the exchanger through hoses. Air was circulated by fans inside the
chamber as required to maintain steady temperatures (⫾ 1°C) relative to the outside air temperature and to reduce changes in relative humidity in the chamber. Although chamber systems tend to underestimate NEE due to vapor pressure effects (Hooper and others 2002), the system used in this study mimimizes these effects by incorporating a climate-control component. Chamber dimensions were 0.6 ⫻ 0.6 m at the base and 0.45 m in height; they thus enclosed all of the dominant vegetation at each site. Aluminum collars (10 –20 cm deep) with a groove for chamber placement were installed in the peat in 1998 and 1999 to allow for the recovery of any damaged roots or other disturbance caused by collar insertion. Each site consisted of three to four replicate collars. To establish relationships between NEE and PAR for each sampling day shrouds with different mesh sizes were used to reduce the light entering the chamber by one-half and three-fourths of full light. An opaque shroud was placed over the chamber to eliminate all light for measuring dark ecosystem respiration (autotrophic and heterotrophic combined). Change in headspace CO2 concentration was measured every 5 s and averaged every 30 s for 2.5 min. Four sampling runs at different light levels (full, half, quarter, dark) were conducted at each collar location every 7–14 days from May to August 2000 and for the equivalent period in 2001.
Variability in CO2 Exchange at a Large Peatland
Environmental Variables We measured air and peat temperature at 5 and 10 cm below the peat surface with a Reotemp digital thermometer at the same time as the NEE sampling runs. We also measured the position of the water table in polyvinylchloride (PVC) tubes installed at each site. Continuous measurements of PAR, water table, and temperature (air and peat at depths of 0.01, 0.05, 0.10, 0.20, 0.40, 0.60, 0.80, 1.50, and 2.50 m) were made at a centrally located micrometeorological tower (Lafleur and others 2001). The instruments were monitored with a data logger and scanned every 5 s; 30-min averages were then computed.
Vegetation Sampling Plant species composition was recorded in each collar as percent cover of vascular plant and bryophyte species. Nomenclature follows Anderson and others (1990) for true mosses, Anderson (1990) for Sphagnum moss species, and Fernald (1950) for vascular plant species. Aboveground biomass was measured for the vascular plant and bryophyte component of each sampling site. Total and foliar biomass for vascular plants was measured by clipping aboveground live vegetation in nearby 0.5 ⫻ 0.5 m quadrats (three to five per site) in August before the plants senesced. Clipped vascular plants were sorted into leaves and shoots. We made an estimate of the photosynthetically active portion of the Sphagnum moss biomass by clipping it at the base of the capitula. As noted by Clymo (1970), there is no clear division of live and dead plant material in Sphagnum, so this is an arbitrary but consistent approach. The biomass samples were oven-dried at 80°C and weighed (Moore and others 2002).
Data Analyses Gas flux calculations were performed on the CO2 concentration data collected during each 2.5-min run. On several occasions, we used a shorter measurement period (usually 1.5 min) for the flux calculation if the rate began to change during the sampling run. This situation occurred under fulllight conditions when plants may have been stressed due to particularly warm weather with high relative humidity. The relationship between NEE and PAR was described by a rectangular hyperbola using a curve-fitting technique (Thornley and Johnson 1990) and computed with JMP-IN statistical software (SAS Institute): NEE ⫽
GPmax 䡠 ␣ 䡠 PAR ⫹R ␣ 䡠 PAR ⫹ GPmax
(1)
357
where ␣ is the initial slope of the rectangular hyperbola (also called “the apparent quantum yield”), GPmax ⫾ R is the NEE asymptote, and R is the y-axis intercept (or dark respiration value, R less than 0). Because different plant communities saturate at different light levels (but most saturate at a PAR higher than 1000), and GP max assumes an infinite upper limit for PAR, we calculated the average rate of gross photosynthesis for each site for a PAR greater than 1000 mol photon m-2 s-1 to more realistically compare the maximum rates of photosynthesis (PSN max) for each site. Because the maximum observed value of PAR was usually 2000 in midsummer, maximum gross photosynthesis was calculated for PAR ranging from 1000 to 2000 mol photon m-2 s-1. We adopted the sign convention of CO2 uptake by the ecosystem as positive and CO2 loss to the atmosphere as negative. The dark chambers measured ecosystem respiration, the total of enclosed plants, roots, and soil microbes (R). Because light and dark measurements were made within a few minutes of each other, the difference between NEE at full or fractional light and NEE with a dark chamber (respiration) was considered to represent the gross photosynthesis at that light level for the vegetation within the chamber. Analysis of variance (ANOVA) (one-way using the Sidak method) was used to test variance in NEE, gross photosynthesis, and respiration among sites and between years. Seasonal means of individual collars were used instead of all instantaneous measurements to avoid the statistical problem of autocorrelated observations over the growing season. The small sample size used in this approach results in a conservative estimate of the variance among sites. Matched-pairs t-tests were used to test differences between years and to ensure that observations were not correlated in time. We used multiple stepwise and least-squares regression to develop empirical predictive models with the measured environmental variables. All analyses were performed with S-PLUS 6.0 statistical software (Insightful Corp., Seattle, WA, USA).
RESULTS Spatial Variability The response of NEE to PAR was assessed by curvefitting the rectangular hyperbola model to the data (Eq. [1] and Figure 2). Gross photosynthesis at maximum PAR (GPmax) ranged from 10.1 mol CO2 m-2 s-1 in the bog hummocks and hollows to 13.8 mol CO2 m-2 s-1 in the mesic BP site (Table 2). PSNmax followed a similar pattern, although the
358
J. L. Bubier and others
Figure 2. Relationship between photosynthetically active radiation (PAR) and net ecosystem exchange of CO2 (NEE) at the poor fen, showing higher rates of NEE in the wetter summer (2000) and a change in compensation point between wet and dry summers. Curve fits for PAR versus NEE are calculated with rectangular hyperbola model from Eq. (1). See Table 2 for a summary of nonlinear parameter estimates for all sites.
rates only varied from 7.5 to 9.1 mol CO2 m-2 s-1. The initial slope of the curve (␣), which indicates the rate of NEE increase at low levels of PAR, ranged from 0.012 to 0.019 in all sites except the bog hollow (0.028) and the BP dry site (0.024). Rates of respiratory loss were greatest (– 6.1 mol CO2 m-2 s-1) in the dry BP site and smallest (–2.1 mol CO2 m-2 s-1) in the poor fen. GPmax and ␣ were smaller and R was more negative in 2001 than in 2000, as illustrated by the NEE versus PAR relationship at the poor fen (Figure 2 and Table 2). For example, at PAR ⫽ 1000, NEE was 5.2 mol CO2 m-2 s-1 in 2000, as compared with only 3.4 mol CO2 m-2 s-1 in 2001. To test whether NEE, gross photosynthesis, and respiration varied spatially across the range of sites, one-way ANOVA was performed. Figures 3A and B shows that rates of NEE at high light levels (PAR greater than 1000 mol photon m-2 s-1) varied across the peatland in both years (two statistically different groups as shown by the letters a, b, or ab next to each site mean), but maximum rates of gross photosynthesis did not vary significantly among sites (one group a). This pattern was consistent for both years, even though the summers were quite different in terms of moisture regime. The range of maximum NEE across sites was consistently smaller in 2001 than in 2000, but the relationship among sites was similar (Figure 3B). The wet end of the BP gradient was not measured in 2000 because the collars were submerged below
water. However, the wet end of the gradient, as well as the poor fen, showed the largest rates of maximum NEE, and the dry or mesic portions of the BP transect had the smallest rates of net CO2 uptake in both years. Bog hummock and hollow sites were intermediate in the NEE range and were not statistically different from each other in either year. In contrast to the similar rates of gross photosynthesis among sites, respiration rates varied significantly (Figure 3C). In 2000, there were four distinct groupings (a– d); in 2001, there were three groups (a– c). The range from the smallest to the largest rates of respiration followed a similar but more pronounced pattern than that for maximum NEE (Figure 3B). Hummocks and hollows were not significantly different in either year, but poor fen and the wet end of the BP transect had the smallest respiration rates, while the dry end of the BP gradient had the greatest losses of CO2 from respiration (Figure 3C). In terms of plant community composition, even though the sites ranged from ericaceous shrubs to herbaceous species such as sedges, rates of gross photosynthesis at maximum available light (PAR greater than 1000 mol photon m-2 s-1) were not statistically different (Figure 3A). Aboveground total vascular plant and moss biomass at the sites ranged from 176 to 628 g m-2 and was larger in the hummocks than the hollows and poor fens (Table 1). However, total leaf biomass ranged from 140 to 340 g m-2 and vascular leaf biomass was even less variable, ranging from 100 to 230 g m-2. This small range in leaf biomass across sites may explain the similar rates of photosynthesis. Vascular leaf biomass was strongly negatively correlated with maximum NEE and respiration in both years, but only weakly positively correlated with photosynthesis (Figure 4). The correlation between biomass and NEE is driven more by the respiration component of NEE than by photosynthesis. Estimates of aboveground net primary production range from 320 g m -2 y-1 in the hummocks to 260 g m-2 y-1 in the hollows and 340 g m-2 y-1 at the poor fen. Of this, between 140 and 225 g m-2 y-1 is derived from the mosses. At all sites, a substantial proportion of the total biomass is belowground, and root biomass estimates range from 1200 to 2400 g m -2 (Moore and others 2002). This could partially explain the strong role of respiration in net ecosystem CO2 exchange for this and other peatland sites. Also, the organic soil pool (3–5 m peat depth) is significantly greater than the plant biomass pool.
Variability in CO2 Exchange at a Large Peatland
359
Table 2. Nonlinear NEE-PAR Rectangular Hyperbola Curve Fit Parameter Estimates Site 2000 Bog hummocks Bog hollows Poor fen Beaver pond (dry) Beaver pond (mesic) 2001 Bog hummocks Bog hollows Poor fen Beaver pond (dry) Beaver pond (mesic) Beaver pond (wet)
GPmax
PSNmax
Alpha (␣)
Resp (R)
n
r2
10.15(1.41) 10.10(1.07) 11.23(0.78) 11.53(1.13) 13.82(1.60)
7.70(2.56) 7.58(2.66) 7.80(1.75) 7.67(2.29) 9.08(3.58)
0.018(0.006) 0.028(0.008) 0.017(0.002) 0.016(0.003) 0.019(0.004)
⫺3.79(0.48) ⫺4.78(0.49) ⫺2.05(0.21) ⫺6.11(0.35) ⫺5.15(0.42)
52 51 88 121 75
0.75 0.79 0.90 0.73 0.79
10.23(1.11) 11.96(1.74) 9.24(1.01) 11.46(1.73) 6.86(2.05) 10.11(1.28)
7.74(1.77) 8.22(1.54) 6.59(1.42) 9.66(1.93) 6.48(3.33) 6.79(2.63)
0.017(0.004) 0.017(0.004) 0.014(0.003) 0.024(0.008) 0.012(0.007) 0.015(0.004)
⫺4.96(0.03) ⫺6.42(0.41) ⫺2.76(0.27) ⫺7.72(0.56) ⫺6.22(0.54) ⫺3.59(0.35)
80 103 116 82 43 76
0.78 0.68 0.74 0.63 0.52 0.76
NEE, net ecosystem exchange of carbon dioxide; PAR, photosynthetically active radiation; GPmax ⫾ R, asymptote for NEE; PSNmax, maximum photosynthesis (mol CO2 m-2 s-1) for PAR greater than 1000 mol photon m-2 s-1; alpha (␣), initial slope of the curve; R, respiration (y intercept); See equation-1 in text. SE of the estimate in parentheses n ⫽ number of observations Ranges of r2 at P ⬍ 0.001 are applicable for all parameters except PSNmax, which is calculated as the mean and SE for all measured PSN values for PAR greater than 1000.
Variability between Growing Seasons Even though the sites showed similar patterns of NEE and respiration in relation to each other in both years, the magnitudes of the fluxes were different between the wet and dry summers. The range of maximum NEE, gross photosynthesis, and respiration rates had greater variance in 2001 (Figure 3). The average fluxes were also significantly smaller in 2001 (less CO2 uptake by the ecosystem). Gross photosynthesis at maximum light (PSNmax) rates did not vary significantly between years in most sites, as indicated by paired t-test comparisons (Figure 3A and Table 2). The exceptions were the mesic portions of the BP transect and the poor fen. This outcome may be the result of stressed vegetation at these sites in 2001. These sites were the only ones dominated by sedges, which are better adapted to wet conditions and showed signs of senescence during the drought year (that is, earlier browning of leaves). Although weak, the positive correlation between maximum gross photosynthesis and vascular leaf biomass was stronger in the drier summer of 2001, when PSNmax rates were lower in the poor fen and mesic BP sites (Figure 4). Phenology data showed that new leaf production did not vary significantly for evergreen shrubs between years, but that sedges began to senesce early in the 2001 growing season at the poor fen and BP margin (T. R. Moore and J. L. Bubier unpublished). The sites with ericaceous shrubs (bog hummock and hollow and dry BP site) generally had similar rates of gross photosynthesis under different moisture regimes.
However, in late August, when the drought was most severe, even the evergreen shrubs showed a decline in photosynthesis. This decline was not enough to affect the difference between years for the entire growing season as it did for the sedgedominated sites. Rates of maximum NEE and respiration were significantly different between years at most sites (Figures 3B and C), particularly the wetter ones. In the drier year, the BP mesic site even switched from a sink to a source of CO2 under high light conditions (NEEmax). Most sites switched from a sink to a source of CO2 under low light conditions in 2001, with the exception of the BP wet margin and poor fen, which remained a sink both years although a smaller sink in 2001 than in 2000. For example, the compensation point on the NEE versus PAR curve where NEE ⫽ 0 (that is, light level at which photosynthesis equals respiration) (Figure 2) is at PAR of approximately 200 mol photon m-2 s-1 at the poor fen in 2000 and at 400 mol photon m -2 s-1 in 2001. The hollows had lower rates of maximum NEE than the hummocks in both years, and the hollow became a strong source of CO2 at low light levels in 2001. The drier sites (bog hummock and BP dry) dominated by ericaceous shrubs were the only ones that did not show significantly different maximum NEE rates between years. This may be attributed to the greater adaptability of evergreen leaves to changes in moisture (Small 1972b). However, this pattern changed at the end of August, when even the shrubs showed signs of moisture
360
J. L. Bubier and others
Figure 4. Relationships among vascular plant foliar biomass and carbon dioxide (CO2) flux (NEEmax [NEE at PAR greater than 1000mol photon m-2 s-1], PSNmax (gross photosynthesis at PAR greater than 1000 mol photon m-2 s-1), and respiration) for 2000 and 2001. Linear regressions are significant at P ⬍ 0.05.
Figure 3. Mean ⫾ SE for (A) PSNmax (gross photosynthesis at photosynthetically active radiation [PAR] greater than 1000 mol photon m-2 s-1), (B) NEEmax (net ecosystem exchange of CO2 [NEE] at PAR greater than 1000); and (C) respiration. Asterisks indicate sites that are significantly different between years at P ⬍ 0.05. Paired t-tests were used to test differences between years. Results from one-way analysis of variance (ANOVA) are indicated by letters above each site (2000/1). Sites are significantly different at P ⬍ 0.05 if they have no letters in common; n ⫽ three to four collars for each site. Mean values represent seasonal average rates of carbondioxide (CO2) exchange for June–August. See Table 2 for number of observations used to calculate means.
stress. The most important change between years at four of five sites was respiration, which was significantly greater (loss of CO2 from the ecosystem) in the dry summer (Figure 3C).
Environmental Controls The water table and the temperature of the air and peat at different depths were measured throughout both summer seasons. Within indi-
vidual sites, the water table was correlated with respiration, although the relationships were stronger in 2001 (Figure 5). In the poor fen, for example, the water table dropped to only 10 cm below the peat surface in 2000 (Figure 5A), but it was as low as 45 cm in 2001 (Figure 5B). The water table explained 57% of the variation in respiration at the poor fen in 2001, compared with 24% in 2000. Similar patterns were evident at the bog hummock and hollow, with the water table explaining 39% to 62% of the respiration variability in the drier summer (Figure 5B). The slopes of the lines were different between years, but the limited range in water table position in 2000 may explain this pattern. When combining the 2 years, the correlation between water table position and respiration was similar to 2001 (Figures 5B and 6A). In 2001 at the BP transect, the combined site regression was stronger than individual sites (r2 ⫽ 0.62) (Figures 5B and 6B). Temperature was another correlate with respiration and was generally a better predictor in the wetter summer of 2000, although coefficients of determination (r2) were above 0.50 for most sites in both years (Figure 7A and B). The slope of the respiration versus peat surface temperature (T at 5-cm depth) was similar at all sites in both years
Variability in CO2 Exchange at a Large Peatland
Figure 5. Relationship between water table position below peat surface and respiration for (A) all sites in 2000 and (B) all sites in 2001. Linear regressions are significant at P ⬍ 0.05.
despite differences in the moisture regime (Figure 7C). Q10 values over the range of 15–25°C averaged 1.6 to 2.2. Because water table position and temperature are correlated in soils that are saturated for most of the year, multiple regressions were performed to determine the relative importance of these two variables in each year (Table 3). Air temperature or temperature at 5-cm peat depth (strongly correlated) was the most important predictor of respiration at most sites, as evidenced by the partial r2 in the stepwise regression. Water table position was the second most important factor in 2000, and it was the most important variable at some sites in the drier summer of 2001—for example, the poor fen and bog hummock sites. Peat temperature at 10-cm depth was not significant at most sites. Coefficients of determination (r2) for the least-squares multiple regressions ranged from 0.40 to 0.95 (P ⬍ 0.01).
361
Figure 6. Relationship between water table position below peat surface and respiration for (A) all sites combined for the two growing seasons and (B) individual beaver pond transect sites (solid lines) and with transect sites combined as one relationship (dashed line) for 2001. Linear regressions are significant at P ⬍ 0.05.
DISCUSSION Several recent studies have shown the importance of lowering of the water table and drought conditions to the C balance of peatlands and organic soils in northern latitudes. Peatlands can switch from net sinks to sources of CO2 over short time intervals, with increased rates of respiration and/or decreased rates of photosynthesis (Joiner and others 1999; Schreader and others 1998; (Shurpali and Verma 1998; Lafleur and others 1997). The underlying mechanisms for this switch have been variously attributed to increased decomposition under aerobic conditions (Christensen and others 1998; Moore and Dalva 1993), differences in N mineralization (Updegraff and others 1995), and enhanced activity of phenol oxidase, the enzyme responsible for degrading recalcitrant phenolic compounds in peat (Freeman and others 2001). Silvola and others (1996) predicted a 50%–100% increase in respira-
362
J. L. Bubier and others
Figure 7. Relationship between temperature at 5-cm peat depth and log10 respiration for (A) all sites in 2000, (B) all sites in 2001, and (C) bog hummock and poor fen in both years. Linear regressions are significant at P ⬍ 0.05.
tion with a 14 –22 cm drop in the water table, a condition that has been predicted to arise in northern peatlands under a climate change scenario of doubled CO2 (Roulet and others 1992). However, there is conflicting evidence on the influence that changing hydrologic conditions exerts on peatland ecosystems that vary in species composition (sedge and shrub, evergreen and deciduous) and microtopography (hummock and hollow) (Belyea and Clymo 2001). Moreover, there is debate on the short- and long-term responses of peatlands to climate change, as well as the relative roles of photosynthesis and respiration on the net C balance. For example, Griffis and others (2000) showed that the switch of a northern fen from a net sink to a source of CO2 in a dry year was primarily due to reduced rates of photosynthesis early in the growing season, at a critical time for plant development. Alm and others (1999) showed that bogs can switch
from sinks to sources under drought conditions, with enhanced rates of respiration and reduced plant production, particularly with Sphagnum mosses. Bubier and others (1999) found that sedgedominated mineral-poor fens sequestered more CO2 than either mineral-rich fens dominated by deciduous shrubs or ericaceous shrub bogs, primarily because the poor fens had higher rates of photosynthesis relative to ecosystem respiration. However, in a dry year, all sites had increased rates of respiration (Bellisario and others 1998). In an experimental manipulation of water table levels in bog and fen mesocosms, bogs and fens did not have different decomposition rates under varying water levels, and respiration rates responded exclusively to temperature (Updegraff and others 2001). However, rates of plant production varied with water table level, such that shrubs favored drier conditions and sedge and bryophyte production was enhanced under wetter conditions (Weltzin and others 2000). Sommerkorn and others (1999) also found that mosses were important to the C balance and reported that wet microsites showed greater increases in respiration than drier sites under warmer and drier conditions in arctic tundra. Longer-term modeling studies indicate that both respiration and production in peatlands are highly sensitive to changes in the water balance (Hilbert and others 2000), and that bogs may be more sensitive to changes in water level and temperature than fens (Frolking and others 2002). Even small changes in NPP and decay rates may cause a permanent reduction in the current C sink capability of peatlands (Wieder 2001). The debate over the relative responses of photosynthesis and respiration to climate change is not confined to peatlands. In a study that encompassed a wide range of ecosystems, Thornley and Cannell (2001) reported that most models predict that soil respiration will increase more than photosynthesis in response to warming alone, especially at sites with organic soils. Mertens and others (2001) found that increased temperature in arctic ecosystems resulted in higher rates of respiration, turning the ecosystem into a source of CO2. However, gross photosynthesis was not affected by the simulated warming. Johnson and others (1996) reported a similar response to dry conditions in experimental tundra plots, where rates of respiration increased under drier conditions, but photosynthesis did not change significantly. Valentini and others (2000) found that respiration was more important than photosynthesis in explaining differences in NEE across a latitudinal gradient in European forests. The trend showed higher rates of respiration at high
2000 2001 2000 2001 2000 2001 2000 2001 2000 2001 2001
Poor fen Poor fen Bog hollow Bog hollow Bog hummock Bog hummock Beaver pond (dry) Beaver pond (dry) Beaver pond (mesic) Beaver pond (mesic) Beaver pond (wet)
-0.173 -0.115 NS -0.553 NS NS -0.205 -0.095 -0.302 NS -0.081
Tair
(0.77)
(0.63) (0.61) (0.68)
(0.55)
(0.34) (0.79)
-0.006 NS -0.142 NS -0.115 -0.099 -0.249 -0.173 -0.077 -0.316 -0.077
T5cm
(0.83) (0.72) (0.71) (0.71) (0.85) (0.56) (0.63)
(0.77)
(0.29)
Partial cumulative r2 using stepwise multiple regression are in parentheses below each coefficient value. Boldface indicates most important variable in the equation. All variables are significant at P ⬍ 0.01 unless noted as not significant (NS).
Year
Site NS -0.065 (0.82) -0.089 (0.94) 0.364 (0.79) -0.071 (0.88) NS NS NS NS NS NS
T10cm 0.089 (0.40) 0.029 (0.56) 0.026 (0.95) 0.209 (0.68) -0.028 (0.89) 0.209 (0.62) 0.063 (0.78) 0.066 (0.69) 0.031 (0.82) 0.025 (0.59) 0.103 (0.74)
WT
0.619 1.569 0.979 6.768 -0.184 8.359 5.689 1.733 4.721 1.594 1.516
Intercept
0.40 0.82 0.95 0.79 0.89 0.72 0.78 0.71 0.85 0.59 0.77
r2
61 116 38 102 73 65 102 82 62 43 76
n
0.465 0.321 0.194 1.025 0.353 1.089 0.881 1.281 0.499 1.612 0.625
RMSE
Table 3. Multiple Least-Squares Linear Regression Coefficients for Respiration and Air Temperature (Tair), Temperature at 5 cm (T5cm) and 10 cm (T10cm) Depth below Peat Surface, Water (WT), Correlation Coefficients (r2), Sample Size (n), and Root Mean Square Error (RMSE)
Variability in CO2 Exchange at a Large Peatland
363
364
J. L. Bubier and others
Figure 8. Ratios between maximum photosynthesis (PSNmax defined as gross photosynthesis at PAR greater than 1000 mol photon m-2 s-1) and respiration for all sites, showing a decrease in ratios between the two summers (downward sloping of arrows). In calculating ratios, respiration values were converted to positive numbers.
latitudes, indicating that temperature alone cannot explain rates of decomposition. However, Janssens and others (2001) reported that temperature controls respiration only on short time scales for the same range of European forests, whereas plant production is more important at longer time intervals in explaining differences in NEE. The present study shows that rates of net C uptake are lower under drier conditions in a variety of peatland communities, including bog, fen, and beaver pond margins (Figure 3). The difference in NEE between wet and dry years can be attributed primarily to increased rates of respiration in all sites, with reductions in whole growing season gross photosynthesis only in the sedge-dominated sites. Bog sites with evergreen shrubs did show a decline in photosynthesis in the dry year, but only at the very end of the summer, during the most severe part of the drought. Figure 8 summarizes the peatland community’s response to the water table by plotting the ratio of maximum gross photosynthesis to respiration (PSNmax/Resp) for different plant communities in the wet and dry summers. The larger respiration rates in the drier year relative to photosynthesis are primarily responsible for the decrease in this ratio, although reductions in photosynthesis are also factors in the poor fen and BP mesic sites. In the poor fen, for example, the ratio dropped from 3.7:1 to 2.4:1. Lower ratios were seen for the bog hummocks (2.0:1 to 1.5:1). The PSN max/Resp ratios are generally larger than those found for forested ecosystems (for example, 1:1 to 1.4:1 in Janssens 2001), but they become closer to
forest ratios under dry conditions. However, the shift in ratios in response to short-term drought conditions may not persist over longer time periods when species composition may change as a result of prolonged lowering of the water table. A persistently lower water table may also increase vascular plant biomass and change growth form dominance– factors that, in turn, have implications for nutrient cycling and ecosystem feedbacks to climate change (for example, see Shaver and Jonasson 1999). Unlike the ericaceous shrub bog sites, which did not show a decline in gross photosynthesis until the end of the growing season, sedge-dominated (primarily Carex spp.) communities (fen and BP mesic site) had lower rates of gross photosynthesis for most of the drier summer, as well as increased rates of respiration, in correspondence with the findings of Griffis and others (2000). However, the fen and BP margin (wet site) had the largest rates of CO2 uptake overall and were the only sites that did not switch from a sink to a source of CO2 under lowlight conditions. Although the poor fen remained a stronger C sink than the bog sites under drought conditions in the short term, the reduction in photosynthesis in drier years may prove detrimental in the longer term. The bog communities dominated by ericaceous shrubs showed little reduction in photosynthesis during the dry summer, which may be evidence of the long-term adaptation of evergreen species to stressed conditions. Aerts (1995, 1999) showed that evergreens have a long-term competitive advantage over sedges or other herbaceous species in stressed, low-nutrient environments because they retain nutrients and moisture longer than sedges. In studies that measured water potentials and rates of photosynthesis for bog species at Mer Bleue, Small (1972a, 1972b) found that evergreens had higher nutrient-use efficiency and higher tolerance to moisture stress than deciduous species. In a later study that measured rates of gas exchange in Carex species, Busch and Losch (1999) found that rates of CO2 uptake were reduced under drier conditions. These plant physiological traits may explain the different photosynthetic responses to dry conditions in the bog and fen in our study. Although sedge-dominated communities had lower rates of gross photosynthesis in the drier summer, the overall comparison of maximum photosynthesis rates among sites did not vary significantly in either year (Figure 3A). Species composition was variable across sites, and total aboveground vascular and moss biomass ranged from 176 to 628 g m-2; however, foliar biomass for vascular plants was less variable (range, 109 –228 g m-2) (Table 1). Moore and others (2002) found that
Variability in CO2 Exchange at a Large Peatland total aboveground vascular biomass decreased strongly with a rise in water table depth along this gradient at Mer Bleue (biomass ⫽ 10.44 wt–106, r2 ⫽ 0.75), vascular leaf biomass ranged only from 127 to 280 g m-2 and was not as strongly dependent on water table position (leaf biomass ⫽ 2.78 wt ⫹ 77, r2 ⫽ 0.53). Sphagnum capitulum biomass ranged from 57 to 197 g m-2 and was weakly dependent on water table position (capitulum ⫽ – 0.948 wt ⫹ 185, r2 ⫽ 0.09). In the present study, we found that vascular leaf biomass is strongly negatively correlated with NEE and respiration (Figure 4), which suggests the importance of plant processes to ecosystem respiration and/or the indirect effect of the water table, as shown by higher leaf biomass in drier sites. In contrast to gross photosynthesis, respiration rates varied significantly among sites (Figure 3C), highlighting the importance of soil and belowground plant processes to the ecosystem C balance. Our results show that respiration increases with temperature in the short term, and that all peatland types respond similarly to increases in temperature, even under different moisture conditions (Figure 7). However, rates of respiration differed across sites and between years (Figure 3C), mainly in response to water table position (Figure 5). For example, the strong relationship between ecosystem respiration and water table position across the BP transect (r2 ⫽ 0.62) (Figure 6B) shows that fluctuating water levels in response to either climate change or beaver impoundment can have a dramatic effect on C exchange (Roulet and others 1997). Particularly in transition zones, where species are exposed to highly fluctuating water levels, margins may switch from sinks to sources (Figure 3B). The compensation point in the light response curve increased from a PAR of 200 to 400 mol photon m-2 s-1 between the wet and dry summer (Figure 2). To identify the controls on respiration, a 12-day laboratory incubation was done of intact peat cores from the Mer Bleue sites. It showed that over a temperature range of 4 –14°C, the Q10 quotient of CO2 production averaged 2.0 and 2.7 under oxic and anoxic conditions, respectively (Scanlon and Moore 2000). A greater control over CO2 production was created by the change from anoxic to oxic conditions, which increased production rates by an average of 12-fold. Even greater increases in CO2 production from anoxic to oxic conditions (up to 20:1) are observed under longer incubations periods (Moore and Dalva 2001). Lowering of the water table will also dry the surface layers of the peat, but this effect is probably of secondary importance. Reducing the volumetric water content from 40% to
365
10% in the surface layer (0- to 5-cm depth) of a hummock peat profile at Mer Bleue resulted in a reduction in CO2 production of 60%, but reductions in water content lower in the profile (10- to 45-cm depth) are smaller (from 50% to 25%) and result in a less dramatic decrease (25%) in CO2 production (T. R. Moore unpublished). In the global terrestrial C budget, the recent record shows a net release of C to the atmosphere during warm and dry years; however, large uncertainties still exist as to the contribution of various processes (Schimel and others 2001). Vance and Chapin (2001) concluded that microbial decomposition is not limited by a single factor in organic soils and that the relative importance of variables such as peat chemistry, temperature, moisture, and species composition may vary by ecosystem and by time scale (see also Shaver and others 2000; Grogan and Chapin 1999; Moore and others 1999). Clearly, there is a need to improve our understanding of temporal and spatial variability in respiration to better predict short- and long-term responses to climate change across a range of ecosystems.
CONCLUSION Net ecosystem CO2 exchange was significantly different across the range of peatland plant communities in both wet and dry years, but this difference was attributed primarily to varying rates of respiration. NEE was significantly smaller in the drier summer at all sites. Drought enhanced the rates of respiratory loss from all plant communities, but it had varying effects on gross photosynthesis, which declined in sedge-dominated sites over the whole growing season but did not change significantly in bog sites dominated by ericaceous shrubs until the end of summer. The effect of a drier climate on photosynthesis, respiration, and NEE will vary depending on the species composition and hydrology of the particular peatland ecosystem.
ACKNOWLEDGMENTS We thank Emily Neal, Meaghan Murphy, Sarah Curry, and Colette Isernhagen, students at Mount Holyoke College and McGill University, for their enthusiastic assistance in the field and laboratory. This project would not have been possible without the financial support of a grant from the NASA New Investigator Program in Earth System Science and Mount Holyoke faculty research grants to J.L.B., an NSERC Strategic Grant on the carbon balance of peatlands to N.T.R., and individual NSERC Research Grants to T.R.M., P.M.L., and N.T.R. J.L.B.
366
J. L. Bubier and others
also acknowledges the generous support of the Woodrow Wilson and Mellon foundations during an academic leave from Mount Holyoke. We thank the National Capital Commission of Ottawa for permission to use Mer Bleue as a research site and Aaron Ellison for statistical advice.
REFERENCES Aerts R. 1995. The advantages of being evergreen. Trends Ecol Evol 10:402–7. Aerts R. 1999. Interspecific competition in natural plant communities: mechanisms, trade-offs and plant soil feedbacks. J Exp Bot 50:19–37. Alm J, Schulman L, Walden J, Nykanen H, Martikainen PJ, Silova J. 1999. Carbon balance of a boreal bog during a year with an exceptionally dry summer. Ecology 80:161–74. Alm J, Talanov A, Saarnio S, Silvola J, Ikkonen E, Aaltonen H, Nykanen H, Martikainen PJ. 1997. Reconstruction of the carbon balance for microsites in a boreal oligotrophic pine fen, Finland. Oecologia 110:423–31.
Fernald ML. 1950. Gray’s manual of botany. New York: Van Nostrand Reinhold. Fraser CJD, Roulet NT, Lafleur PM. 2001. Groundwater flow patterns in a large peatland. J Hydrol 246:142–54. Freeman C, Ostle N, Kang H. 2001. An enzymatic ‘latch’ on a global carbon store. Nature 409:149. Frolking S, Roulet NT, Moore TR, Lafleur PM, Bubier JL, Crill PM. 2002. Modeling the seasonal to annual carbon balance of Mer Bleue Bog, Ontario, Canada. Global Biogeochem Cycles 16(3):10.1029/2001GB001457. Frolking S, Roulet NT, Moore TR, Richard PJH, Lavoie M, Muller SD. 2001. Modeling northern peatland decomposition and peat accumulation. Ecosystems 4:479–98. Frolking SE, Bubier JL, Moore TR, Ball T, Bellisario LM, Bhardwaj A, Carroll P, Crill PM, Lafleur PM, McCaughey JH, and others. 1998. Relationship between ecosystem productivity and photosynthetically active radiation for northern peatlands. Global Biogeochem Cycles 12:115–26. Gorham E. 1991. Northern peatlands: role in the carbon cycle and probable responses to climate warming. Ecol Appl 1:182– 95.
Anderson LE. 1990. A checklist of Sphagnumin North America north of Mexico. Bryologist 93:500–1.
Griffis TJ, Rouse WR, Waddington JM. 2000. Interannual variability of net ecosystem CO2 exchange at a subarctic fen. Global Biogeochem Cycles 14:1109–21.
Anderson LE, Crum HA, Buck WR. 1990. List of the mosses of North America north of Mexico. Bryologist 93:448–99.
Grogan P, Chapin FS III. 1999. Arctic soil respiration: effects of climate and vegetation depend on season. Ecosystems 2:451–9.
Aurela M, Laurila T, Tuovinen J-P. 2001. Seasonal CO2balances of a subarctic mire. J Geophys Res 106:1623–37.
Hilbert D, Roulet N, Moore T. 2000. Modelling and analysis of peatlands as dynamical systems. J Ecol 88:230–42.
Bellisario LM, Moore TR, Bubier JL. 1998. Net ecosystem CO2 exchange in a boreal peatland, northern Manitoba. Ecoscience 5:534–41.
Hooper DU, Cardon ZG, Chapin FS III. 2002. Corrected calculations for soil and ecosystem measurements of CO2 flux using the LI-COR 6200 portable photosynthesis system. Oecologia 132:1–11.
Belyea LR, Clymo RS. 2001. Feedback control of the rate of peat formation. Proc R Soc Lond B 268:1315–21. Bridgham SD, Updegraff K, Pastor J. 1998. Carbon, nitrogen, and phosphorus mineralization in northern wetlands. Ecology 79: 1545–61. Bubier JL, Crill PM, Moore TR, Savage K, Varner RK. 1998. Seasonal patterns and controls on net ecosystems CO2exchange in a boreal peatland complex. Global Biogeochem Cycles 12:703–14. Bubier JL, Frolking S, Crill PM, Linder E. 1999. Net ecosystem productivity and its uncertainty in a diverse boreal peatland. J Geophys Res 104:27,683–92. Busch J, Losch R. 1999. The gas exchange of Carexspecies from eutrophic wetlands and its dependence on microclimatic and soil wetness conditions. Phys Chem Earth (B) 24:117–20.
Janssens IA, and 34 others. 2001. Productivity overshadows temperature in determining soil and ecosystem respiration across European forests. Global Change Biol 7:269 –78. Johnson LC, Shaver GR, Giblin AE, Nadelhoffer KJ, Rastetter ER, Laundre JA, Murray GL. 1996. Effects of drainage and temperature on carbon balance of tussock tundra micrcosms. Oecologia 108:737–48. Joiner DW, Lafleur PM, McCaughey JH, Bartlett PA. 1999. Interannual variability in corbon dioxide exchanges at a boreal wetland in the BOREAS northern study area. J Geophys Res 104:27,663–72. Kim J, Verma SB. 1992. Soil surface CO2 flux in a Minnesota peatland. Biogeochemistry 18:37–51.
Carroll P, Crill P. 1997. Carbon balance of a temperate poor fen. Global Biogeochem Cycles 11:349–56.
Lafleur PM, Griffis TJ, Rouse WR. 2001. Interannual variability in net ecosystem CO2exchange at the arctic treeline. Arctic Antarctic Alpine Res 33:149–57.
Chapman SJ, Kanda K, Tsuruta H, Minami K. 1996. Influence of temperature and oxygen availability on the flux of methane and carbon dioxide from wetlands: a comparison of peat and paddy soils. Soil Sci Plant Nutr 42:269–77.
Lafleur PM, McCaughey JH, Joiner DW, Bartlett PA, Jelinski DE. 1997. Seasonal trends in energy, water, and carbon dioxide fluxes at a northern boreal wetland. J Geophys Res 102: 29009–20.
Christensen TR, Jonasson S, Michelsen A, Callaghan TV, Havstrom M. 1998. Environmental controls on soil respiration in the Eurasian and Greenlandic Arctic. J Geophys Res 103: 15–29.
Lafleur PM, Roulet NT, Admiral SW. 2001. Annual cycle of CO2exchange at a bog peatland. J Geophys Res 106:3071–81.
Clymo RS. 1970. The growth of Sphagnum: methods of measurement. J Ecol 58:13–49.
McKenzie C, Schiff S, Aravena R, Kelly C, Louis VS. 1998. Effect of temperature on production of CH4 and CO2 from peat in a natural and flooded boreal forest wetland. Clim Change 40: 247–66.
Cox PM, Betts RA, Jones CD, Spall SA, Totterdell IJ. 2000. Acceleration of global warming due to carbon-cycle feedbacks in a coupled climate model. Nature 408:184–7.
Mertens S, Nijs I, Heuer M, Kockelbergh F, Beyens L, Van Kerckvoorde A, Impens I. 2001. Influence of high temperature on end-of-season tundra CO2 exchange. Ecosystems 4:226–36.
Variability in CO2 Exchange at a Large Peatland Moore TR, Bubier JL, Frolking S, Lafleur PM, Roulet NT. 2002. Plant biomass and production and CO2 exchange in an ombrotrophic bog. J Ecol 90:25–36. Moore TR, Dalva M. 1993. Influence of temperature and water table position on carbon dioxide and methane emissions from columns of peatland soils. J Soil Sci 44:651–64. Moore TR, Dalva M. 2001. Some controls on the production of dissolved organic carbon in soils. Soil Sci 166:38–47. Moore TR, Roulet NT, Waddington JM. 1998. Uncertainty in predicting the effect of climactic change on the carbon cycling of Canadian peatlands. Clim Change 40:229–45. Moore TR, Trofymow JA, Taylor B, Prescott C, Camire C, Duschene L, Fyles J, Kozak L, Kranabetter M, Morrison I, and others. 1999. Litter decomposition rates in Canadian forests. Global Change Biol 5:75– 82. Rapalee G, Trumbore SE, Davidson EA, Harden JW, Velduis H. 1998. Soil carbon stocks and their rates of accumulation and loss in a boreal forest landscape. Global Biogeochem Cycles 12:687–701. Roulet NT. 2000. Peatlands, carbon storage, greenhouse gases, and the Kyoto protocol: prospects and significance for Canada. Wetlands 20:605–15. Roulet NT, Crill PM, Comer NT, Dove A, Boubonniere RA. 1997. CO2 and CH4 flux between a boreal beaver pond and the atmosphere. J Geophys Res 102:29313–19. Roulet NT, Moore TR, Bubier J, Lafleur P. 1992. Northern fens: methane flux and climatic change. Tellus 44B:100–5. Scanlon D, Moore T. 2000. Carbon dioxide production from peatland soil profiles: the influence of temperature, oxic/anoxic conditions and substrate. Soil Sci 165:153–60. Schimel D, House JI, Hibbard KA, Bousquet P, Ciais P, Peylin P, Braswell BH, Apps MJ, Baker D, Bondeau A, and others. 2001. Recent patterns and mechanisms of carbon exchange by terrestrial ecosystems. Nature 414:169 –72. Schreader CP, Rouse WR, Griffis TJ, Boudreau LD, Blanken PD. 1998. Carbon dioxide fluxes in a northern fen during a hot, dry summer. Global Biogeochem Cycles 12:729–40. Shaver GR, Canadell J, Chapin FS III, Gurevitch J, Harte J, Henry G, Ineson P, Jonasson S, Melillo J, Pitelka L, and others. 2000. Global warming and terrestrial ecosystems: a conceptual framework for analysis. BioScience 50:871– 82. Shaver GR, Jonasson S. 1999. Response of arctic ecosystems to climate change: results of long-term field experiments in Sweden and Alaska. Polar Res 18:245–52. Shurpali NJ, Verma SB. 1998. Micrometerological measurements of methane flux in a Minnesota peatland during two growing seasons. Biogeochemistry 40:1–15. Shurpali NJ, Verma SB, Kim J. 1995. Carbon dioxide exchange in a peatland ecosystem. J Geophys Res 100:14319–26.
367
Silvola J, Alm J, Ahlholm U, Nykanen H, Martikainen PJ. 1996. CO2fluxes from peat in boreal mires under varying temperature and moisture conditions. J Ecol 84:219–28. Silvola J, Alm J, Ahlholm U, Nykanen H, Martikainen PJ. 1996. The contribution of plant roots to CO2 fluxes from organic soils. Biol Fertil Soils 23:126–31. Small E. 1972a. Photosynthetic rates in relation to nitrogen cycling as an adaptation to nutrient deficiency in peat bog plants. Can J Bot 50:2227–33. Small E. 1972b. Water relations of plants in raised Sphagnum peat bogs. Ecology 53:726–8. Sommerkorn M, Bolter M, Kappen L. 1999. Carbon dioxide fluxes of soils and mosses in wet tundra of Taimyr Peninsula, Siberia: controlling factors and contribution to net ecosystem fluxes. Polar Res 18:253–60. Thormann MN, Bayley SE. 1997. Decomposition along a moderate-rich fen-marsh peatland gradient in boreal Alberta, Canada. Wetlands 17:123–37. Thornley JHM, Cannell MGR. 2001. Soil carbon storage response to temperature: an hypothesis. Ann Bot 87:591–8. Thornley JHM, Johnson IR. 1990. Plant and crop modeling: a mathematical approach to plant and crop physiology. Oxford (UK): Clarendon. Turunen J, Tomppo E, Tolonen KAR. 2002. Estimating carbon accumulation rates of undrained mires in Finland—application to boreal and subarctic regions. Holocene 12:79–90. Updegraff K, Bridgham SD, Pastor J, Weishampel P, Harth C. 2001. Response of CO2 and CH4 emissions from peatlands to warming and water table manipulation. Ecol Appl 11:311–26. Updegraff K, Pastor J, Bridgham SD, Johnston CA. 1995. Environmental and substrate controls over carbon and nitrogen mineralization in northern wetlands. Ecol Appl 5:151–63. Valentini R, and 29 others. 2000. Respiration as the main determinant of carbon balance in European forests. Nature 404: 861– 4. Vance ED, Chapin FS III. 2001. Substrate limitations to microbial activity in taiga forest floors. Soil Biol Biochem 33:173–88. Waddington JM, Roulet NT. 2000. Carbon balance of a boreal patterned peatland. Global Change Biol 6:87–97. Weltzin JF, Pastor J, Harth C, Bridgham SD, Updegraff K, Chapin CT. 2000. Response of bog and fen plant communities to warming and water table manipulations. Ecology 81:3464–78. Whiting GJ, Chanton JP. 2001. Greenhouse carbon balance of wetlands: methane emission versus carbon sequestration. Tellus 53B:521–8. Wieder RK. 2001. Past, present, and future peatland carbon balance: an empirical model based on 210Pb-dated cores. Ecol Appl 11:327–42.