Aug 18, 2016 - treme cold indices, excepting the monthly maximum temperature minimum ... treme climatic events, such as heat waves and rainstorms, which ...
American Journal of Climate Change, 2016, 5, 360-372 Published Online September 2016 in SciRes. http://www.scirp.org/journal/ajcc http://dx.doi.org/10.4236/ajcc.2016.53027
Spatial and Temporal Variations of Extreme Climate Events in Xinjiang, China during 1961-2010 Xiangling Tang1*, Xin Lv2, Yineng Ouyang3 1
Geography Department, Natural Science of Shihezi University, Shihezi, China Production and Construction Corps, Xinjiang Key Laboratory of Oasis Ecological Agriculture, Shihezi, China 3 College of Science, Shihezi University, Shihezi, China 2
Received 19 March 2016; accepted 15 August 2016; published 18 August 2016 Copyright © 2016 by authors and Scientific Research Publishing Inc. This work is licensed under the Creative Commons Attribution International License (CC BY). http://creativecommons.org/licenses/by/4.0/
Abstract Daily maximum/minimum temperature and precipitation data from 35 weather stations in Xinjiang during 1961-2010 were examined using kriging spatial analysis, linear tendency estimation, and correlation analysis. Temporal trends and spatial distribution patterns of extreme temperature and precipitation in this area were then analyzed using 12 extreme temperature and 7 extreme precipitation indices. The following results were obtained. 1) Over the past 50 years, extreme cold indices, excepting the monthly maximum temperature minimum value and monthly extreme minimum temperature, showed slight decreasing trends. These indices include the maximum number of consecutive frost days, icy days, cold-nighttime days, and cold-daytime days. 2) Extreme warm events generally showed significant increasing trends (P < 0.01), including the indices of summertime days, warm-nighttime days, warm-daytime days, monthly extreme maximum temperature, and monthly minimum temperature maximum value. 3) The spatial distributions of threshold values of extreme warm and cold events showed notable regional differences. A reducing trend of extreme cold events and an increase in extreme warm events has occurred mainly in northern Xinjiang. 4) For the past 50 years, six extreme precipitation indices, aside from consecutive dry days, showed significant increasing trends in Xinjiang (P < 0.05) and notable differences in spatial distribution. The increase in extreme precipitation events was more rapid at northern than at southern sites. Extreme precipitation intensity was greater in mountainous areas, and precipitation frequency increased in the plain region. 5) Factor analysis revealed good correlations among extreme temperature indices, excepting extreme temperature days.
Keywords Xinjiang Area, Extreme Climatic Event, Spatial Change *
Corresponding author.
How to cite this paper: Tang, X.L., Lv, X. and Ouyang, Y.N. (2016) Spatial and Temporal Variations of Extreme Climate Events in Xinjiang, China during 1961-2010. American Journal of Climate Change, 5, 360-372. http://dx.doi.org/10.4236/ajcc.2016.53027
X. L. Tang et al.
1. Introduction
At present, no doubt exists about global warming. The fourth assessment report of the Intergovernmental Panel on Climate Change [1] identified a warming trend of 0.13˚C/10a over the past 50 years. The warming trend in China has been 0.22˚C/10a [2], with significant increases in annual mean temperature and heating rate [3]. The increasing mean temperature not only affects the change in extreme temperature values, but can also leads to extreme climatic events, such as heat waves and rainstorms, which show trends of increasing frequency, strength, and intensity [4]. Many studies have indicated that frequent extreme climatic events cause huge losses for society and the economy, as well as loss of human lives [5]. The most recent statistics reveal an increase of up to 10-fold in the economic loss arising from global climatic change and related extreme climatic events over the past 40 years. In China, weather disasters caused by extreme climatic events account for 70% of all natural hazards [6]. Hence, extreme climatic events are sources of widespread concern for governments and researchers [7] [8]. Studies of changes in these events are necessary not only to guarantee state security and economic development, but also to prevent disasters, reduce damage-related needs, and, most importantly, safeguard people’s safety and livelihoods. Xinjiang, located far from the ocean in the center of Eurasia, in the border region of northwestern China, is impacted by the uplifted Tibetan Plateau, westerly wind circulation effects, and high mountain landforms. This region is thus an important route by which cold air invades China, and has a diverse climate. Northern Xinjiang has a variable continental arid and semi-arid climate, whereas southern Xinjiang has a warm continental arid climate; the ecology of these regions is fragile and has suffered greatly under the influence of climatic change [9]-[12]. In recent years, large studies have investigated the spatial and temporal distribution of and variation in extreme precipitation in Xinjiang [13]. These studies are of great importance for attaining a correct understanding of climatic variation in this region. However, most previous studies have considered single meteorological elements, such as temperature or precipitation in southern or northern Xinjiang, and discrepancies exist in the length of time represented by meteorological data and stations from which they were collected. Hence, this study was conducted using internationally recognized extreme climatic indices to examine long-term trends of change in extreme climatic events and their spatial distribution patterns, as well as problems existing in the whole of Xinjiang that have actual reference value for economic development and response to climatic disasters in the future.
2. Research Data and Methods 2.1. Research Data Source and Treatment Daily precipitation and maximum, minimum, and mean temperature data from China’s Meteorological Administration for the period 1961-2010 in Xinjiang were used for this study. Data from 43 meteorological stations were reviewed to identify problems with missing or misdetected observations. We selected high-quality data from 35 stations (Table 1, Figure 1) as the study target. For missing and misdetected data from stations with less complete records, we used corrected data from Bai Lei et al. [14].
2.2. Study Method The standards used to define and calculate the extreme climatic indices used in this study were based on the World Meteorological Organization’s Commission for Climatology World Climate Research and Climatic Variation and Predictability programs’ expert team on climate change detection, monitoring, and indices [15]. This methodology has been applied to many countries and regions [16], including Xinjiang. Using RClimDex software (http://cccma.seos.uvic.ca/ETCCDMI/), 19 extreme climatic indices (7 related to precipitation and 12 related to temperature) were developed and applied (Table 2). All of the extreme climate indices reflect three aspects of temperature or precipitation events: strength, frequency, and temporal duration of climatic change. In extreme climate research, a certain percentile value is usually adopted as a threshold (with values exceeding it defined as extreme), and calculations are performed according to the nonparametric method of Bonsal et al. [17], as follows: for a meteorological factor with N values, these values are sorted in ascending order (X1, X2, …, Xm, …, XN); the probability that a certain value is less than or equal to the rank of Xm is then P = (m − 0.31)/(N + 0.38), where P denotes percentile, m is the serial number
361
X. L. Tang et al.
of Xm, and N is the number of meteorological values. In this study, percentile values were used to calculate relative and other indices. Specifically, temperature data were sorted in ascending order, and the 90th and 10th percentile values were regarded as thresholds for extreme temperature. When the highest temperature on a given day exceeded the 90th percentile value, an extreme high-temperature event was considered to have occurred on that day; when the highest temperature on a given day was less than the 10th percentile value, an extreme low-temperature event was considered to have occurred. Secondly, we analyzed extreme climatic events using linear tendency estimation, the Mann-Kendall method, and the kriging method of spatial analysis. Table 1. Site meteorological information in the study area. No.
Station
Longitude (˚E)
Latitude (˚N)
Elevation (m)
Period of series
1
Habahe
86.40
48.05
532.6
1961.01.01-2010.12.31
2
Jimunai
85.87
47.43
984.1
1961.01.01-2010.12.31
3
Fuai
87.47
47.12
500.9
1961.01.01-2010.12.31
4
Aletai
88.08
47.73
735.3
1961.01.01-2010.12.31
5
Fuyun
89.52
46.98
807.5
1961.01.01-2010.12.31
6
Qinghe
90.38
46.67
1218.2
1961.01.01-2010.12.31
7
Alashankou
82.57
45.18
336.1
1961.01.01-2010.12.31
8
Tuoli
83.60
45.93
1077.8
1961.01.01-2010.12.31
9
Beitashan
90.53
45.37
1653.7
1961.01.01-2010.12.31
10
Caijiahu
87.53
44.20
440.5
1961.01.01-2010.12.31
11
Qitai
89.57
44.02
793.5
1961.01.01-2010.12.31
12
Yinning
81.33
43.95
662.5
1961.01.01-2010.12.31
13
Zhaosu
81.13
43.15
1851.0
1961.01.01-2010.12.31
14
Baluntai
86.30
42.73
1739.0
1961.01.01-2010.12.31
15
Kumishi
88.22
42.23
922.4
1961.01.01-2010.12.31
16
Bayinbuluke
84.15
43.03
2458.0
1961.01.01-2010.12.31
17
Tulufan
89.20
42.93
34.5
1961.01.01-2010.12.31
18
Akesu
80.23
41.17
1103.8
1961.01.01-2010.12.31
19
Baicheng
81.90
41.78
1229.2
1961.01.01-2010.12.31
20
Luntai
84.25
41.78
976.1
1961.01.01-2010.12.31
21
Kuerle
86.13
41.75
931.5
1961.01.01-2010.12.31
22
Tuergate
75.40
40.52
3504.4
1961.01.01-2010.12.31
23
Wuqia
75.25
39.72
2175.7
1961.01.01-2010.12.31
24
Kashi
75.98
39.47
1289.4
1961.01.01-2010.12.31
25
Aheqi
78.45
40.93
1984.9
1961.01.01-2010.12.31
26
Alaer
81.27
40.55
1012.2
1961.01.01-2010.12.31
27
Ruoqiang
88.17
39.03
887.7
1961.01.01-2010.12.31
28
Shache
77.27
38.43
1231.2
1961.01.01-2010.12.31
29
Pishan
78.28
37.62
1375.4
1961.01.01-2010.12.31
30
Hetian
79.93
37.13
1375.0
1961.01.01-2010.12.31
31
Minfeng
82.72
37.07
1409.5
1961.01.01-2010.12.31
32
Qiemo
85.55
38.15
1247.2
1961.01.01-2010.12.31
33
Balikun
93.00
43.60
1677.2
1961.01.01-2010.12.31
34
Yiwu
94.70
43.27
1728.6
1961.01.01-2010.12.31
35
Hongliuhe
94.67
41.53
1573.8
1961.01.01-2010.12.31
362
X. L. Tang et al.
Figure 1. Distribution of meteorological stations in Xinjiang. Table 2. Definition of extreme temperature and precipitation indices. Index
Descriptive name
Definition
TXx
Warmest day
Annual highest TX
˚C
TNx
Warmest night
Annual highest TN
˚C
TXn
Coldest day
Annual lowest TX
˚C
TNn
Coldest night
Annual lowest TN
TN10p TX10p
Cold night frequency Cold day frequency
TN90p
Warm night frequency
˚C th
d
th
d
th
d
th
Percentage of days when TN < 10 percentile of 1961-1990 Percentage of days when TX < 10 percentile of 1961-1990
Temperature
Precipitation
Unit
Percentage of days when TN > 90 percentile of 1961-1990
TX90p
Warm day frequency
Percentage of days when TX > 90 percentile of 1961-1990
d
FD
Frost days
Annual count when TN < 0˚C
d
ID
Ice days
Annual count when TX < 0˚C
d
SU25
Summer days
the highest temperature is over 25˚C day number
d
DTR
Diurnal temperature range
Annual mean difference between TX and TN
˚C
SDII
Simple daily intensity index
Average precipitation on wet days
Mm/d
PRCPTOT
Wet day precipitation
Annual total precipitation from wet days
mm
RX1day
Maximum 1-day precipitation
Annual maximum 1-day precipitation
mm
RX5day
Maximum 5-day precipitation
Annual maximum consecutive 5-day precipitation
mm
CDD
Consecutive dry days
Maximum number of consecutive dry days
d
CWD
Consecutive wet days
Maximum number of consecutive wet days
d
Very wet day precipitation
Annual total precipitation when RR > 95th percentile of 1961-1990 daily precipitation
mm
R95p
Notes: aAll the indices are calculated by RCLimDEX. Abbreviations are as follows: TX, daily maximum temperature; TN, daily minimum temperature; TG, daily mean temperature; RR, daily precipitation. A wet day is defined when RR ≥ 0.1 mm, and a dry day is defined when RR < 0.1 mm. Indices are included for completeness but are not analyzed further in this article.
363
X. L. Tang et al.
3. Changes in Extreme Temperature Events in Xinjiang over the Past 50 Years 3.1. Interannual Variation in Extreme Cold Events
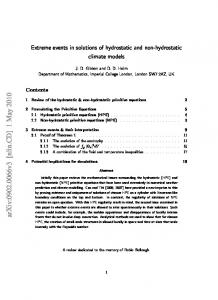
Consistent with global changes, the frequency of extreme low-temperature events in the Xinjiang area was found to have decreased while that of extreme high-temperature events increased [18]. Linear variation in extreme cold indices in Xinjiang over the past 50 years generally showed a decreasing curvilinear trend (Figure 2). The interannual variation tendency rates for the maximum numbers of continuous frost days (FDs), icy days (IDs), cold-nighttime days (TN10p), and cold-daytime days (TX10p) were −4.8 d/10a, −2.75 d/10a, −2.24 d/10a, and −0.88 d/10a, respectively (all α ≤ 0.01), and their correlation coefficients by year were −0.774, −0.475, −0.827, and −0.39, respectively (Table 3).
(Note: the straight line means linear fitting trend line, the smooth curve is moving average value in 5 years, attached mark is actual test value)
Figure 2. Regional annual anomalies series during 1961-2010 for indices of cold extremes.
364
Table 3. The extreme temperature mean value (˚C or d) and change range [˚C/10a)/or d/(10a)].
X. L. Tang et al.
Standard difference
Change tendency rate
Over the years
The 1960s
The 1970s
The 1980s
The 1990s
From the year of 2000s
FD
10.05
4.8
162.64
169.88
167.47
166.69
162.18
146.78
ID
8.85
2.75
68.799
72.07
73.8
69.3
67.8
60.9
TXn
3.29
0.16
−14.917
−15.8
−15
−13.3
−12.8
−17.8
Index
Average value
TNn
3.01
0.505
−26.504
−27.8
−27.4
−24.7
−24.2
−28.4
TN10
3.88
2.237
8.44
12.7
11.1
8.1
6.4
3.9
TX10
2.81
0.879
9.54
10.4
10.9
10
8.9
7.5
The monthly maximum temperature minimum value (TXn) and monthly extreme minimum temperature (TNn) showed increasing trends, with interannual variation tendency rates of 0.16˚C/10a and 0.505˚C/10a, respectively, although these trends were not significant (α > 0.05). The correlation coefficients of TXn and TNn by year were −0.133 and 0.042, indicating significant warming, especially on low-temperature days, the frequency of which has decreased over time.
3.2. Spatial Variation in Extreme Cold Events Against the background of global warming, the extreme cold indices generally showed decreasing trends over the past 50 years, but changes in these indices were characterized by spatial variation (Figure 3). Change tendency rates of continuous FD ranged from −7.8 to −2.0 d/10a and displayed significant decreasing trends at about 91.4% of all stations (only 2.8% of stations showed increasing trends or no obvious trend). Variation tendency rates for IDs ranged from −4.0 to −1.5 d/10a, and were