Spatial and temporal variations of Zostera marina meadows in Brittany: relationship between habitat complexity and macrofaunal diversity Boyé A., Legendre P., Grall J., Gauthier O.
[email protected]
ISOBAY XV – 23/06/16
1
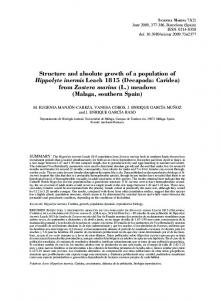
Seagrass meadows: rich and precious habitat
20
15
10
Modified from Duffy et al.,2006
❈ Sediment stability ❈ Wave dampening ❈ Nutrient cycling and water filtering ❈ Carbon sequestration ❈ Nurseries ❈ High abundances and diversity
5
0
Modified from Orth et al.,2006 2
Seagrass meadows: rich and precious habitat
Modified from Duffy et al.,2006
❈ Sediment stability ❈ Wave dampening ❈ Nutrient cycling and water filtering ❈ Carbon sequestration ❈ Nurseries ❈ High abundances and diversity
❈ Habitat fragmentation ❈ Eutrophication ❈ Global change ❈ Introduced species ❈ Wasting disease 2
Scales affecting seagrass macrofaunal communities Seagrass characteristics ❈ Leaf surface ❈ Sheath height ❈ Epiphytes
Shoot
❈ Shoot density
m2
❈ Meadow size ❈ Fragmentation
Alloncle et al., 2005
Meadow Bay Region 3
Scales affecting seagrass macrofaunal communities Seagrass characteristics ❈ Leaf surface ❈ Sheath height ❈ Epiphytes
Shoot
Shoot
❈ Shoot density
m2
m2
Meadow
Meadow
Bay
Bay
Region
Region
❈ Meadow size ❈ Fragmentation
Alloncle et al., 2005
Abiotic condition
3
Scales affecting seagrass macrofaunal communities Seagrass characteristics ❈ Leaf surface ❈ Sheath height ❈ Epiphytes
Shoot
Shoot
❈ Shoot density
m2
m2
Meadow
Meadow
Bay
Bay
Region
Region
❈ Meadow size ❈ Fragmentation
Alloncle et al., 2005
Abiotic condition
3
Scales affecting seagrass macrofaunal communities Seagrass characteristics ❈ Leaf surface ❈ Sheath height ❈ Epiphytes
Shoot
Shoot
❈ Shoot density
m2
m2
Meadow
Meadow
Bay
Bay
Region
Region
❈ Meadow size ❈ Fragmentation
Alloncle et al., 2005
Abiotic condition
3
Outline of the talk
)❩ Seagrass monitoring, the REBENT monitoring program
)❩ How does endofauna interact with seagrass structure? Epifauna, drivers of the regional β diversity and link with habitat complexity
)❩
4
REBENT monitoring program
»
Location
»
Methodology
5
REBENT monitoring program
»
Location
»
Methodology
• 8 sites • 5 years
6
REBENT monitoring program
»
Location
»
Methodology
• 8 sites • 5 years • 720 samples • 460 taxa • More than 306 500 individuals
6
REBENT monitoring program ❈ Field sampling ❈ Complementary environmental data
»
Location
»
Methodology
Seagrass bed Point 1
Point 2
Point 3
Density and biometry Endofauna
10 shoots for epiphytes
Epifauna
Granulometry Organic Matter
7
REBENT monitoring program
»
Location
»
Methodology
Seagrass bed
❈ Field sampling ❈ Complementary environmental data
Point 1
Point 2
Point 3
Density and biometry
Sea T°C Salinity Currents
Endofauna
10 shoots for epiphytes
Epifauna
Granulometry Organic Matter
Tide
T°C
Rain
Wind NAO 7
REBENT monitoring program
»
Environmental conditions
❈ Granulometry
8
REBENT monitoring program ❈ Granulometry
»
Environmental conditions ❈ Hydro-climatic conditions
8
REBENT monitoring program ❈ Granulometry
»
Environmental conditions ❈ Hydro-climatic conditions T°C variability
8
REBENT monitoring program ❈ Granulometry
»
Environmental conditions ❈ Hydro-climatic conditions T°C variability
8
REBENT monitoring program ❈ Granulometry
»
Environmental conditions ❈ Hydro-climatic conditions
Multiple environmental gradients superimposing ➥ effect on Zostera marina and its associated fauna? 8
REBENT monitoring program Hellinger transformed
» Endofauna
Diversity patterns
Epifauna
➥ Similar patterns with a main gradient ➥ Marked differences for 3 sites for endofauna 9
REBENT monitoring program
»
Location
»
Methodology
Sites
Species
Sites
Environment
10
REBENT monitoring program
»
Location
»
Methodology
Species
Sites
Hellinger transformed
Redundancy analysis
Variance partitioning
Sites
Environment
10
REBENT monitoring program
»
Location
»
Methodology
Species Redundancy analysis
Sites
Hellinger transformed
Variance partitioning Environment Stepwise selection
Sites
Sites
Environment
10
REBENT monitoring program
»
Location
»
Methodology
Species Redundancy analysis
Sites
Hellinger transformed
Variance partitioning Environment Stepwise selection
Sites
Sites
Environment
10
Outline of the talk
)❩ Seagrass monitoring, the REBENT monitoring program
)❩ How does endofauna interact with seagrass structure? Epifauna, drivers of the regional β diversity and link with habitat complexity
)❩
11
Endofauna
»
Environmental drivers
»
Differentiating species
12
Endofauna
»
Environmental drivers
»
Differentiating species
Mud & gravel
Sand
12
Endofauna
»
Environmental drivers
»
Differentiating species
Mud & gravel
Sand Stable conditions
Variable T°C
12
Endofauna
»
Environmental drivers
»
Differentiating species
Mud & gravel
Sand Stable conditions
Variable T°C Main distinction induced by abiotic gradients 12
Endofauna
»
Environmental drivers
»
Differentiating species
Mud & gravel
?
Sand Stable conditions
Variable T°C Main distinction induced by abiotic gradients 12
Endofauna
»
Environmental drivers
»
Differentiating species
Mud & gravel High leaf surface area Sand Stable conditions Low leaf surface area Variable T°C Main distinction induced by abiotic gradients But influence of seagrass leaf cover 12
Endofauna
»
Environmental drivers
»
Differentiating species
Main distinction induced by abiotic gradients But influence of seagrass leaf cover 12
Endofauna
»
Environmental drivers
»
Differentiating species
Main distinction induced by abiotic gradients But influence of seagrass leaf cover 12
Endofauna
»
Environmental drivers
»
Differentiating species
Main distinction induced by abiotic gradients But influence of seagrass leaf cover 12
Endofauna
»
Environmental drivers
»
Differentiating species
12
Endofauna
»
Environmental drivers
»
Differentiating species
Roscanvel
Sept-Iles
Mud
Gravel
12
Endofauna
»
Environmental drivers
»
Differentiating species
Roscanvel
Sept-Iles
Mud
Gravel
➥ developed leaf surface area Spatial arrangement and structural complexity of Zostera marina is not the main controlling factor 12
Endofauna
»
Environmental drivers
»
Differentiating species
Mud & gravel High leaf surface area Sandy Stable conditions Low leaf surface area Variable T°C Main controlling factors are abiotic at the regional scale but influence of seagrass through leaf cover ➥ detrital pathway ➥ water retention at low tide ➥ interaction with epifauna
12
Endofauna
»
Environmental drivers
»
Differentiating species
Main controlling factors are abiotic at the regional scale but influence of seagrass through leaf cover ➥ detrital pathway ➥ water retention at low tide ➥ interaction with epifauna
13
Outline of the talk
)❩ Seagrass monitoring, the REBENT monitoring program
)❩ How does endofauna interact with seagrass structure? Epifauna, drivers of the regional β diversity and link with habitat complexity
)❩
14
Epifauna
»
Environmental drivers
»
Differentiating species
15
Epifauna
»
Environmental drivers
»
Differentiating species
Mud & gravel
Sand
High leaf surface area
Low leaf surface area
15
Epifauna
»
Environmental drivers
»
Mud & gravel High leaf surface area
Differentiating species
Sand Stable conditions
Low leaf Variable surface area T°C
15
Epifauna
»
Environmental drivers
»
Differentiating species
Mud & gravel High leaf surface area
Sand Stable conditions
Low leaf Variable surface area T°C
Same gradients as for endofauna but a main pattern induced by seagrass cover 15
Epifauna
»
Environmental drivers
»
Differentiating species
Same gradients as for endofauna but a main pattern induced by seagrass cover 15
Comparison of the community drivers Endofauna
Total = 59%
Epifauna
Total = 56%
Empty intersections are 0 values 16
Comparison of the community drivers Endofauna
Total = 59%
Epifauna
Total = 56%
Empty intersections are 0 values 16
Comparison of the community drivers Endofauna
Total = 59%
Epifauna
Total = 56%
Empty intersections are 0 values 16
Comparison of the community drivers Endofauna
Total = 59%
Epifauna
Total = 56%
Empty intersections are 0 values 16
Comparison of the community drivers Endofauna
Total = 59%
Epifauna
Total = 56%
Empty intersections are 0 values 16
Comparison of the community drivers Endofauna
Total = 59%
Epifauna
Total = 56%
Empty intersections are 0 values 16
Conclusion
At the regional scale, endofaunal and epifaunal communities of seagrass meadows are primarily controlled by abiotic factors
Seagrass characteristics have a significant effect on communities that is expressed through leaf surface area and not structural complexity
17
Perspectives
Separate the direct effects of environment from those mediated through changes in seagrass meadow
Analyse the link between diversity and complexity
Life trait analysis 17
Thank you for your attention
[email protected]
M
es
ite
er
st
e
t
o
lo
al
al
M
C
G le na n
M ar gu
ue
en
nv el
ol
os ca
pt -Il
Ar co
R
Se
Density (Shoot/m2)
Leaf biomass per shoot (g/shoot)
Leaf surface area (m2)
APPENDIX
0.125
0.100
0.075
0.050
0.025
1.00
0.75
0.50
0.25
0.00 1250
1000
750
500
250
19
APPENDIX
55
APPENDIX
56