RESEARCH ARTICLE
Spatial distribution of child pedestrian injuries along census tract boundaries: Implications for identifying area-based correlates Jacqueline W. Curtis* GIS Health & Hazards Lab, Department of Geography, Kent State University, Kent, Ohio, United States of America *
[email protected]
Abstract a1111111111 a1111111111 a1111111111 a1111111111 a1111111111
OPEN ACCESS Citation: Curtis JW (2017) Spatial distribution of child pedestrian injuries along census tract boundaries: Implications for identifying area-based correlates. PLoS ONE 12(6): e0179331. https://doi. org/10.1371/journal.pone.0179331 Editor: Catherine Staton, Duke University, UNITED STATES Received: December 13, 2016 Accepted: May 26, 2017 Published: June 14, 2017 Copyright: © 2017 Jacqueline W. Curtis. This is an open access article distributed under the terms of the Creative Commons Attribution License, which permits unrestricted use, distribution, and reproduction in any medium, provided the original author and source are credited. Data Availability Statement: All relevant data are provided in the Supporting Information file named "S1 File".
Census tracts are often used to investigate area-based correlates of a variety of health outcomes. This approach has been shown to be valuable in understanding the ways that health is shaped by place and to design appropriate interventions that account for community-level processes. Following this line of inquiry, it is common in the study of pedestrian injuries to aggregate the point level locations of these injuries to the census tracts in which they occur. Such aggregation enables investigation of the relationships between a range of socioeconomic variables and areas of notably high or low incidence. This study reports on the spatial distribution of child pedestrian injuries in a mid-sized U.S. city over a three-year period. Utilizing a combination of geospatial approaches, Near Analysis, Kernel Density Estimation, and Local Moran’s I, enables identification, visualization, and quantification of close proximity between incidents and tract boundaries. Specifically, results reveal that nearly half of the 100 incidents occur within roads that are also census tract boundaries. Results also uncover incidents that occur on tract boundaries, not merely near them. This geographic pattern raises the question of the utility of associating area-based census data from any one tract to the injuries occurring in these border zones. Furthermore, using a standard spatial join technique in a Geographic Information System (GIS), these points located on the border are counted as falling into census tracts on both sides of the boundary, which introduces uncertainty in any subsequent analysis. Therefore, two additional approaches of aggregating points to polygons were tested in this study. Results differ with each approach, but without any alert of such differences to the GIS user. This finding raises a fundamental concern about techniques through which points are aggregated to polygons in any study using point level incidents and their surrounding census tract socioeconomic data to understand health and place. This study concludes with a suggested protocol to test for this source of uncertainty in analysis and an approach that may remove it.
Funding: The author received no specific funding for this work. Competing interests: The author has declared that no competing interests exist.
PLOS ONE | https://doi.org/10.1371/journal.pone.0179331 June 14, 2017
1 / 14
Spatial distribution of child pedestrian injuries along census tract boundaries
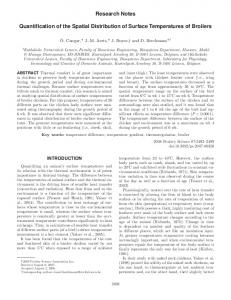
Introduction Many studies report a relationship between area-based socio-economic characteristics and injury [1–9] and the census tract is often the geographic unit in which these relationships are operationalized [10]. In particular, understanding of child pedestrian injuries has been advanced through such linkages, [11–15], which are more recently being facilitated through use of Geographic Information Systems (GIS) [16–22]. In such studies, it is standard to overlay a) points of incidents with b) census tracts. The points are then aggregated to the census tract in which they are located through a spatial join technique. Once the data are aggregated in this way, they can then be normalized by an appropriate denominator and analyzed with statistical approaches to show relationships between outcomes and their socioeconomic context. This technique of aggregating points to the polygons in which they occur, spatial join, is generally performed using one of four options depending on the data being utilized and the objectives of data manipulation. Using ArcGIS terminology [23], these options are: 1) Points to Polygons: Each polygon is appended with a summary of the numeric attribute of the points that fall inside it, and a count field of the points that fall inside it. 2) Points to Polygons: Each polygon is appended with the attributes of the point that is closest to its boundary, and a distance field showing how close the point is. 3) Polygons to Points: Each point is appended with the attributes of the polygon that it falls inside. 4) Polygons to Points: Each point is appended with the attributes of the polygon that is closest to it. For numerous studies of health and place where outcomes or events are represented as points and the place is represented by tracts, Option 1 is the standard approach. This is the most intuitive way to achieve a count of points in each polygon. In addition to enabling quantitative analysis with census variables, this data transformation has the benefits of improved visualization of spatial patterns and spatial confidentiality. For example, when looking at a point layer of many types of health outcomes in a city, it is difficult to make sense of their geographic distribution, depending on the data and scale of observation. One efficient way to quickly see areas of high versus low occurrence is to aggregate the points to some underlying administrative boundary and create a choropleth map. Furthermore, such a map has the added effect of masking the locations of individual outcomes, which is particularly important if the points represent residential locations. For these reasons of intuitiveness, visualization, and confidentiality, Option 1 is the standard approach for aggregating points to polygons. To date, there has been no reason to question its validity. This study was originally designed to include such a traditional analysis of area-based correlates of child pedestrian injury. However, in the process of initial mapping and aggregating point level incidents to their associated census tracts, two unexpected outcomes resulted. First, a striking geographic pattern was observed where many of these points were close to or even apparently on tract boundaries (Fig 1). Second, after aggregating these points to the census tracts in which they fall inside, the total number of incidents for the tracts was greater than the number of incident points. This observation suggests that the spatial join approach so widely used to aggregate points to polygons counts some points as falling inside more than one polygon. However, there is no indication to the user of this occurrence or where these multiple counts are located. While such a coupling of incidents to tract boundaries is not expected in many health outcomes, pedestrian injuries are an exception. These events occur within or very near roads, and roads serve as one form of census tract boundary. If these points along the boundaries are being counted as falling inside all tracts that share this boundary, it is likely that these census tracts are being identified as having substantially high numbers of incidents based on what occurs at the outer fringes of these units.
PLOS ONE | https://doi.org/10.1371/journal.pone.0179331 June 14, 2017
2 / 14
Spatial distribution of child pedestrian injuries along census tract boundaries
Fig 1. Example of close proximity of points to census tract boundaries. https://doi.org/10.1371/journal.pone.0179331.g001
Therefore, the aim of this study is to a) demonstrate the spatial distribution of child pedestrian injury incidents along census tract boundaries and then to b) test the implications of this specific geographic pattern in aggregating the point locations to the census tract in which they are located. The study concludes with a suggested protocol for avoiding the potential uncertainty that this pattern can introduce in examining area-based correlates and an approach that removes such uncertainty.
Materials and methods Data Police incident data on pedestrian-motor vehicle crashes in a mid-sized Ohio city occurring between January 1, 2013 and December 31, 2015 were acquired [S1 File]. In this 3-year period, 327 incidents were reported. Age of the pedestrian was reported for all but one incident (Table 1). All 100 incidents involving children had an accompanying x,y coordinate for the location of occurrence. The census tract boundary file created for the 2010 U.S. Census was acquired for the study area and both datasets (incidents and census tracts) were mapped in ArcGIS 10.4 [23]. Once in the GIS, the data were transformed from a geographic coordinate system in the North American Datum 1983 (GCS NAD 83) to Universal Transverse Mercator projection (UTM Zone 17 N) for analysis. Table 1. Summary of the data by year. YEAR
NUMBER OF REPORTED INCIDENTS
NUMBER OF INCIDENTS—VICTIM 18 YEARS OR YOUNGER
PERCENTAGE OF INCIDENTS– VICTIM 18 YEARS OR YOUNGER
2013
99
30
33%
2014
104
30
29%
2015
123
40
33%
https://doi.org/10.1371/journal.pone.0179331.t001
PLOS ONE | https://doi.org/10.1371/journal.pone.0179331 June 14, 2017
3 / 14
Spatial distribution of child pedestrian injuries along census tract boundaries
Analysis The spatial relationship between injury incidents and tract boundaries was first investigated using Near Analysis. First, census tracts were converted from polygons to lines using the Polygon to Line tool, a Geoprocessing Tool under Data Management > Features. Then, the distance between each incident and its nearest line (tract boundary) was calculated using Near Analysis under Analysis Tools > Proximity > Near. This approach created a new field in the incident attribute table labeled “NEAR_DIST”. As these calculations were conducted in UTM projection, results are reported in meters. To identify clusters in these data, a) Kernel Density Estimation (KDE) was performed and b) the “NEAR_DIST” values were used as weights when calculating spatial autocorrelation [24] with close distances being more heavily weighted. These approaches enable visualization of specific areas where incidents are located on or near census tract boundaries and would therefore raise concern about linkage with tract level socioeconomic variables in these places. To further investigate how points are assigned to polygons based on location, especially in border regions, three relevant approaches were tested: Option 1 (standard approach), Option3, and Option 4. Option 2 is not tested as the output from this process does not result in the ability to count the number of points within each polygon. These data and methods address the aims of this study to a) demonstrate the spatial distribution of child pedestrian injury incidents along census tract boundaries and then to b) test the implications of this specific geographic pattern in aggregating the point locations to the census tract in which they are located.
Results Near analysis, hot spots, and spatial autocorrelation Near analysis results in a range of incidents located from 0–633.48m from a census tract boundary, with an Interquartile Range (IQR) of 215.90m. Twelve of these points have a value of 0m. Fig 2 provides a summary of the distances of each incident to its nearest census tract boundary. Furthermore, street widths were measured to identify a zone of census tract change, where the distance of the incident from the boundary is greater than zero, but still in close proximity. Based on these measurements, 30m was selected as a representative street zone of transition between tracts. Using this measure, all incidents were selected with a NEAR_DIST value of 30m or less. Forty-six incidents (46%) occurred within this zone of a census tract change and all of these points are 11m or closer to the boundary. Fig 3 illustrates the distribution of the points that are within a street width distance of the boundary. These results identify a preponderance of incidents occurring just at the boundary from one census tract to another, and with some being located directly on the boundary itself. However, it is not enough to know that this pattern exists, but also where (e.g., is it present across the study area or only in a certain places), and what it portends for linking child pedestrian injury locations to their surrounding socioeconomic context. Therefore, KDE was used to visualize the presence of hot spots and then Local Moran’s I was employed test the significance in clustering of these border and near-border incidents. KDE (800m bandwidth) revealed that these intersecting or near-intersecting points are concentrated in the northeast quadrant of the study area (Fig 4), with smaller pockets distributed throughout the city. In order to quantify the significance of this pattern of apparent clustering, Local Moran’s I was calculated using a fixed distance threshold of 3200m to ensure a minimum number of neighbors in the analysis and the distance calculated from the Near_Dist approach were used as weights.
PLOS ONE | https://doi.org/10.1371/journal.pone.0179331 June 14, 2017
4 / 14
Spatial distribution of child pedestrian injuries along census tract boundaries
Fig 2. Results of near analysis: Number of incidents within specified distances from nearest census tract boundary. https://doi.org/10.1371/journal.pone.0179331.g002
However, no areas met the criteria of statistical significance (p