Plant, Cell and Environment (1998) 21, 149–158
ORIGINAL ARTICLE
OA
220
EN
Spatial distributions of tissue expansion and cell division rates are related to irradiance and to sugar content in the growing zone of maize roots B. MULLER,* M. STOSSER & F. TARDIEU Laboratoire d’Ecophysiologie des Plantes sous Stress Environnementaux, ENSA-M/INRA, place Viala, 34060 Montpellier cedex, France
ABSTRACT We have investigated the way in which the radiation absorbed by leaves affects the rate of elongation of maize (Zea mays L.) roots. In five repeated growth chamber experiments, plants previously grown at a photon irradiance of 23 mol m–2 d–1 received either 7 or 34 mol m–2 d–1 from day 10 to day 20 after germination. The elongation rate of primary roots steadily decreased for 4 d after reduction in irradiance and then stabilized at 60% of that in plants at high irradiance. The elongating zone was slightly shorter after 2 d at low irradiance, and was further reduced after 8 d. The concentrations of sucrose and glucose in the elongating zone were greatly decreased after 2 d at low irradiance and the gradient of both sugars was suppressed. The longer period at low irradiance affected neither sugar content nor gradient. In the same way, cell production rate was reduced after 2 d at low irradiance and was not appreciably decreased afterwards. The root zone with cell division was shorter in plants at low irradiance, but cell division rate remained nearly constant temporally and spatially, and was unaffected by the irradiance treatment. Our results suggest that primary events after a reduction in irradiance were a change in cell flux and sugar content in the elongating zone. Change in elongation rate was slower and probably the result of a time-related developmental effect, which may be related to the change in cell production. Key-words: cell division; irradiance; maize; meristem; root elongation; sugars; tissue expansion.
INTRODUCTION In most models, growth of a root system depends on the availability of carbon to the roots (e.g. Jones & Kiniry 1986). The physiological bases for this dependence have been established in experiments in which incident radiation or air CO2 concentration were varied, or in which source–sink relationships were affected. Root elongation rate responds to intercepted radiation each day (Webb Correspondence: Bertrand Muller. Fax: +83 (0) 467 522116; e-mail:
[email protected] © 1998 Blackwell Science Ltd
1976; Aguirrezabal, Deléens & Tardieu 1994), so root length is related to cumulative intercepted radiation (e.g. Aresta & Fukai 1984; Vincent & Gregory 1989). In wheat plants 1 d after leaf pruning, the elongation rate of the seminal axis is decreased by 75%, while laterals have almost stopped elongating (Bingham & Stevenson 1993). In the same way, root elongation rate decreases rapidly in Hevea brasiliensis during rapid shoot growth and resumes expansion when the shoot growth rate declines (Thaler & Pagès 1996a). These results suggest that the buffering capacity of the root system against changes in carbon availability is low, and that root growth depends on a continuous carbon supply that allows respiration activities and the building of new tissues. Tissue expansion and cell division occur in the zone proximal to the root apex. Most studies of the control of root elongation rely on a spatial analysis of tissue expansion rate in the elongating zone (Silk 1992), allowing accurate analysis of local events leading to the control of root elongation. It has been shown that cell-wall properties in the elongating zone determine the ability of a root to elongate (Spollen & Sharp 1991; Pritchard et al. 1993). Proteins and mRNAs putatively associated with tissue expansion rate have recently been identified (McQueenMason & Cosgrove 1995; Saab, Ho & Sharp 1995). Such analyses have shown that root expansion rate responds to water availability, temperature or ABA feeding. However, they have mainly been carried out on seedlings only a few days old, whose carbon supply came from the seed, so that root expansion rate was probably not limited by carbon supply. We have therefore applied the same framework of analysis to changes in root elongation rate associated with carbon deficiency. A basic assumption of this framework is that expansion and division are independent processes (Green 1976). Both processes are analysed independently and cell length is taken to be a consequence of their co-ordination (Green 1976). It has been established that carbon deficiency causes a reduction in cell division rate and a blockage of cells at some points of the cell cycle (Van’t Hof 1968). We have therefore examined jointly local cell division rate, tissue expansion rate and sugar content in the growing zone of roots of maize plants receiving contrasting irradiances, to analyse the co-ordination between these processes. 149
150
B. Muller et al.
MATERIALS AND METHODS Plant material and culture conditions An experiment with varying light supply was carried out five times in a growth chamber (Conviron E 15, Winnipeg, Canada). Maize seeds (Zea mays L. cv DEA) were germinated in the dark at 22 °C for 3 d. One hundred seedlings were transplanted into four 10 dm3 containers filled with a nutrient solution (Long-Ashton solution) and installed in the growth chamber. Photon irradiance (LI-190SB, LI Cor, Lincoln, USA), air temperature and air humidity (Vaisala HMP 351, Helsinki, Finland) were measured continuously at plant level in the chamber, and stored every 600 s in a data logger (CR10, Campbell Scientific, Leicester, UK). Photon irradiance was maintained at 400 µmol m–2 s–1 at plant level with a photoperiod of 16 h for 10 d after germination (daily photon irradiance of 23 mol m–2 d–1). Relative humidity was in the range 45–50%. Temperature of the nutrient solution, measured with a set of four copper-constantan thermocouples, was kept constant (22 ± 0·1 °C) during day and night by decreasing air temperature by 2 °C during the day (20 °C day, 22 °C night) to compensate for heating caused by irradiation. Containers were connected and the nutrient solution was continuously circulated so that roots in all containers experienced the same temperature. A change in irradiance was given at day 10 after germination. All plants received continuous irradiance to ensure steadystate kinetics. Fifty plants received 400 ± 20 µmol m–2 s–1 for 24 h each day (34 mol m–2 d–1), and 50 plants were shaded, receiving 80 ± 10 µmol m–2 s–1 for 24 h each day (7 mol m–2 d–1). Shading was achieved by a plastic net. At the time of transplanting, all roots but the primary root were excised while later, nodal roots were allowed to grow. In one experiment, the endosperm of the seed on 25 plants was excised with a razor blade at the time of transplanting, when the primary root was c. 2–5 cm long. Growth analysis The lengths of primary and nodal roots, and the length of the zone carrying laterals on the primary root were measured daily with a ruler. Some plants were randomly harvested at day 20. The lengths and densities of laterals on the primary root were measured. Spatial analysis of root expansion rate was carried out on days 12 (batch of plants called H12 and L12 for plants transferred to high and low irradiance, respectively) and 18 (H18 and L18) after germination. In each group of plants, three to four plants were selected for the constancy of their elongation rate over the 2 previous days. They were carefully removed from the containers and eight to 10 marks were drawn with Indian ink along the first 10 mm after the apex of the primary root. An image of this zone was taken at 2 h intervals for 6–8 h with a video camera. The images were magnified so that the junction between the root cap and the root could be clearly seen. This junction was considered as the origin in the following spatial analysis, and is referred to as the ‘apex’ later in the text. Distances
between the apex and both ends of each ink mark were measured on the images. The rate of displacement of each material point was calculated and plotted against the mean distance to the apex at t and t + 2 h. Roots that showed a reduced elongation rate after marking were not considered in further analyses. Results for all roots that continued to elongate at an unchanged rate before and after marking were pooled, regardless of the experiment. The local slope of the curve relating displacement rate to distance from apex provides an estimate (Silk 1992) of local tissue expansion rate (e, h–1). This slope was calculated at 0·25 mm intervals by linear regression on the neighbouring points. For instance, at a distance of 4 mm, only the points located between 3·5 and 4·5 mm were taken into account. The length of cortical cells was measured on days 12, 13, 18 and 19 along the first cm of hand-cut longitudinal sections, using a microscope (Leitz DMRB, Leica, Wetlar, Germany) coupled to an image-analysis system (Bioscan Optimas, Edmonds, USA). Thirty to 50 cells in the cortex were measured at 0·25–0·5 mm intervals starting at the apex. Measurements were made on both sides of the stele in median cell files, avoiding the files close to the epidermis and to the stele. Cell-length profiles were smoothed and interpolated at 0·25 mm intervals. The smoothing procedure included an estimation of the local slope of the curve linking cell length to distance (as described above for the estimation of tissue expansion rates) and then an integration of the curve along the profile. According to the continuity equation (Gandar 1980), the rate of cell production per file (cell mm–1 h–1) at a given distance can be calculated as
δρ δ (ρV) p = –– + ––––– , (1) δt δx where ρ is cell density per file (reciprocal of cell length, cell mm–1), V is local velocity (mm h–1), and x is distance from the apex (mm). Local rate of change of cell density with time was assumed to be zero, as profiles of cell length obtained on days 13 and 19 were similar to those obtained on days 12 and 18. Local cell production rate per file was therefore calculated as the derivative with respect to position of the product ρV. This calculation does not take into account the occurrence of radial cell divisions, which increases the number of cell files. Cell flux through the ith point (fi, cell h–1) was calculated as fi = ρiVi,
(2)
where ρi and Vi are cell density and local velocity calculated at point i. Cell production rate (pi) in the root section between points i – 1 and i was calculated as fi – fi – l pi = –––––– , (3) xi – xi – l where xi –1 and xi are positions of points i – 1 and i. The cell division rate in this section (di cell cell–1 h–1) was estimated as the ratio of cell production rate to mean cell density in the section (Green & Bauer 1977; Sacks, Silk & Burman © 1998 Blackwell Science Ltd, Plant, Cell and Environment, 21, 149–158
Spatial analysis of maize root elongation
151
1997). The latter was calculated as mean of cell densities at points i – 1 and i.
ρi di = 2 × ––––––– ρi + ρi – l
(4)
The site-specific cell-cycle duration (CTi h–1) was calculated as (Green 1976; Webster & MacLeod 1980) CTi = ln2/di.
(5)
The time needed for a material point to move from the apex to a point i in the growing zone was calculated as the sum of times needed for this material point to move from the proximal to the distal end of 0·25 mm segments to reach position xi: i
ti =
Σ
j=0
(
)
0·25 ––––––– × 2 . Vj + Vj – l
(6)
It was split into two parts, time for crossing the zone with cell division plus tissue elongation (d > 0) and time for crossing the zone with elongation only (d = 0). The point when d reached 0 was considered as t = 0. Time was therefore computed with negative values in the root zone between apex and origin (time elapsed before reaching the origin), and with positive values between the origin and the end of the elongating zone. This double calculation was necessary because of poor estimation of growth velocity at positions in the 0–0·25 mm section close to the apex, which would lead to unacceptable errors if the origin were to be taken at the apex.
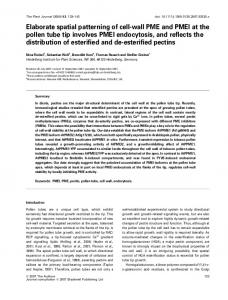
Figure 1. Root elongation rate of young maize plants receiving photon irradiances of either 7 (■,●) or 34 (n,l) mol m–2 d–1 from day 10 onwards. The symbol ▲ denotes plants that had their endosperm removed on day 4. (a) Primary roots (■,n); (b) nodal roots appearing on day 12 (●,l); (c) primary (■) and nodal (●) root elongation rates of plants receiving low irradiance as a percentage of that at high irradiance. Values are means ± SD of 15–20 plants.
Biochemical analyses The first cm from the apex of three to four primary roots was harvested on days 12 and 18 in two experiments. The cap distal to the root cap junction was removed and the root was cut into 1 mm segments with a jig made from razor blades (100 µm thick) separated by calibrated stainless steel strips (900 µm thick). Individual segments were immediately immersed in boiling 80% ethanol for 15 min. The extraction was renewed once with ethanol and a third time with water. All extracts were pooled, evaporated to dryness, resuspended in water and filtered with disposable 0·45 µm nylon filters. Soluble sugars were separated with a HPX 42C column preceded by a Carbo C aminex column (Biorad, Hercules, USA) in an HPLC device (Spectra Physics, San Jose, USA) and quantified with a refractive index detector. Dry weight of individual sections (range 20–100 µg) was measured with a micro-balance (M5P Sartorius, Goettingen, Germany). In the segments, starch was solubilized in 32% HClO4 at room temperature and hydrolysed with 3·5 N H2SO4 at 100 °C for 30 min. Starch was quantified using a colorimetric method (Dubois et al. 1956). Structural dry weight was estimated as the dry weight measured after soluble component extraction minus the amount of starch found in each segment. © 1998 Blackwell Science Ltd, Plant, Cell and Environment, 21, 149–158
RESULTS Root elongation rate of intact plants (Fig. 1a) was greater than 4 cm d–1 until day 9, reaching a maximum on day 6. It then decreased slowly from day 10 onwards to reach about 3 cm d–1 on day 18. The nodal root elongation rate of plants at high irradiance also remained around 3 cm d–1 until the end of the experiment (Fig. 1b). Removing the endosperm from the seed on day 4 significantly reduced elongation rate of the primary root until day 8 (Fig. 1a), but this difference decreased with time and disappeared after day 10. It is therefore likely that most of the assimilates used by the growing root came from photosynthesis and no longer from the seed after day 10. Days 10–18 were therefore an appropriate time to carry out experiments in which irradiance was modified, as the seed’s contribution to carbon supply was then negligible and the near-constant root elongation rate allowed us to hypothesize that cell flux was in steady state in the elongating zone. The mean elongation rate of the primary root of plants at low irradiance decreased to 80% and 65%, respectively, of that of plants at high irradiance, 2 and 4 d after the start of irradiance treatment (Fig. 1a, c). It remained around 65%
152
B. Muller et al.
Figure 2. Number and length of laterals along the primary root at day 20 in young maize plants receiving irradiances of either 7 (closed symbols) or 34 (open symbols) mol m–2 d–1 from day 10 onwards. (a) Number of laterals per cm of primary root; ●,l, total number; ▲,s, number of laterals longer than 0·5 cm. (b) Length of laterals longer than 0·5 cm, per cm of primary root. Values are means ± SD of six to eight plants. Between the graphs is shown the date of emergence of laterals at a given position along the primary root.
until day 18 (8 d of irradiance treatment). The nodal root elongation rate of plants transferred to low irradiance reached a value close to 80% of that in plants transferred to high irradiance by day 14 and remained roughly constant afterwards (Fig. 1c). Growth of laterals along the primary root was also affected by shading (Fig. 2). At day 20, the length of laterals per unit length of primary root was reduced by two-thirds in the upper 10 cm of primary root, and to near zero further from the base. This was not because of a difference in lateral number per unit length of primary root, as this was unaffected by the irradiance treatment (Fig. 2a), but because fewer laterals elongated in plants at low irradiance compared with those at high irradiance. Of 8–12 laterals appearing per cm of primary root at depths greater than 10 cm, two to three elongated more than 5 mm in plants at high irradiance, compared with none or only 1 in plants at low irradiance (Fig. 2a). The low-irradiance treatment may have had less effect on laterals emerging from the first 10 cm of the primary root than on those at further distances because the former appeared before day 9, that is, before the onset of the irradiance treatment and before the exhaustion of seed reserves. Spatial analysis of primary root expansion rate was carried out in four groups of plants that elongated at contrasting rates. The rate of elongation in plants harvested on day 12 was 3·6 ± 0·1 and 2·6 ± 0·06 cm d–1, respectively, in plants at high (H12) and low (L12) irradiance, while in those harvested on day 18 it was 2·7 ± 0·06 and 1·6 ± 0·1 cm d–1, respectively for H18 and L18 plants, consistent with mean root elongation rates in corresponding treatments. Profiles of tissue expansion rate had bell shapes in all groups of plants (Fig. 3a, b). Primary roots had a 9 mm elongating zone in both H12 and H18 plants, while the maximum rate of tissue expansion was lower in H18 plants than in H12 plants (0·21 versus 0·28 h–1). Shading reduced the length of the elongating zone to 8 mm
and 5·5 mm in L12 and L18 plants, without affecting maximum tissue expansion rate. Mean cortical cell length in roots of H12 plants (Fig. 3c) was 12 µm in the first 2 mm behind the apex, then increased to reach a plateau (170 µm) at 9 mm from the apex. Profiles were similar in H18 and H12 plants in the first 6 mm but the final cell length was lower (135 µm Fig. 3d). They were also similar in H12 and L12 plants, with a common final mean cell length (170 µm). In contrast, both the start of the increase in cell length and the plateua occurred nearer to the apex in L18 than in H18 plants (Fig. 3d), consistent with differences in lengths of elongating zone (Fig. 3b). Cell production occurred in the proximal 2·75 mm from the apex in H12 and H18 plants with, in both cases, maximum production rates (4·0 cell mm–1 h–1) in the 0·5–2 mm zone. The zone with cell production was shorter in roots of L12 and L18 plants, with a slightly reduced maximum production rate. The cell flux per file at the end of the elongating zone (Fig. 3e, inset) was almost the same in both H12 and H18 plants (8·8 and 8·2 cell file–1 h–1, respectively), and was reduced in both L12 plants (6·5 cell file–1 h–1), and L18 plants (6·0 cell file–1 h–1). In spite of observed changes in production rate with distance from the apex, cell division rate was nearly constant over the whole cell division zone, and decreased abruptly over 1 mm (Fig. 4a, b). This pattern and calculated cell division rate (0·04 h–1) were common to all plant groups, regardless of treatment and date of harvesting. Differences in cell flux among treatments therefore essentially involved the length of the root zone over which cells divided, and not the division rate of individual cells as characterized (Green & Bauer 1977) by cell division rate or cell cycle duration. The time for crossing this zone was around 60 h for all the batches analysed (Fig. 4c, d). At day 18, it was slightly shorter in plants at low irradiance than in plants at high irradiance (50 h and 64 h, respectively, in L18 and H18 plants, Fig. 4d). Time for crossing the zone with © 1998 Blackwell Science Ltd, Plant, Cell and Environment, 21, 149–158
Spatial analysis of maize root elongation
153
Figure 3. Growth analysis of primary root of young maize plants receiving photon irradiances of either 7 (■,●) or 34 (n,l) mol m–2 d–1 from day 10 onwards. Plants were collected on day 12 (left) or on day 18 (right). (a), (b) Tissue expansion rate; (c), (d) mean cell length in the median cortical zone. Both variables were calculated from measurements on three to four plants. (e), (f) Production rate of cortical cells per file, computed from the previous two variables (see ‘Materials and methods’). Note that the x-axis is focused on the 0–4·5 mm zone. Inset in (e), mean cell flux in the mature zone, that is, the integral of the cell production rate along the meristem. The continuous lines on the righthand graphs represent mean values for the H12 plants, included for easier comparison. Variables were calculated at 0·25 mm intervals but to maintain legibility only half the points are plotted.
elongation but no cell division (Fig. 4e, f) was shorter in H12 and L18 plants (less than 8 h) compared with H18 and L12 plants (11–12 h). Structural dry weight per unit root length was maximum near the apex (100 µg mm–1) and fell to 30 µg mm–1 with increasing distance from the apex (Fig. 5a, b). It was lower in plants at low irradiance than in plants at high irradiance, consistent with a lower root diameter in plants at low irradiance (Fig. 5c, d). Of the soluble sugars, sucrose and glucose had the highest concentrations in the first cm from the © 1998 Blackwell Science Ltd, Plant, Cell and Environment, 21, 149–158
apex; in all groups of plants, only a small amount of fructose and a large amount (c. 15% of the dry matter) of small polysaccharides, probably originating from the cell wall, were detected by HPLC. In H12 plants, sucrose and glucose represented 4 and 6% of the dry matter, respectively (Fig. 6a, c), with the highest concentration of sucrose near the apex and the highest concentration of glucose further from the apex (more than 10% of dry matter). H18 plants showed the same patterns (Fig. 6b, d). Two days at low irradiance led to a dramatic decrease in sucrose content
154
B. Muller et al.
Figure 4. Growth analysis of primary root (continued from Figure 3). (a), (b) Cell division rate calculated as mean cell length divided by cell production rate in 0·25 mm segments; (c), (d) growth trajectories in the zone with both division and elongation (meristem); (e), (f) growth trajectories in the zone with elongation only. Time 0 is when a material point left the meristem. Note that the x-axis is focused on the 0–4·5 mm zone in graphs (a)–(d). See Figure 3 for key to symbols and lines.
throughout the growing zone and in glucose content in the most distal zones (Fig. 6a, c). Eight days at low irradiance caused no further change in sucrose and glucose contents along the growing zone when compared with L12 plants (Fig. 6b, d). Starch content was relatively constant, on a dry-weight basis, all along the growing zone, and did not differ significantly between H12 and L12 plants. L18 and H18 plants had slightly lower and higher root starch contents, respectively, compared with H12 and L12 plants. DISCUSSION The results presented here confirm that a reduction in irradiance can lower root elongation rate over a range of irradiances comparable with those observed in the field. In our growth chamber experiments, shaded and fulllight treatments corresponded to daily photon irradiances of 7 and 34 mol m–2 d–1, which are similar to those observed on cloudy and bright days during May in temperate climates. Our experiments, with constant light and temperature, allowed in addition a better understanding of the sequence of events leading to reduction in elongation rate, as the growing zone could be considered in
steady state with nearly constant elongation and division rates and concentrations of sugars. This was a condition for a reliable spatial analysis of division and elongation processes. The carbon status of the elongating zone was clearly affected by transfer to low irradiance, which flattened the gradients of soluble sugar concentrations observed in the roots of plants at high irradiance (Fig. 6a–d). These gradients, with highest sucrose concentration near the apex and increase in glucose concentration further from the apex, were observed by Sharp, Hsiao & Silk (1990). The gradients might be related to the distribution of the sucrose-cleaving enzyme invertase, which is almost absent in the first 2 mm behind the root tip and increases about 10-fold at 4 mm (Hellebust & Forward 1962). They might also be linked to the termination of phloem elements that can be located around 3 mm from the apex (Bret-Harte & Silk 1994; Warmbrodt 1987). In any case, decrease in irradiance, and presumably in sucrose import by the phloem, led to a reduced sucrose content in the apical 3 mm and to a reduced glucose content further from the apex. Its effect on starch content was detectable only on day 18 (Fig. 6e, f). As a consequence, a reduction in © 1998 Blackwell Science Ltd, Plant, Cell and Environment, 21, 149–158
Spatial analysis of maize root elongation
155
Figure 5. Structural dry weight (a, b) and diameter (c, d) of the elongating zone of young maize plants receiving photon irradiances of either 7 (■,●) or 34 (n,l) mol m–2 d–1 from day 10 onwards. Plants were collected on day 12 (left) or 18 (right). Continuous lines on right-hand graphs represent mean values for H12 plants; values are means ± SD of six to eight plants.
irradiance comparable with that observed in the field appreciably affected root carbon status. However, this effect was less than that observed in experiments with detached root apices (e.g. Brouquisse et al. 1991) in which 8 h without sugar in the medium reduced sucrose and glucose concentrations to 0·2 and 2·4 µg per mm in 3 mm excised maize root tips. Changes in carbon status were accompanied by changes in cell production rate (Fig. 3e, f) consistent with the early work of Van’t Hof (1968), which showed that sugar may control the progression of cells through the cell cycle at the transitions G1-S and G2-M. However, calculations of cell division rate in our experiments suggest that the duration of the cell cycle in the dividing zone was not affected by the irradiance treatment. It was about 18 h in all treatments throughout the meristem (range 16·5 h–19·5 h). This value is consistent with a duration of 18·5–19·6 h found by Barlow & MacDonald (1973) with incorporation of 3H-thymidine in maize root tips at 21 °C at 0·7 and 1 mm from the apex. Our in situ calculation of cell division rate suggests that cells ceased to divide at 2·5 mm from the apex in plants at high irradiance, compared with 2 mm in plants at low irradiance, but that a given cell kept an unaffected cycle duration regardless of distance from the apex. A fall in the rate of cell production with increasing distance from the apex (Fig. 3e, f) was linked to a reduction in cell density (increase in cell length) with distance, thereby reducing the total number of divisions per unit root length without change in cell division © 1998 Blackwell Science Ltd, Plant, Cell and Environment, 21, 149–158
rate. Our results suggest that differences in cell flux between roots of plants at low and high irradiance were linked to a difference in the duration of the period during which cells remained competent to divide. Unfortunately, our calculations did not allow precise evaluation of this duration. The finding in the present study that cell division rate is constant throughout the meristem conflicts with some reports on spatial analysis of cell division rates in maize root meristem where a bell-shaped curve was found (Erickson & Sax 1956; Sacks et al. 1997). On the other hand, Barlow & MacDonald (1973) reported a flat profile of cell division rates in the maize root meristem using 3Hthymidine. Recent studies on grass leaves also reported a flat profile of cell division rates throughout the meristem (Beemster et al. 1996 on wheat, and calculations based on the results of Ben-Haj-Salah & Tardieu 1995 on maize). Our results (Fig. 4a, b) fall into this second group and suggest that the meristem boundary separates cells dividing at the same rate as cells more proximal to the apex from cells that are no longer dividing. Our spatial analysis yielded results similar to those observed in roots of droughted maize (Sharp, Hsiao & Silk 1988) or wheat plants (Pritchard, Wyn Jones & Tomos 1991), with no effect of stress on tissue expansion rates near the apex and with a decrease in the length of the elongating zone (Fig. 3a, b). However, the time required for this reduction differed from that caused by sudden changes in water potential (Cramer, Epstein & Läuchli 1990) or
156
B. Muller et al.
Figure 6. Sucrose, glucose and starch content in the elongating zone of young maize plants receiving photon irradiances of either 7 (■,●) or 34 (n,l) mol m–2 d–1 from day 10 onwards. Plants were collected on day 12 (left) or 18 (right). (a), (b), sucrose content; (c), (d), glucose content; (e), (f) starch content. Data are expressed as µg per 100 µg of dry matter. Continuous lines on right hand graphs represent mean values for H12 plants; values are means ± SD of six to eight plants.
temperature (Pritchard et al. 1990), which rapidly reduced elongation rate. In the same way, rapid changes in soil water content, evaporative demand or temperature affected all segments of the elongating zone of maize leaf in less than 60 min (Ben-Haj-Salah & Tardieu 1995, 1996). Such stresses, mediated by ABA (Saab et al. 1995), pH of the apoplast (McQueen-Mason & Cosgrove 1995) or tissue temperature (Pritchard et al. 1990), are known to affect rapidly local cell wall mechanical properties, and can therefore reduce tissue expansion rates of the elongating zone within minutes. In contrast, the full reduction in root elongation rate in the present study was observed only after 4 d at low irradiance (Fig. 1a, c), while sugar content in the elongating zone as well as cell production rate were already affected at day 12 and remained roughly constant from day 12 to day 18 (Fig. 6a–d). This is consistent with an observation of Aguirrezabal et al. (1994), who found
that root elongation rate of sunflower correlated with intercepted irradiance with a 24 h delay. This raises the possibility that changes in carbon availability to roots affect elongation rate through a developmental process that requires time to be observed, and not by an immediate effect of stress on cell wall properties. A recent piece of evidence suggests that changes in cell flux may cause such a delay. Litinskaya (1993) provoked a cessation of cell division in a maize root tip by using cytostatic cis-dichlorodiamine platinum (II). Root elongation was affected by only 20% after 24 h with a two-fold increase in meristematic cell length, but nearly stopped after 48 h. By using transformed Arabidopsis lines, Doerner et al. (1996) have shown that an overexpression of a mitotic cyclin leads to a one-third increase in root elongation rate while cell flux is increased by the same proportion. Furthermore, Arabidospis root elongation © 1998 Blackwell Science Ltd, Plant, Cell and Environment, 21, 149–158
Spatial analysis of maize root elongation
increases over the first days after germination and this has been found to be associated with an increased cell flux and presumably to an increased number of mersitematic cells (Baskin et al. 1995). A direct effect of carbon supply on tissue expansion rate was also observed in addition to the developmental effect. Eight days at low irradiance reduced final cell length (Fig. 3d), indicating that changes in expansion rate were greater than changes in cell division rate (Green 1976). Carbon deficiency may also be responsible for the early changes in root diameter and structural dry weight per unit root length associated with 2 d at low irradiance (Fig. 5a–d). Similar changes have been observed by Thaler & Pagès (1996b) in Hevea brasiliensis roots with deficient carbon nutrition and are probably linked to a reduced number of cell files (Barlow 1993). The marked reduction in lateral length (Fig. 2b) contrasted with the relatively moderate decreases in primary and nodal root elongation rates. This observation resembles the results of Bingham & Stevenson (1993), who showed on wheat that the elongation rate of laterals was reduced to a greater extent than that of seminal axes in leafpruned plants, but that it was partially restored when glucose was supplied to roots. In the same way, the elongation rate of laterals of Hevea brasiliensis was reduced to a greater extent than that of taproots during periods with high shoot demand for carbon (Thaler & Pagès 1996a). In our data, this reduction in lateral length was essentially attributable to a high proportion of laterals that stopped elongating after a few mm (Fig. 2a), as already described by Aguirrezabal & Tardieu (1996) in sunflower laterals borne by the taproot. A decrease in carbon availability to roots probably has more effect on the carbon status of laterals than on that of main axes (Minchin, Thorpe & Farrar 1993) because of the lower sink strength of laterals. Lateral apices were therefore probably subjected to more severe carbon stress than primary roots, resulting in a more severe loss of cell competence to divide than that in primary root, or in root apex death linked to carbon starvation (Brouquisse et al. 1991). CONCLUSION Our results suggest that reducing irradiance leads to a decrease in primary root elongation rate and to a more pronounced decrease in lateral root growth. Primary events were decreases in (1) sucrose and glucose contents in apices, (2) cell production rate, as a result of shortening of the meristem, and (3) apex diameter. The elongation rate of primary root steadily decreased over the first 4 d after the reduction of irradiance, while the cell division rate showed no further change after 2 d. This suggests that the change in root elongation rate was caused by a time-related developmental effect and not by a direct and immediate effect of stress on cell wall mechanical properties in the elongating zone. We raise the possibility that this effect could be linked to cell production rate under the control of the carbon status of the growing zone. © 1998 Blackwell Science Ltd, Plant, Cell and Environment, 21, 149–158
157
ACKNOWLEDGMENTS The expert technical assistance of Ph Hamard and Ph Barrieu is gratefully acknowledged. This research was partly funded by the Institut National de la Recherche Agronomique (AIP Biologie du Développement). REFERENCES Aguirrezabal L.A.N., Deléens E. & Tardieu F. (1994) Root elongation rate is accounted for by intercepted PPFD and source–sink relations in field and laboratory-grown sunflower. Plant Cell and Environment 17, 443–450. Aguirrezabal L.A.N. & Tardieu F. (1996) An architectural analysis of the elongation of field-grown sunflower root systems. Elements for modelling the effect of temperature and intercepted radiation. Journal of Experimental Botany 47, 411–420. Aresta R.B. & Fukai S. (1984) Effects of solar radiation on growth of cassava (Manihot esculenta Cratz.). II. Fibrous root length. Field Crops Research 9, 361–371. Barlow P.W. (1993) The cell division cycle in relation to root organogenesis. In Molecular and Cell Biology of the Plant Cell Cycle (eds J. C. Omrod & D. Francis), pp. 179–199. Kluwer Academic Publishers, Dordrecht. Barlow P.W. & MacDonald P.D. (1973) An analysis of the mitotic cell cycle in the root meristem of Zea mays. Proceedings of the Royal Society of London B 183, 385–398. Baskin T.I., Cork A., Williamson R.E. & Gorst J.R. (1995) STUNTED PLANT 1, a gene required for expansion in rapidly elongating but not in dividing cells and mediating root growth responses to applied cytokinin. Plant Physiology 107, 233–243. Beemster G.T.S., Masle J., Williamson R.E. & Farquhar G.D. (1996) Effects of soil resistance to root penetration on leaf expansion in wheat (Triticum aestivum L.): kinematic analysis of leaf elongation. Journal of Experimental Botany 47, 1663–1678. Ben-Haj-Salah H. & Tardieu F. (1995) Temperature affects expansion rate of maize leaves without change in spatial distribution of cell length. Plant Physiology 109, 861–870. Ben-Haj-Salah H. & Tardieu F. (1996) Quantitative analysis of the combined effects of temperature, evaporative demand and light on leaf elongation rate in well-watered field and laboratorygrown maize plants. Journal of Experimental Botany 47, 1689–1698. Bingham I.J. & Stevenson E.A. (1993) Control of root growth: effects of carbohydrates on the extension, branching and rate of respiration of different fractions of wheat roots. Physiologia Plantarum 88, 149–158. Bret-Harte M.S. & Silk W.K. (1994) Nonvascular, symplasmic diffusion of sucrose cannot satisfy the carbon demands of growth in the primary root tip of Zea mays L. Plant Physiology 105, 19–33. Brouquisse R., James F., Raymond P. & Pradet A. (1991) Study of glucose starvation in excised maize root tips. Plant Physiology 96, 619–626. Cramer G.R., Epstein E. & Läuchli A. (1990) Effects of sodium, potassium, and calcium on salt-stressed barley. I. Growth analysis. Physiologia Plantarum 80, 83–88. Doerner P., Jørgensen J-E., You R., Steppuhn J. & Lamb C. (1996) Control of root growth and development by cyclin expression. Nature 380, 520–523. Dubois M., Gilles K.A., Hamilton J.K., Rebus P.A. & Smith F. (1956) Colorimetric method for the determination of sugars and related substances. Analytical Chemistry 28, 350–356. Erickson R.O & Sax K.B. (1956) Rates of cell division and cell elongation in the growth of the primary root of Zea mays. Proceedings of the American Philosophical Society 100, 499–514.
158
B. Muller et al.
Gandar P.W. (1980) The analysis of growth and cell production in root apices. Botanical Gazette 141, 131–138. Green P.B. (1976) Growth and cell pattern formation on an axis: critique of concepts, terminology and modes of study. Botanical Gazette 137, 187–202. Green P.B. & Bauer K. (1977) Analysing the changing cell cycle. Journal of Theoretical Biology 68, 299–315. Hellebust J.A. & Forward D.F. (1962) The invertase of the corn radicle and its activity in successive stages of growth. Canadian Journal of Botany 40, 113–126. Jones C.A. & Kiniry J.R. (1986) CERES-Maize. A simulation model of maize growth and development. Texas A & M University Press, College Station. Litinskaya T.K. (1993) Effect of the cytostatic cis-dichlorodiamine platinum (II) on cells of the maize root tip. Biology Bulletin of the Russian Academy of Sciences 20, 532–539. McQueen-Mason S.J. & Cosgrove D.J. (1995) Expansin mode of action on cell walls: analysis of wall hydrolysis, stress relaxation and binding. Plant Physiology 107, 87–100. Minchin P.E.H., Thorpe M.R. & Farrar J.F. (1993) A simple mechanistic model of phloem transport which explains sink priority. Journal of Experimental Botany 44, 947–955. Pritchard J., Barlow P.W., Adams J.S. & Tomos D. (1990) Biophysics of the inhibition of the growth of maize roots by lowered temperature. Plant Physiology 93, 222–230. Pritchard J, Hetherington P.R., Fry S.C. & Tomos A.D. (1993) Xyloglucan endotransglycosylase activity, microfibril orientation and the profiles of cell wall properties along growing regions of maize roots. Journal of Experimental Botany 44, 1281–1289. Pritchard J., Wyn Jones R.G. & Tomos A.D. (1991) Turgor, growth and rheological gradients of wheat roots following osmotic stress. Journal of Experimental Botany 42, 1043–1049. Saab I.N., Ho T.H.D. & Sharp R.E. (1995) Translatable RNA populations associated with maintenance of primary root elongation and inhibition of mesocotyl elongation by abscisic acid in maize seedlings at low water potentials. Plant Physiology 109, 593–601. Sacks M.M., Silk W.K. & Burman P. (1997) Effect of water stress on cortical cell division rates within the apical meristem of primary roots of maize. Plant Physiology 114, 519–527.
Sharp R.E., Hsiao T.C. & Silk W.K. (1988) Growth of the maize primary root at low water potentials. I. Spatial distribution of expansive growth. Plant Physiology 87, 50–57. Sharp R.E., Hsiao T.C. & Silk W.K. (1990) Growth of the maize primary root at low water potentials. II. Role of growth and deposition of hexoses and potassium in osmotic adjustment. Plant Physiology 93, 1337–1346. Silk W.K. (1992) Steady form from changing cells. International Journal of Plant Sciences 153, S49-S58. Spollen W.G. & Sharp R.E. (1991) Spatial distribution of turgor and root growth at low water potentials. Plant Physiology, 96, 438–443. Thaler P. & Pagès L. (1996a) Periodicity in the development of the root system of young rubber trees (Hevea brasiliensis Müell. Arg.): relationship with shoot development. Plant Cell and Environment 19, 56–64. Thaler P. & Pagès L. (1996b) Root apical diameter and root elongation rate of rubber seedlings (Hevea brasiliensis) show parallel responses to photoassimilate availability. Physiologia Plantarum 97, 365–371. Van’t Hof J. (1968) Control of cell progression through the mitotic cycle by carbohydrate provision. Journal of Cell Biology 37, 773–780. Vincent C.D. & Gregory P.J. (1989) Effects of temperature on the development and growth of winter wheat roots. II. Field studies of temperature, nitrogen and irradiance. Plant and Soil 19, 99–110. Warmbrodt R.D. (1987) Solute concentrations in the phloem and apex of the root of Zea mays. American Journal of Botany 74, 394–402. Webb D.P. (1976) Root growth in Acer saccharum marsch. seedlings: effect of light intensity and photoperiod on root elongation rates. Botanical Gazette 137, 211–217. Webster P.L. & MacLeod R.D. (1980) Characteristics of root apical meristem cell population kinetics: a review of analyses and concepts. Environmental and Experimental Botany 20, 335–358. Received 26 July 1997; received in revised form 27 October 1997; accepted for publication 28 October 1997
© 1998 Blackwell Science Ltd, Plant, Cell and Environment, 21, 149–158