WETLANDS, Vol. 27, No. 4, December 2007, pp. 951–963 ’ 2007, The Society of Wetland Scientists
SPATIAL HETEROGENEITY AND DEPENDENCE OF SOILS AND HERBACEOUS PLANT COMMUNITIES IN ADJACENT SEASONAL WETLAND AND PASTURE SITES David A. Dick1 and Frank S. Gilliam2 West Virginia Department of Agriculture Plant Industries Division Charleston, West Virginia, USA 25305-0191 1
2
Department of Biological Sciences Marshall University Huntington, West Virginia, USA 25755-2510 E-mail:
[email protected] Abstract: Soil processes often exhibit spatial heterogeneity that may influence plant community structure. This study was conducted to determine fine-scale spatial patterns and degrees of variability of soil nutrients and plant communities within different vegetation types in a stream floodplain in southwestern West Virginia. One 5 m 3 5 m site was established in each of two vegetation/drainage types: pasture (PA) and seasonal wetland (SW). Sites were located ,25 m apart on flat bottomland. A 10 m 3 1 m transect was also established perpendicular to the visible boundary between PA and SW drainage types, but separate from the PA and SW sites. Each site was divided into 1-m2 plots (n 5 25) and the transect was divided into 0.25-m2 plots (n 5 40). Mineral soil was taken to a 5 cm depth. Soil organic matter was measured as loss-on-ignition. Extractable NH4+ and NO32 were determined before and after laboratory incubation (28 days at 27uC) to determine net N mineralization and nitrification. Cations were analyzed using inductively coupled plasma emission spectrometry. Vegetation was assessed using estimated percent cover (sites) and aboveground harvested biomass (transect). Mean organic matter was significantly higher (P , 0.05) in SW than in PA (10.6% and 8.3%, respectively). Nitrification was nearly 100% of mineralization in all soils, and was significantly lower (P , 0.05) in PA than in SW (0.7 and 1.8 mg NO32-N/g soil/d, respectively). Aluminum was significantly higher (P , 0.05) in SW than in PA (202.1 and 0.5 mg Al/g soil, respectively). Calcium and pH were significantly higher (P , 0.05) in PA than in SW (768.5 mg/g soil and 4.4, respectively). Magnesium was significantly higher (P , 0.05) in SW than in PA (174.2 and 121.9 mg/g soil, respectively). Transect results were similar to PA and SW sites and an abrupt transition was found between PA and SW site types. Vegetation analysis revealed two distinct communities with SW dominated by wetland species and PA dominated by a mixture with slightly more upland species. Transect vegetation also consisted of largely wetland species within wetland and a mixture in pasture, however Arthraxon hispidus (Thunb.) Makino dominated for ,1 m at the boundary. Spatial variability of organic matter was much lower than spatial variability of nitrification. Thus, availability of organic substrates to N-processing microbes is less variable than N processing itself, underlining the complexity of biotic factors responsible for regulating soil N processes. Key Words: nitrification, nitrogen mineralization, nitrogen saturation, soil cations
INTRODUCTION
plant communities (Robertson et al. 1988, Cross and Schlesinger 1999, Hutchings et al. 2003, Gilliam 2006). A clearer understanding of processes associated with spatial heterogeneity should result in improved statistical estimates through choice of sampling schemes and central tendency measures, and even improved management practices through integration of predictive variables from regional, landscape, plot, and micro scales (Parkin 1993). Soil nutrient dynamics typically exhibit a high degree of spatial heterogeneity (Gilliam et al. 2005,
Heterogeneity – defined by Li and Reynolds (1995) as ‘‘the complexity and/or variability of a system property in space and/or time’’ – can be an important component controlling plant community structure and composition. Spatial heterogeneity in soil resources is considered to play an important role in maintaining biodiversity (VivianSmith 1997, Bell et al. 2000, Gallardo et al. 2005) and has been linked with structural attributes of 951
952 Smithwick et al. 2005), being controlled by processes that are themselves quite spatially heterogeneous. For example, several studies (Stevenson 1986, Morris and Boerner 1998, 1999, Devito et al. 1999, Ohrui et al. 1999) have reported soil moisture-related controls for soil nitrogen (N) cycling. Other authors (Stevenson 1986, Van der Krift and Berendse 2001) found temperature as an important influence on N dynamics. Vegetation has also been linked with N dynamics (Schlesinger et al. 1996, Cross and Schlesinger 1999, Van der Krift and Berendse 2001). Spatial variability of calcium (Ca) and magnesium (Mg) ions was found by Schlesinger et al. (1996) and Cross and Schlesinger (1999) to be controlled by parent materials. Aluminum (Al) mobility, along with that of Ca and Mg, is often correlated with pH (Postek et al. 1995, Barbour et al. 1999). Feedback can occur in which two processes affect each other. For example, N availability can select for plant communities which, in turn, may further alter N availability (Wedin and Tilman 1990). Indeed, soils beneath macrophytic patches are commonly shown to be enriched in organic matter and N (Schlesinger et al. 1996, Thompson et al. 2006). The process of wetland creation, e.g., for mitigation purposes, potentially alters spatial heterogeneity of both vegetation and several ecologically important processes that influence vegetation (Stolt et al. 2001). Consequently, an understanding of the effects of inundation on spatial heterogeneity is important in assessing the efficacy of the creation effort. Previous work in western West Virginia showed that effects of mitigation wetland creation varied greatly among soil nutrients, with rapid changes observed for N and much slower changes for base cations (Gilliam et al. 1999). This work, however, lacked an appropriate design to assess finescale spatial heterogeneity. Accordingly, the purpose of this study was to examine fine-scale spatial variability of both soil nutrients and vegetation in a seasonal wetland imbedded in a pasture matrix. Our approach followed that of Mancera et al. (2005), who assessed fine-scale variation in marshland vegetation relative to environmental variables in a coastal riverine wetland landscape. Our specific objectives were to 1) characterize and compare soil N dynamics, pH, organic matter, and extractable soil nutrients within seasonal wetland and adjacent pasture using square grids with cells at 1 m intervals, 2) characterize and compare vegetation in these same sites, and 3) repeat these same comparisons using finer-scale sampling (0.5 m intervals) along a transect spanning the two sites.
WETLANDS, Volume 27, No. 4, 2007
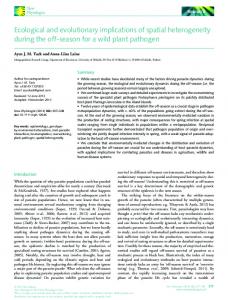
Figure 1. Monthly precipitation for the research site. Shown are 30-yr means taken from the U.S Weather Service (http://cdo.ncdc.noaa.gov/cgi-bin/climatenormals/ climatenormals.pl) and for the year of study (2001).
MATERIALS AND METHODS Site Description This study was carried out at the Mill Creek mitigation area, an abandoned pasture located in a 3rd-order stream floodplain in Wayne County, West Virginia, near the town of Saltpetre. The pasture covered an approximately 1 ha area flanked east and west with hills dominated by mixed deciduous forest. Within the pasture matrix is a seasonal wetland of approximately 250 m2. Although the history of how this wetland developed is unclear, it likely is the result of a slight but notable depression (5–10 cm, Dick 2003) in the otherwise level landscape in which water accumulates to fill this depression during times of high precipitation. This typically occurs in the growing season, and was especially the case during the year of this study (Figure 1). Although less precipitation fell during 2001 (93.1 cm) than the 30-yr mean (107.5 cm/yr), more fell during May through July, 2001, than was expected from the long-term mean. This site will become a constructed wetland to offset wetland losses incurred during road construction. Elevation within the floodplain is ,195–200 m. Soils of the study site were of the Kanawha series. Kanawha soils are fine-loamy, mixed, active, mesic Typic Hapludalfs, and are very deep (100–180 cm), well-drained, moderately permeable, and formed in alluvium derived from interbedded shale, siltstone, and sandstone. Kanawha soils are found on high bottoms and low stream terraces with slope ranges from 0%–15%; our slopes were essentially 0%. For more complete description of Kanawha series soils, see the following web site: http://ortho.ftw.nrcs.usda. gov/osd/dat/K/KANAWHA.html.
Dick & Gilliam, SPATIAL HETEROGENEITY IN A SEASONAL WETLAND
953
pasture (PAt) areas, but separate from PA and SW sites. Using this transect as a centerline, a quartered 1-m2 PVC frame was used to define 0.25-m2 plots (n 5 40) along the transect (paired plots at 0.5 m intervals). Mineral soil was collected in September 2001 using a hand trowel to a depth of 5 cm as described for the site sampling. Soil samples were immediately placed on ice for transport to the laboratory. Vegetation cover was estimated within 1-m2 plots at PA and SW sites using percent cover estimation in October 2002. Aboveground vegetation was harvested within each 0.25-m2 transect plot in October 2001 using garden shears to cut stems at ground level. Vegetation from each transect plot was placed in large, labeled plastic bags for transport back to the laboratory for sorting, drying, and weighing. Botanical nomenclature follows Strasbaugh and Core (1977) and species will be referred to using four-letter codes (Table 1). Wetland indicator status was determined for each species using the PLANTS database (USDA, NRCS 2004). Laboratory Analyses
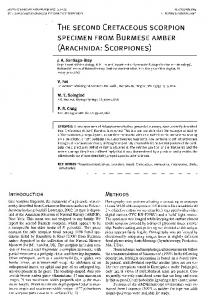
Figure 2. Schematic diagram of sampling design within each of two sites.
Field Sampling Two 5 m 3 5 m sites were established on the floodplain: one inside the seasonal wetland (SW) and one approximately 25 m away in the pasture (PA). Each 5 m 3 5 m site was divided into 25 1-m2 plots and each plot was quartered using a 1-m2 PVC frame with center cross. One mineral soil sample was taken from near the center of each 0.25-m2 quadrant of 1-m2 plots to a depth of 5 cm using a 2 cm diameter soil corer. Four samples (one per quadrant) were placed together in a single sterile polyethylene Whirl Pak bag to create a composite sample for each 1-m2 plot for a total of 25 mineral soil samples per site (Figure 2). Soil samples were kept in bags as intact cores and were immediately placed on ice for transport to laboratory. Samples were collected in August 2001. A 10 m transect was established perpendicular to the seasonal wetland boundary and centered with 5 m extending into both seasonal wetland (SWt) and
After being brought back to the laboratory at Marshall University, samples were homogenized by hand in original collection bags before analysis. Organic matter was determined from oven dried soil samples using a loss-on-ignition method (mass lost over 7 hr at 500uC). Soil samples were extracted (see below) for pre-incubation analysis of KCl-extractable NO3, NH4, Al, Ca, Mg, and pH. Remaining soil samples were then incubated in their original polyethylene bags at 27uC for 28 days in a Fisher Scientific Low Temperature Incubator (Model 146E). Previous work on similar soils (e.g., Gilliam et al. 2005) showed 27uC to be the temperature optimum for N mineralization and nitrification. Thus, results reflect N mineralization and nitrification potentials, rather than field (i.e., in situ) rates. Soil moisture determined for pre-incubation analyses revealed that moisture generally ranged from 30%–35%, neither varying between sites nor changing over the course of incubation; no water was added at any time before or during the incubation. Post-incubation extraction and analysis of nutrients were performed following methods described in Gilliam et al. (2005). Briefly, moist soils were extracted with 1N KCl at an extract:soil ratio of 10:1 (v:w). Extracts were analyzed colorimetrically for NH4 and NO3 with a Bran+Luebbe TrAAcs 2000 automatic analysis system. Extractable Al, Ca, and Mg were analyzed via inductively coupled plasma emission spectrometry (ICP) with a Varian
954
WETLANDS, Volume 27, No. 4, 2007
Table 1. List of all plant species encountered at Mill Creek study site, Wayne County, West Virginia. Codes will be used to refer to species throughout the text. Wetland indicator status (WIS) for each species taken from USDA, NRCS (2002), Region 1. Code
Scientific Name
Common Name
WIS*
ACRH AGSP ARHI ASLA ASPI CAFR CATR CAVU CIAR COCO CYST DISA DIVI ECCR ELCA FEEL GLHE JUEF JUTE LYNU OXCO OXST PAAN PHPO POHY POPE POSP SEGL SOCA TAOF VEAL XAPE
Acalypha rhomboidea Raf. Agrostis sp. Arthraxon hispidus (Thunb.) Makino Aster lateriflorus (L.) Britton Aster pilosus Willd. Carex frankii Kunth Carex tribuloides Wahl. Carex vulpinoidea Michx. Cinna arundinacea L. Commelina communis L. Cyperus strigosus L. Digitaria sanguinalis (L.) Scop. Diodia virginiana L. Echinochloa crusgalli (L.) Beauv. Elephantopus carolinianus Willd. Festuca elatior L. Glechoma hederacea L. Juncus effusus L. Juncus tenuis Willd. Lysimachia nummularia L. Oxalis corniculata L. Oxalis stricta L. Panicum anceps Michx. Phaseolus polystachios (L.) BSP. Polygonum hydropiperoides Michx. Polygonum pensylvanicum L. Poa sp. Setaria glauca (L.) Beauv. Solanum carolinense L. Taraxacum officinale Weber. Vernonia altissima Nutt. Xanthium pensylvanicum Wallr.
Common three-seeded mercury – Jointheaded arthraxon Calico aster White heath aster Sedge Sedge Foxtail sedge Wood reed-grass Asiatic day-flower Strawcolored flatsedge Crabgrass Larger buttonweed Barnyard grass Elephant’s-foot Meadow fescue Ground-ivy Common rush Path rush, wiregrass Moneywort Creeping lady’s sorrel Upright yellow wood sorrel Flat-stemmed panic grass Wild kidney bean Mild water pepper Pennsylvania smartweed Bluegrass Yellow foxtail Horse-nettle Common dandelion Tall ironweed Smooth-body cocklebur
FACU2 – NI FACW2 UPL OBL FACW+ OBL FACW+ FAC2 FACW FACU2 FACW FACU FACU FACU2 FACU OBL FAC2 OBL FACU UPL FAC NI OBL FACW – FAC UPL FACU2 NI NI
*WIS abbreviations are as follows: OBL (obligate wetland), FACW (facultative wetland), FACW+ (facultative wetland+), FACU2 (facultative upland2), FAC (facultative), FAC2 (facultative2), UPL (obligate upland), FACU (facultative upland), and NI (no indicator).
Liberty 110 ICP Emission Spectrometer. Extractable N pools were determined as the pre-incubation levels of NH4 and NO3. Net N mineralization was calculated as post-incubation N (NH4 plus NO3) minus pre-incubation N pools (NH4 plus NO3); net nitrification was calculated as post-incubation NO3 minus pre-incubation NO3. Data Analysis Prior to statistical analysis, the cumulative data sets (site and transect studies) were each tested for normality using Shapiro-Wilk test in Statistix 7.0 (Analytical Software 2000). All site study variables conformed to a normal distribution and were therefore used as untransformed data. All transect variables except Mg conformed to normality.
Magnesium data departed only slightly for normality (W 5 0.95; P , 0.10) and any attempts to transform them resulted in further departure. Therefore, transect Mg data were used untransformed. Means were compared between site types using ttests (Analytical Software 2000). Because spatial heterogeneity within a given site is reflected in the variance associated with the mean, differences in degree of spatial variability between sites were determined with F tests, which test for homogeneity of variances of two means (Zar 1999). Relationships among variables, sites, and vegetation were assessed with canonical correspondence analysis (CCA) using CANOCO version 4.5. Species diversity was calculated using the Shannon-Wiener Index (H9). This was based on cover for site data and on above-ground biomass for transect
Dick & Gilliam, SPATIAL HETEROGENEITY IN A SEASONAL WETLAND
955
Table 2. Soil and vegetation variables (mean 6 standard deviation) in 1-m2 plots (n 5 25) within pasture (PA) and seasonal wetland (SW) sites. Significant differences between variances determined by the F test and between means by the t-test (Zar 1999). Significant differences between sites at P , 0.05, P , 0.01, and P , 0.001 indicated by *, **, and ***, respectively. PA Net N mineralization rate (mg N/g soil/d) Net nitrification rate (mg NO3-N/g soil/d) NH4+ pool (mg NH4-N/g soil) NO32 pool (mg NO3-N/g soil) Organic matter (%) pH Ca (mg/g soil) Mg (mg/g soil) Al (mg/g soil) Species diversity (H9) Species evenness (J) Species richness (S) (species/1 m2)
0.5 0.7 5.7 9.8 8.3 4.4 769 122 0.5 1.38 0.78 5.9
data, using lne-transformed pi values. Species evenness (J) was calculated using the Pielou Index (Barbour et al. 1999). Species richness (i.e., species density) was determined as number of species per cell (1 m2 for grid data, 0.25 m2 for transect data). Transect samples were designated as SWt or PAt (inside or outside of seasonal wetland, respectively) based on their position along the transect (n 5 20 per site type). Variability of soil nutrients for SWt and PAt was assessed with F tests, whereas means were compared with t-tests. Relationships between variables, distance along transect, and vegetation were assessed with CCA using CANOCO version 4.5. Geostatistics were used to determine spatial pattern and degrees of spatial dependence of soil and vegetation variables and to compare these patterns between sites and along the transect, following approaches described in Schlesinger et al. (1996) and Iqbal et al. (2005). A semi-variogram was constructed for each variable using a spherical model with the computer program VESPER, version 1.62 (Minasny et al. 2005). We recognized three patterns resulting from our geostatistical analyses. The first pattern is spatial dependence, wherein four values are relevant in interpreting spatial pattern: 1) the nugget effect, which describes variability at 0 distance (hence, microvariability or error), 2) the structural component, which describes spatially-correlated variability, 3) the sill, which is total variability, or sample variance, and 4) the lag distance, which is the distance within which the variable is spatially dependent and beyond which is spatially independent. The second pattern is randomness, resulting when the nugget effect is high enough to approximate the sill (i.e., nugget:sill ratio