App. Envi. Res. 39 (3): 63-76
Applied Environmental Research Journal homepage : http://www.tci-thaijo.org/index.php/aer
Spatial Seasonal Distribution of Climatological Precipitation over the Middle of the Indochina Peninsula Nattapon Mahavik* Department of Natural Resources and Environment, Faculty of Agriculture, Natural Resources and Environment, Naresuan University,Phitsanulok, 65000, Thailand * Corresponding author: Email:
[email protected]; Phone: +66949274488 Article History Submitted: 28 July 2017/ Accepted: 7 September 2017/ Published online: 29 November 2017
Abstract Rainfall intensity and frequency are important parameters in agricultural development and water resource management. The middle of the Indochina peninsula climate is characterized by rainfall variability associated with complex terrains. The present study focuses on spatial seasonal extreme precipitation trends over the middle of the Indochina Peninsula for the 30 year period from 1978-2007. Daily gridded precipitation data obtained at 0.5° horizontal grid resolution from APHRODITE (Asian Precipitation-Highly Resolved Observational Data Integration Towards Evaluation of Water Resources) was used to detect the spatial trends with the use of the Man-Kendall and Theil-Sen approach. Extreme precipitation indices were selected from the WMO–CCL/CLIVAR list of extreme precipitation indices focusing on intensity and frequency. The study shows a consistently increasing upward trend at 10.04 days from the WDAY index. In seasonal analysis, the pre-monsoon trend shows a significant upward trend in the PRCTOT index, while the WDAY index for pre-monsoon season has the highest correlation coefficient in downward trend. Spatial analysis of extreme precipitation indices shows that the PRCTOT index of the pre-monsoon season has the largest percentage change in significant upward trend over the northern basins that are consistent with MAX and Mean but not for WDAY. In addition, the inter-annual relationship between the Oceanic Nino Index and PRCTOT is shown in relation with the La Niña phase for both April and May. Keywords: Seasonal variability; Extreme precipitation; Indochina Peninsula; APHRODITE
64
Introduction Agricultural development and water resource management are fundamental requirements of the Southeast Asia region including the middle of the Indochina Peninsula (ICP). In order to be adequately prepared for water management in the future, the spatial distribution of extreme precipitation must firstly be derived to establish a national management plan through the year. The internal and external variability of Asian monsoon rainfall has been studied on time scales ranging from weeks to several years [14]. The complex terrains of the region have impacts on rainfall patterns in the ICP associated with mountain ranges extend from north to south along the Indochina Peninsula with their orographical effects on precipitation during summer and winter monsoons [3, 5-7]. Furthermore, rainfall patterns in the ICP are also affected from a monsoon trough which induces tropical cyclones in the latter half of the monsoon season [8]. In addition, spatiotemporal variability of winter monsoon enhances for both the amount and extreme rainfall over Malaysia peninsular including southern part of Thailand [2]. Numerous studies have been published on heavy rainfall precipitation in different regions [1-2, 4, 9-11]. Endo et al. [4] revealed the spatial distribution of extreme precipitation over Southeast Asia using data from high density rainfall stations from the 1950s to the early 2000s. They found that heavy precipitation has been increasing in southern Vietnam, the northern part of Myanmar, and the Visayas and Luzon Islands in the Philippines, while it has been decreasing over this period in northern Vietnam. However, their studies focused on neither the middle of the ICP nor spatial seasonal variations of heavy rainfall. Limsakul et al. [1] found the significant relationship between variability of precipitation indices and the indices of ENSO and PDO over the Thailand using the quality control of gauge
App. Envi. Res. 39 (3): 63-76
rainfall data covering the period from 1955 to 2014. Nevertheless, the number of studies of changes in extreme precipitation over the middle of ICP is still limited. The present study intends to fill these research gaps by focusing on the middle of the ICP. Several methods to assess the trends of hydro-meteorological time series have been used. Recently, many researchers have applied various parametric and non-parametric statistics in an analysis of trends in their countries and regions [12-14]. It is recognized as critical to identify trends of extreme rainfall with these statistics at local scales according to the IPCC [15]. The General Circulation Model (GCM) has limitations in resolving local scales. Thus, the trend analysis of seasonal variations at subnational and local scales could determine actual rainfall patterns and provide milestones for numerical climate modeling. The objectives of this study were to (1) describe the inter-annual and intra-seasonal variability of extreme rainfall over the middle of the ICP, (2) assess the viability of intraseasonal variability of rainfall, (3) describe the spatial seasonal trends of extreme rainfall, and (4) analyze the relationship of extreme climatological rainfall with the Oceanic Nino Index. Data and methods Daily rainfall from 1978 to 2007 was obtained from gridded datasets from Asian Precipitation - Highly-Resolved Observational Data Integration Towards Evaluation (APHRODITE) [16]. The data contains a dense network of daily rain-gauge data for Asia including the Himalayas, South and Southeast Asia and mountainous areas in the Middle East. Drawn from a number of valid stations, it contains over 2.3 to 4.5 times the data available through the Global Telecommunication System network. The data has been used in several applications such as water resource management, flood analysis, and rainfall trends analysis
App. Envi. Res. 39 (3): 63-76
[17-19]. The 151 grids at resolution of 0.5° over the present study area have been used in an analysis of rainfall trends as shown in Figure 1. To identify the trends in extreme seasonal precipitation, two indices have been used: the PRCTOT and WDAY, from the WMO-CCL/CLIVA list [20]. In addition, mean and maximum daily rainfall has been calculated for each year as shown in Table 1. Endo et al. [4] suggest that PRCTOT and WDAY are effective indices for use in the analysis of
65
extreme rainfall trends for intensity and frequency, respectively. In this study, we excluded the southern part of Thailand from study as it will be further analyzed in subsequent research because it has a different characteristic of rainfall patterns compared with the middle of the ICP. The southern area has a post monsoon influence that continues from the summer monsoon season of the ICP as mentioned in Matsumoto [5].
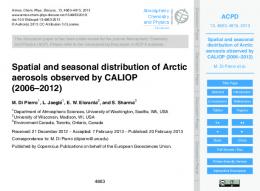
Figure 1 Topography of study area covering the middle of the Indochina Peninsula. Black and blue boundary indicates extent of basins and zones, respectively. Points indicate center point of gridded precipitation data. Table 1 Indices used in the present study No. Index Definition 1. PRCTOT Annual total precipitation from wet days 2. WDAY Number of days with daily precipitation≥1 mm 3. Mean Daily mean rainfall 4. Max Daily maximum rainfall Note: Wet day represents the days with at least 1 mm day-1 rainfall
Unit mm days mm day-1 mm day-1
66
1) Temporal analysis Rainfall trends are considered in both spatial and temporal variation over the basins as shown in Figure 2 (a). Inter-annual variations in trends have been studied as areal averages with indication of an increasing trend of rainfall over the study area (Figure 2 (b)). Next, monthly variation of extreme indices has been examined as areal averages over the gridded data set. In addition, seasonal variations of extreme rainfall indices were investigated for each individual grid and represented as spatial distribution of significant trends. The definition of seasons over the Asian monsoon region makes use of the following terms: pre-monsoon, monsoon, postmonsoon, and winter-monsoon seasons, based on previous studies [5, 7, 21] as shown in Table 2. The rainfall in monsoon season over the study area accounted for 73.66 % of total annual rainfall. Although monsoon onset varies from place to place over the Asian monsoon region, the monsoon onset in the middle of the ICP is around the middle of May [5, 7, 21]. The post-monsoon season also varies during the seasonal march of the monsoon in relation to the Intertropical Convergence Zone (ITCZ) following solar declination [5, 8, 22]. It is rather impractical for the present study to define the date of onset and the end season for each individual grid. Therefore, the postmonsoon season is roughly defined as the beginning of October to the end of November. At this phase, the lower part of the northeasterly tropospheric wind is strengthened to a transition phase into the winter-monsoon season. The winter-monsoon season is characterized by
App. Envi. Res. 39 (3): 63-76
the least amount of annual rainfall accounting for 1.27% of total annual rainfall. By contrast, the middle of Vietnam has a relatively large amount of rain during the winter-monsoon [23], while the middle of the ICP does not receive such a large amount of precipitation during that season.
Figure 2 Climatological mean precipitation over the middle of the ICP from 1978-2007 including (a) map of climatological precipitation and (b) area average of climatological mean precipitation; regression line is represented as a trend of precipitation.
Table 2 Season definitions used in the present study No. Season Periods th 1 Pre-monsoon 15 February to 14th May 2 Monsoon 15th May to 30th September 3 Post-monsoon 1st October to 30th November 4 Winter-monsoon 1st December to 14th February
Percentage amount of rainfall 12.83 73.66 12.24 1.27
App. Envi. Res. 39 (3): 63-76
67
2) Man-Kendall test The Mann-Kendell (MK) test as shown in Eq. 1 [24-25] has been adopted to determine rainfall trends for each individual grid in our analysis. The Mann-Kendall test was chosen due to its suitability as a non-parametric test for non-normally distributed data and because it is less sensitive to outliers compared to parametric tests [26-27]. The statistical significance level (α) was set at 0.05 to determine upward or downward trends. The magnitude of a significant trend (β) has been calculated on the basis of an approach proposed by Theil [28] and Sen [29] which hereafter is referred to as TSA. For details of calculations the reader is referred to Pingale et al. [30]. The magnitude of significant trends of each individual gridded dataset is calculated as the percentage upward or downward of the mean (E(Xk)) of single data over the observation periods (T) at grid k.
100
%
(Eq. 1)
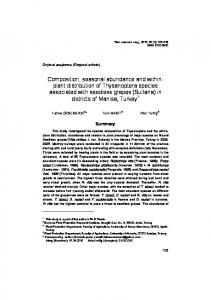
Results and discussion 1) Inter-annual rainfall variability The average extreme rainfall patterns over the 30 year period studied from all indices over grids is shown in Figure 3. The inter-annual variability of rainfall time series is clearly shown during the observation years. The deviation of each year from the mean is indicated by an error bar expressing the spatial variability of value indices. On the average, over the 30 year period under investigation, significant upward trends are evident for all indices except for MEAN trends which indicate smaller upward trends. The similarity of variation in time series is found among PRCTOT, MEAN and WDAY indices but not in the MAX. Not only do wet years show higher values, but also dry years show high values for MAX, e.g. year 2005. Figure 3 (a) shows PRCTOT trends with a gentle slope indicating rainfall quantity had
increased at 75.9 mm. The deviation of MAX value among grids tended to be low in drier years, i.e. 1992, 1993, and 1998 which recorded 499, 520 and 474 mm year-1. Further, the wet years tend to show high spatial variability in the PRCTOT index, e.g. in 1994 (736mm), 1999 (641 mm), and 2006 (635mm). The PRCTOT in 2006 coincides with the occurrence of the flood over the Chao Phraya basin [31]. The sharper slope in the WDAY index can be seen in Figure 3 (b) indicating an increase at 10.04 days with an average spatial variability at 24.85 days. The highest deviation in the WDAY is 37.5 days that occurred in the flood year of 2006 over the Chao Phraya basin. Figure 3 (c) shows a slightly upward trend of the MEAN index that indicates increasing mean rainfall of 0.27 mm over the 30 year period associated with the spatial average of rainfall variability at 1.77 mm. The highest MEAN is found in the flood year of 2006 at 4.12 mm day-1. Figure 3 (d) shows the upward trends from the MAX index at a rate of 16.77 mm over the 30 year period under study. Although the highest MEAN at 242 mm in year 2005 does not coincide with the occurrence of a flood, the high quantities of MAX indicates severe increasing trends that will likely tend to continue over the near future. Further, the largest deviation of MAX is also located in year 2005 at the rate of 34.11 mm. Fudeyasu et al. [32] found that during the peak monsoon period (late July– mid September), the number of Tropical cyclones (TCs) over the ICP was greater in El Niño years than in La Niña years. The formation of TCs in the South China Sea and the Philippine Sea has increased in El Niño years. This suggests that the quantity of rainfall brought by TCs may increase during the phase of an El Niño year.
68
Figure 3 Annual rainfall trends over the observation period 1978-2007 (a) PRCTOT, (b) WDAY, (c) Mean, (d) Max. Standard bars are shown for each year. Upward arrow indicates increasing trend of each parameter. Filled and unfilled stars indicate wet and dry years (See text for further explanations).
App. Envi. Res. 39 (3): 63-76
The monthly and seasonal means of rainfall indices are obtained by averaging all grids during the 1978-2007 period as shown in Figure 4. Monsoon season is dominant for all indices followed by the winter monsoon as the lowest contributor of rainfall. PRCTOT in monsoon season is the largest contributor of rainfall showing the highest mean at 981.25 mm (Figure 4 (a)) accounting for 73.66 % of annual mean rainfall during the observation period. The pre-monsoon and post-monsoon PRCTOT are relatively comparable at 170.92 mm and 163.02 mm, respectively. The PRCTOT in the winter monsoon season is relatively small at 17.02 mm accounting for 1.27% of annual mean rainfall. The PRCTOT for August is the wettest month during the monsoon season followed by September and July. WDAY has 161 days per year of which 106.90 days were occupied by monsoon accounting for 66.29% of total rainfall in the WDAY, while the premonsoon, post-monsoon, and winter monsoon seasons accounted for 17.62%, 13.61% and 2.48%, respectively, as shown in Figure 4 (b). The MEAN of monsoon is largely dominant followed by post-monsoon, pre-monsoon, and winter monsoon. The MEAN of post-monsoon is larger than that of pre-monsoon because it receives a relatively high mean rainfall during October (4.15 mm) as shown in Figure 4 (c). The highest quantity of rainfall in MEAN occurs in August, while the lowest occurs in January at 0.18 mm. Figure 3 (d) shows the highest MAX in monsoon (148.95 mm) followed by post-monsoon (96.00 mm), pre-monsoon (72.16mm), and winter monsoon (33.70 mm), respectively. Furthermore, September shows the highest MAX (76.15 mm) rainfall followed by August (75.46 mm) as shown in Figure 4 (d).
App. Envi. Res. 39 (3): 63-76
Figure 4 Monthly rainfall averages over the observation period 1978-2007 (a) PRCTOT, (b) WDAY, (c) Mean, (d) Max. Percentage values indicate the seasonal ratio to the total amount of all seasons. 2) Seasonal rainfall variability The correlation results of seasonal trends for all indices have been summarized in Table 3. Generally, the upward trends are mainly dominant in the middle of the ICP on a seasonal basis except for the post-monsoon season showing downward trends in all indices. The pre-monsoon shows higher correlation coeffi-
69
cient of significant upward trends in nearly all indices except for WDAY. PRCTOT in the pre-monsoon season has a correlation coefficient at 0.3899 at the 5% significance level. MEAN and MAX of the pre-monsoon season have a correlation coefficient of upward trends at the 10% significance level. While monsoon season trends are not evident for all indices, they show slightly upward trends. Most indices for the post-monsoon season show downward trends. The WDAY in post-monsoon season has the highest correlation coefficient of downward trends. The winter monsoon season does not have evident trends but they tend to be upward except in the WDAY index which indicates a downward trend. Limsakul et al. [1] found that rainfall amount of annual analysis showed increasing trends, while rainfall frequency exhibited decreasing trends over the Thailand. However, their results during dry season period (November-April) have showed the similarity of pre-monsoon result for the present study that there are various stations indicating the increasing trends of rain day over the middle of ICP. Significant upward trends are evident during the pre-monsoon season (Figure 5) in the PRCTOT and MAX indices. The pre-monsoon season in PRCTOT shows higher variation with rainfall deviation at 57.60 mm during the 30 year period as shown in Figure 5 (a). The highest rainfall amount in PRCTOT is located in the year 1999 at 303.7 mm accounting for 177% compared with climatological annual mean rainfall of the pre-monsoon season over the study area. The increased rainfall rate evident in the PRCTOT is at 75.25 mm over the period. Likewise, the MAX index shows significant upward trends over the observation period with an increasing rate at 5.40 mm as shown in Figure 5 (b). Inter-annual variation in the MAX index is expressed with a deviation at 5.00 mm over the period of observation with the highest value at 28.33 mm in year 1986.
70
App. Envi. Res. 39 (3): 63-76
Table 3 Significant upward or downward trends at 5% or 10% level of significance indicated by triangle (reversed), Cor (correlation coefficient) derived from regression analysis (**, * are 5% and 10% significance levels, respectively), while Trend is derived from MK-Test (underline is at 5% significance) Season
PRCTOT Cor Trend Pre-monsoon 0.3899** ▲ Monsoon 0.0429 ▲ Post-monsoon -0.1048 ▼ Winter-monsoon 0.1896 ▲
WDAY Cor Trend 0.1951 ▲ 0.0166 ▲ -0.3055 ▼ -0.0038 ▼
MEAN Cor Trend 0.3369* ▲ 0.0475 ▲ -0.1061 ▼ 0.2053 ▲
MAX Cor Trend 0.3219* ▲ -0.1843 ▼ -0.0017 ▼ 0.0727 ▲
period accounts for a major part of the total annual rainfall in the tropics, the monsoon variability might affect the total amount of rainfall.
Figure 5 Rainfall trends for pre-Monsoon season over the 30 period (1978-2007) for (a) PRCTOT, and (b) MAX. Upward arrow indicates increasing trend of each parameter. Endo et al. [4] found both upward and downward trends in annual rainfall over the middle of the ICP, although their study used different data and periods from the present study. It is quite evident that monsoon rainfall variability has intensified in recent decades [34]. In addition, rainfall variability in Thailand might be associated with El Niño -Southern Oscillation (ENSO) [35]. Since the quantity of rainfall during the boreal summer monsoon
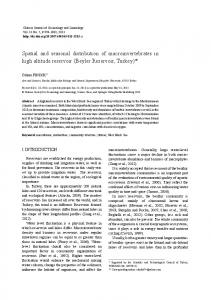
3) Spatial seasonal trends in extreme rainfall Seasonal trends of extreme rainfall indices are investigated with respect to spatial distribution in this section. The MK and TSA methods to estimate slopes were used to test a time series of each individual grid represented at the 5% significance level. Percentage changes of trends are classified into 3 classes: 0 to 25%, 25 to 50%, and above 50%. Generally, pre-monsoon trends show only upward trends distributed in a wide area in the middle of the ICP. The significant upward trends in PRCTOT in the premonsoon season densely concentrate over the northern basins of the study area where main tributaries of the Chao Phraya basin are located as shown in Figure 6 (a). On the other hand, the Nan basin does not show any significant trends in the pre-monsoon season. The largest percentage change of significant upward trends in PRCTOT in the season is about 94.97% located in the Salawin basin. Mae Klong and Eastern coast gulf basins have also relatively larger upward pre-monsoon precipitation trends. The middle parts of the Chi and Mun basins also have large significant upward trends in the PRCTOT during pre-monsoon season.
App. Envi. Res. 39 (3): 63-76
Figure 6 (b) shows widespread distri-bution of significant upward trends in the WDAY index which displays a relatively smaller percentage change compared with PRCTOT. WDAY in Eastern coast gulf and Mun basins shows distribution of significant upward trends in a wider area during the pre-monsoon season. The MEAN index clearly shows a concentration of significant upward trends over the northern part of the study area with percentage changes above 50% as shown in Figure 6 (c). The Nan basin again does not have any grids indicating significant upward trends. The significant upward trends evident in the MAX index are distributed sparely over the
71
study area as shown in Figure 6 (d). There is a high concentration of grids with significant upward trends over the Salawin, while Ping, Wang and Yom basins have isolated grids in the MAX index with significant upward trends. Further, the Mun, Petchabun, Mea Klong, Tha Chin and Phetchaburi basins also show significant upward trends as shown in Figure 6 (d). Promchote et al. [18] found high rainfall anomalies in the pre-monsoon season, especially during March in 2011, which might be one of the factors causing the great flood in 2011 over the Chao Phraya basin. The increasing pre-monsoon rainfall may be related to strengthened pre-monsoon northwesterly winds.
Figure 6 Trends of pre-monsoon seasons in (a) PRCTOT, (b) WDAY, (c) Mean, (d) Max. Trends are expressed as percentage variations with respect to the mean value using Sen’s estimator of slope from 1978-2007. Blue (inverse red) triangle indicates increasing (decreasing) trends.
72
The significant trends of monsoon seasons have been investigated during the 30 year study period over the middle of the ICP (Figure not shown). Generally, there are both upward and downward trends appearing in all indices but the spatial distribution is quite spare and there is only a relatively small percentage change compared with the PRCTOT index which is consistent with Manton et al. [9] who found that extreme rainfall trends were generally less spatially coherent than were those for extreme temperature. The PRCTOT index shows significant upward trends during monsoon season located over the Wang and Yom basins, while the Mun basin has only significant downward trends located over the upper stream. The WDAY index has the significant trends during the monsoon in which the smaller percentage change for both upward and downward trends occurs at less than 50%. The significant upward trends located over the Mae Klong and Tha Chin basins show relatively larger percentage change compared with Northern and Northeastern basins of the study area. Mun, Mae Klong, and Prachinburi have significant downward trends in the WDAY index at less than 25% change during the period of investigation. Significant downward trends are clearly shown over the upper stream and the middle of the Mun basins including nearby basins (Prachinburi and Tonle Sap) (Figure not shown). The relatively large significant down-ward trends in the MAX are located over the middle of the Chi basin and partly distributed to the Mun basin during monsoon season. When considered with the MAX and WDAY indices over the Chi basin, the weak upward rainfall may occur during monsoon periods. In addition, the significant downward trends are quite evident over the Mun basin for all rainfall indices which may relate to the decreasing trends in tropical regions. Sharma and Babel [35] found that there are insignificant downward trends of annual rainfall over the western
App. Envi. Res. 39 (3): 63-76
part of Thailand (Mae Ping and Mae Klong river basins) using daily rainfall data from 15 stations. In addition, the maximum number of dry days tends to increase in their results, which is consistent with the downward trend during monsoon periods indicated in the present study over the Mekong river basin of western Thailand. The spatial distribution of the significant trends in post-monsoon season is quite spare compared with pre-monsoon and monsoon seasons. Generally, a significant downward trend is dominant (Figure not shown). For instance, significant downward trends were found in the PRCTOT, WDAY and MEAN indices over the Phetchabun basin. Likewise, significant downward trends are found in large contiguous areas over lower parts of the Nan and Phetchabun basin in the WDAY index with percentage changes above 50%. A significant upward trend seen in the MAX index exists in the Mun basin with greater than 50% change, while the Me Kong basin displays a significant downward trend at over 50% change. Significant trends in rainfall levels during the winter monsoon are found (Figure not shown) for the 30 year period under study. As can be seen, significant downward trends are dominant for all indices except for WDAY. Similarly, significant downward trends from all indices are found in the upper part of the Phetchabun basin, while the lower part of the Nan basin experienced significant downward trends at over 50% change in the PRCTOT and WDAY indices. The significant upward trends occurs only over the Phetchaburi and Mae Klong basins at over 50% change. 4) Relationship of pre-monsoon climatological rainfall with Oceanic Nino Index The question arises as to when the significant upward trends occur during pre-monsoon season over the northern basins of the study area as shown in Figure 6 (a). For instance, can
App. Envi. Res. 39 (3): 63-76
any relationship be demonstrated between these significant upward trends during the premonsoon months and the El Niño–Southern Oscillation (ENSO)? It has been suggested that ENSO dominates the global inte-rannual variability of rainfall [36-38], though ENSO is not a major contributor to the inter-annual variability in total amount of tropical rainfall [39]. Therefore, the Oceanic Nino Index (ONI) was consulted, using regression analysis, over the Nino 3.4 region to determine if a relationship exists with monthly area average in the PRCTOT during pre-monsoon months. The results show that the PRCTOT data has a weak correspondence with ONI during the premonsoon months, which are April and May, as indicated by correlation coefficient (corr). The significant correlations for April and May are 0.474 (1% significance level) and -0.448 (5% significance level), respectively. The negative sign of the correlation coefficient indicates that the monthly mean in the PRCTOT has a relationship with ONI during the La Niña phase which may weakly correspond to wet conditions over the region. Recently, Cook and Buckley [40] found a weak relationship between monsoon rainfall in Thailand and the ENSO. Additionally, Muangsong et al. [41] found, using laminated stalagmite NJ-0901, that the Indian Ocean Dipole and ENSO are significant climate modulations that may have an impact on Thailand’s rainfall patterns. The results of a weak relationship in rainfall patterns during pre-monsoon months with the ONI index associated with significant upward trends, as shown in Figure 7, suggests that the ENSO effects may be modulated by climate change impact including in the present study region. Limsakul et al. [1] suggested that negative correlations between various precipitation indices and Enso indices imply to have abundant precipitation associated with more extreme events during La Niña years and the Pacific Decadal Oscillation cool phase. Further
73
investigation should be pursued on the relationships of the ENSO to modulation of precipitation trends over the basin located in the middle of the ICP.
Figure 7 Correlation between the ONI and PRCTOT for April over the study period. Conclusions Extreme precipitation indices were selected from the WMO CCL/CLIVAR list to quantify a climatological rainfall trend of the middle Indochina peninsula (ICP) that is located in the mainland of Thailand. The daily gridded precipitation dataset over a period of 30 years (1978-2007), known as APHRODITE, was used to determine trends of extreme precipitation in the indices studied. The Man-Kendall (MK) was applied to compute the median slope of the trend with the approach of Theil [28] and Sen [29] to find the significant trends of extreme indices in a time series. The results of the present study are summarized as follows: The rainfall trends are increasing upward in all selected indices with different amplitudes. A sharper slope was found in the WDAY index that shows a consistently increasing upward trend at 10.04 days during the period. In the seasonal analysis, the pre-monsoon trend shows that data from the PRCTOT has a correlation coefficient at 0.3899 (5% significance) in an upward trend, while the WDAY index of the pre-monsoon season has the highest correlation coefficient in a downward trend. Spatial analysis of extreme indices shows that PRCTOT for the
74
pre-monsoon season shows the largest per- [5] centage change in significant upward trends over the northern basins which is consistent with the MAX and Mean indices but not for WDAY. Furthermore, the inter-annual rela- [6] tionship between the ONI and PRCTOT was weakly correlated during pre-monsoon season. However, after a month by month analysis, it was seen that both April and May had a relationship with the La Niña phase. [7]
App. Envi. Res. 39 (3): 63-76
Matsumoto, J. Seasonal transition of summer rainy season over Indochina and adjacent monsoon region. Advances in Atmospheric Sciences, 1997, 14, 231-245. Xie, S.-P., Xu, H. M., Saji, N. H., Wang, Y. Q. Role of narrow mountains in large-scale organization of Asian monsoon convection. Journal of Climate, 2006, 19, 3420-3429. Takahashi, H. G., Yasunari, T. A climatological monsoon break in rainfall over Indochina—A singularity in the Acknowledgements The author would like to thank Naresuan seasonal march of the Asian summer University for partially funding the study with monsoon. Journal of Climate, 2006, 19, a research grant with the project code 1545–1556, doi:10.1175/JCLI3724.1. R2559C111. Additional support was also ob- [8] Takahashi, H. G., Fujinami, H., Yasunari, tained from Advancing coDesign of integrated T. Matsumoto, J., Baimoung, S. Role of strategies with AdaPtation to climate change in Tropical Cyclones along the Monsoon Thailand (ADAP-T) in the fresh water group Trough in the 2011 Thai Flood and (ST2-W1) supported by JICA. We also extend Interannual Variability. Journal of Cliour thanks to the editor and two anonymous mate, 2015, 28, 1465-1476, doi: 10. reviews for their insightful critiques and 1175 /JCLI-D-14-00147.1 constructive comments to improve the quality [9] Manton, M. J., and co-authors. Trends of the earlier version of the manuscript. in extreme daily rainfall and temperature in Southeast Asia and the south Pacific: 1961-1998. International Journal References [1] Limsakul, A., Singhruck, P. Long-term of Climatology, 2001, 21, 269-284. and variability of total and extreme [10] Zhang, X.-B., and co-authors. Trends precipitation in Thailand. Atmospheric in Middle East climate extreme indices Research, 2016, 169, 301-317. from 1950 to 2003. Journal of Geo[2] Limsakul, A., Singhruck, P., Wang, L. physical Research, 2005, 110, doi:10.1029/ Climatology and spatio-temporal vari2005JD006181. ability of wintertime total and extreme [11] Klein Tank, A. M. G., and co-authors. Changes in daily temperature and prerainfall in Thailand during 1970-2012. cipitation extremes in central and south EnvironmentAsia, 2017, 10(2), 162-176. Asia. Journal of Geophysical Research, [3] Hoyos, C. D., Webster, P. J. The role of 2006, 111, doi:10.1029/2005JD 006316. intraseasonal variability in the nature of Asian monsoon precipitation. Journal [12] Karl, T. R., Knight, R.W. Secular Trends of Precipitation Amount, Frequency, and of Climate, 2007, 20, 4402-4424. Intensity in the United States. Bulletin [4] Endo, N., Matsumoto, J., Lwin, T. of the American Meteorological Society, Trends in precipitation extremes over 1998, 79(2), 231-241. Southeast Asia. SOLA. 2009, 5, 168‒ 171, doi:10.2151/sola.2009-043.
App. Envi. Res. 39 (3): 63-76
[13] Yue, S., Hashino, M. Long term trends of annual and monthly precipitation in Japan. Journal of the American Water Resources Association, 2003, 39(3), 587-596. [14] Yavuz, H., Erdogan, S. Spatial analysis of monthly and annual precipitation trends in Turkey. Water Resources Management, 2012, 26 (3), 609-621. [15] IPCC, Climate Change 2007: The Physical Science Basis. Contribution of Working Group I to the Fourth Assessment Report of the Intergovernmental Panel on Climate Change [Solomon, S., D. Qin, M. Manning, Z. Chen, M. Marquis, K. B. Averyt, M. Tignor and H. L. Miller (eds.)]”. Cambridge University Press, Cambridge, United Kingdom and New York, NY, USA, 2007. [16] Yatagai A., Kamiguchi, K., Arakawa, O., Hamada, A., Yasutomi, N., Kitoh, A. AHPRODITE: constructing a longterm daily gridded precipitation dataset for Asia based on a Dense Network of Rain Gauges. Bulletin of the American Meteorological Society, 2012, 93, 14011415. [17] Cruz, F. T., Narisma, G. T., Villafuerte II, M. Q., Cheng Chua, K. U., Olaguera, L. M. A climatological analysis of the southwest monsoon rainfall in the Philippines. Atmospheric Research, 2013, 122, 609-616. [18] Promchote, P., Wang, S.-Y. S., Johnson, P G. The 2011 Great Flood in Thailand: Climate Diagnostics and Implications from Climate Change. Journal of Climate, 2016, 29, 367-379, doi: 10.1175/JCLID-15-0310.1 [19] Awan, J. A., Bae, D-H. Kim, K-J. Identification and trend analysis of homogeneous rainfall zones over the East Asia monsoon region. International Journal of Climatology, 2015, 35, 1422-1433.
75
[20] Peterson, T. C., Folland, C., Gruza, G., Hogg, W., Mokssit, A., Plummer, N. Report on the activities of the Working Group on Climate Change Detection and Related Rapporteurs 1998–2001. World Meteorological Organisation Rep. WCDMP-47, WMO-TD 1071, Geneva, Switzerland, 2001: 143 pp. [21] Wang, B., LinHo. Rainy seasons of the Asian–Pacific summer monsoon. Journal of Climate, 2002, 15, 386-398. [22] Singhrattna, N. B., Rajagopalan, K., Kumar, K., Clark, M. Interannual and interdecadal variability of Thailand summer monsoon. Journal of Climate, 2005, 18, 1697-1780, doi:10.1175/ JCLI3364.1. [23] Yokoi, S., Matsumoto, J. Collaborative effects of cold surge and tropical depression-type disturbance on heavy rainfall in central Vietnam. Monthly Weather Review, 2008, 136, 3275-3287. [24] Mann, H. B. Nonparametric Tests Against Trend. Econometrica, 1945, 13, 245-259. [25] Kendall, M. G. Rank Correlation Methods. Griffin, London, England, 1975. [26] Yue S., Pilon, C.G. Power of the MannKendall and Spearman’s rho tests for detecting montonic trends in hydrological series. Journal of Hydrology, 2002, 259, 254-271. [27] Ya-ning, C., Wei-hong, L., Chang-chun, X., Xin-ming, H. Effects of climate change on water resources in Tarim River Basin, Northwest China, Journal of Environmental Sciences, 2007, 19, 488-493. [28] Theil, H. A Rank-Invariant Method of Linear and Polynomial Regression Analysis, I, II, III, Nederl. Proceedings of the Koninklijke Nederlandse Akademie van Wetenschappen, 1950, 53, 386392; 512-525; 1397-1412. [29] Sen, P. K. Estimates of the Regression Coefficient Based on Kendall’s Tau.
76
[30]
[31]
[32]
[33]
[34]
[35]
App. Envi. Res. 39 (3): 63-76
Journal of the American Statistical Association, 1968, 63, 1379-1389. Pingale, S. M., Khare, D., Jat, M. K., Adamowski, J. Spatial and temporal trends of mean and extreme rainfall and temperature for the 33 urban centers of the arid and semi-arid state of Rajas-than, India, Atmospheric Research, 2014, 138, 73-90. Benfield, A., 2011 Thailand floods event recap report: Impact forecasting—March 2012. Aon Corporation Rep., 2012: 38 pp. [online] Available from: http:// thoughtleadership.aonbenfield.com/ Documents/20120314_impact_forecast ing_thailand_flood_ event_recap.pdf. Fudeyasu, H., Iizuka, S., Matsuura, T. Impact of ENSO on landfall characteristics of tropical cyclones over the western North Pacific during the summer monsoon season. Geophysical Research Letter, 2006, 33, doi:10.1029/2006GL 027449. Kripalani, R. H., Kulkarni, A. Rainfall variability over South-east Asia—connections with Indian monsoon and ENSO extremes: New perspectives. International Journal of Climatology, 1997, 17, 1155-1168, doi:10.1002/ (SICI)1097-0088(199709)17:11,1155:: AID-JOC188.3.0.CO;2-B. Singhrattna, N. B., Rajagopalan, K., Kumar, K., Clark, M. Interannual and interdecadal variability of Thailand summer monsoon. Journal of Climate, 2005, 18, 1697-1780, doi:10.1175/JCLI 3364.1. Sharma, D., Babel, M. S. Trends in extreme rainfall and temperature indices in the western Thailand. Interna-
[36]
[37]
[38]
[39]
[40]
[41]
tional Journal of Climatology, 2014, 34, 2393-2407. Trenberth, K. E., Caron, J. M., Stepaniak, D. P., Worley S. Evolution of El Niño–Southern Oscillation and global atmospheric surface temperatures. Journal of Geophysical Research, 2002, 107, 4065, doi:10.1029/2000JD 000298. Smith, T. M., Yin, X., Gruber, A. Variations in annual global precipitation (1979–2004), based on the Global Precipitation Climatology Project 2.5° analysis. Geophysical Research Letters, 2006, 33, L06705, doi:10.1029/2005GL 025393. Gu, G., Adler, R. F., Huffman, G. J., Curtis, S. Tropical Rainfall Variability on Interannual-to-Interdecadal and Longer Time Scales Derived from the GPCP Monthly Product. Journal of Climate, 2007, 20, 4033-4046, doi: 10.1175/JCLI 4227.1. Su, H., Neelin, J. D. The scatter in tropical average precipitation anomalies. Journal of Climate, 2003, 16, 3966-3977. Cook, B. I., Buckley, B. M. Objective determination of monsoon season onset, withdrawal, and length. Journal of Geophysical Research, 2009, 114, D23109, doi:10.1029/2009JD012795. Muangsong, C., Cai, B., Pumijumnong, N., Hu, C., Cheng, H. An annually laminated stalagmite record of the changes in Thailand monsoon rainfall over the past 387 years and its relationship to IOD and ENSO. Quaternary International, 2014, 349.