Spatially Explicit Modeling of Grazing Effect on Soil Organic Carbon Change in the Green River Basin, Wyoming Zhengpeng Li, Shuguang Liu, Zhengxi Tan Science Applications International Corporation (SAIC), contractor to U.S. Geological Survey (USGS) Center for Earth Resources Observation and Science (EROS), Sioux Falls, SD 57198. Corresponding author’s email:
[email protected] Work performed by SAIC under USGS contract 03CRCN0001.
Introduction
Model Simulation and Results
The Green River Basin (GRB) in Wyoming is managed primarily by the Bureau of Land Management (BLM). Little research has been done in this area to investigate impacts of range management and climate change on carbon dynamics. Using remotely sensed data and a biogeochemical model Erosion- DepositionCarbon-Model (EDCM) [1], we estimated the soil organic carbon dynamics in the area and the grazing effect on the ecosystem.
Site Description
Grass NPP (gC m-2 year -1)
-2
250
250
200
200
150
150
100
100
50
50
0
0
1 -2
Sagebrush total sytem carbon (gC m )
5000 4500 4000 3500 3000 2500 2000
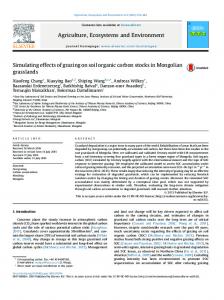
Figure 2. GRB NLCD 2001 and research area (red circle)
GRB is located in southwestern Wyoming. Most of the area is sagebrush grassland (> 80%). The dominant vegetation is Wyoming big sagebrush. Annual precipitation ranges from 150 to 500 mm. Mean monthly temperature varies from -8 to 17C. The growing season starts in April and ends in October.
Methods
1999
1996
1993
1972
2002
1999
1996
1993
1990
1987
1984
1981
1978
1975
1972
2000
1990
2200
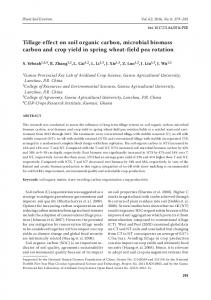
Figure 5. Simulation on NPP, total soil organic carbon and total ecosystem carbon change of grass under different grazing treatment
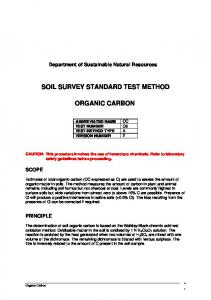
Figure 6. Simulation on NPP, total soil organic carbon and total ecosystem carbon change of sagebrush under different grazing treatment
Grassland is carbon neutral under the no grazing condition. Production increases under grazing Scenario I but decreases under grazing Scenario II.
Sagebrush also is carbon neutral under the no grazing condition. Sagebrush carbon stock decreases faster under Scenario I than grass.
Simulated soil carbon and ecosystem carbon increase for about 6-7 years after shrub removal but decrease in the long term. Grazing will enhance soil carbon loss.
NPP gC m-2 year-1
NPP (gC m-2 year-1)
400
200 150 100 50
grass
sagebrush
100
Scenario I Scenario II
80
Grass
Sagebrush
100
Linear (Sagebrush)
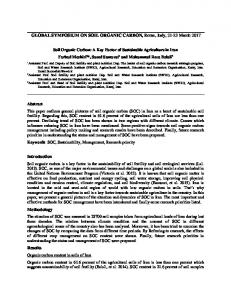
y = 4.29x + 35.37 R2 = 0.63
50
Linear (Grass)
0 10 20 30 40 yearly growing season precipitation (cm)
Figure 8. Correlation between simulated yearly NPP and growing season precipitation
20 0 grass
200 100 Sheep and lamb
Cattle all
sagebrush
Figure 7. Comparison of NPP and grazing removed carbon under Scenarios I and II on grass and sagebrush
2005
2000
1995
1990
1985
1980
1975
0
Figure. 4. GRB live stock change from 1975 to 2003 (USDA NASS)
Sagebrush had less carbon removed than grass with similar NPP. Grass production is less effected by grazing than sagebrush.
Figure 10. Simulated NPP change of sagebrush and grass response to future climate change
The yearly NPP for both sagebrush and grass are highly correlated with growing season precipitation (p< 0.05).
31
Both sagebrush and grass production are more sensitive to precipitation than temperature change in the future. Sagebrush is more temperature tolerant than grass.
~ No grazing led to little change in ecosystem carbon stock under both sagebrush and grass. Grazing had a larger impact on a sagebrush system than on a grass system, and Scenario II turned both systems from carbon neutral to carbon sources.
150
0
Carbon removed by grazing (gC m-2year-1)
40
Head (1000)
y = 4.37x + 61.06 R2 = 0.59
200
0
60
300
Grass
Conclusions
250
~ Moderate Resolution Imaging Spectroradiometer (MODIS ) Net Primary Productivity (NPP) 2000 – 2004 average [1] was used for constraining the NPP of grass and sagebrush in the model. ~ Parameterization of grassland was from literature [3], and parameterization of sagebrush was based on local observation from University of Wyoming [4]. ~ Spinning-up model runs of 200 years were used to get the initial conditions. ~ Two grazing scenarios were simulated: Scenario I: 10 percent removal of aboveground live biomass (grass), 3 percent removal of leaves and fine branches (sagebrush). Scenario II: 30 percent removal of aboveground live biomass (grass), 5 percent removal of leaves, fine branches (sagebrush). Grazing intensity was derived from USDA livestock statistics from 1975 to 2006 in five counties inside the GRB [5].
6 11 16 21 26 years after sagebrush removal
Figure 9. Simulated impacts of grazing on soil carbon and total system carbon change after conversion of sagebrush to grass
no grazing scenario I scenario II
1987
no grazing scenario I scenario II
1984
2400
1981
2600
1975
2800
1978
3000
Wetland
Sagebrush
2000
2000 -2
Grass total system carbon (gC m )
Crop/Pasture
0
no grazing scenario I
2200
2000
Shrub/Grass
U.S. Department of the Interior U.S. Geological Survey
50
2500
2200
Forest
Figure. 1. Wyoming National Land Cover Data (NLCD) 2001 map
100
3000
2400
Tranisitional
Barren
no change prec -30% temp +30%
150
3500
2600
2400
Mining
Future climate change impact on NPP (gC m-2 year -1)
2800
2600
Urban
200
Total system carbon change (gC m-2) Sagebrush total soil carbon (gC m-2)
Grass total soil carbon (gC m-2)
Water
-1
Sagebrush NPP (gC m year )
2800
Figure. 3. MODIS NPP average 2001-2004 in GRB
Total soil carbon change (gC m-2) 3200 3000 2800 2600 2400 2200 2000
50
~ The carbon cycling is water limited. Projected decrease of precipitation in the future may alter the system from carbon neutral (natural systems) to a carbon source. ~ Transforming shrub to grassland may enhance the soil carbon sequestration in about 6 -7 years but will likely lose carbon in the long run, consistent with other studies [6][7]. Reference: [1] Liu, S., N. Bliss, E. Sundquist and T.G. Huntington, 2003. Modeling carbon dynamics in vegetation and soil under the impact of soil erosion and deposition. Global Biogeochemical Cycles, Vol. 17, No. 2, 1074, doi:10.1029/2002GB002010. [2] University of Montana, MODIS NPP mean 2001 to 2004. [3] CENTURY Soil Organic Matter Model Technical Documentation. [4] Elise Pendall, Department of Botany, University of Wyoming (Unpublished data). [5] USDA, National Agricultural Statistics Service, http://www.nass.usda.gov/Statistics_by_State. [6] Bechtold, H.A. Inouye, R.S., Distribution of carbon and nitrogen in sagebrush steppe after six years of nitrogen addition and shrub removal, Journal of Arid Envrionments, 71 (2007) 122-132. [7] Norton, J.B., Monaco, T.A., Norton, J.M., Johnson, D.A., Jones, T.A., 2004. Soil morphology and organic matter dynamics under cheatgrass and sagebrush-steppe plant communities. Journal of Arid Environments 57, 445–466. December 2008