POPULATION AND COMMUNITY ECOLOGY
Species Abundance and Seasonal Activity of Mosquitoes on Cattle Facilities in Southern Alberta, Canada T. J. LYSYK1 Research Centre, Agriculture and Agri-Food Canada, Lethbridge, AB, Canada T1J 4B1
J. Med. Entomol. 47(1): 32Ð42 (2010)
ABSTRACT Seventeen mosquito species were collected at eight cattle facilities in southern Alberta, Canada, during 2002Ð2004. Five species, Culiseta inornata (Williston), Aedes dorsalis (Meigen), Culex tarsalis (Coquillett), Aedes vexans (Meigen), and Aedes campestris Dyar & Knab accounted for 93.6% of the mosquitoes collected. Culiseta inornata, Ae. dorsalis, and Ae. campestris were trapped earliest in the year. Cs. inornata was active latest in the year and had the longest period of activity. Ae. dorsalis Þnished activity in late September and had the second longest period of activity. Ae. campestris was the Þrst to complete its activity, resulting in a moderate period of activity. Cu. tarsalis and Ae. vexans appeared later in the season, disappeared by late September, and had the briefest periods of activity. Logistic regression was used to estimate relationships between the proportions of traps positive and mean weekly abundance for each species. Fifty percent of the traps were positive when abundance averaged 0.19 Ð 0.30 females per trap night. Logistic regression was used to determine the timing of the onset of activity and temperature thresholds for ßight. Relationships between the proportion of positive traps and mean weekly temperature indicated that Cs. inornata had the lowest temperature threshold, Cx. tarsalis the greatest, and the remaining species had intermediate thresholds. Logistic regression indicated that mosquito presence was primarily affected by temperature and accumulated degree-days, with only Ae. vexans exhibiting a positive response to precipitation. The models can be used to predict the onset of activity as deÞned by when populations exceed a particular threshold. KEY WORDS mosquitoes, abundance, seasonal activity, cattle
The World Animal Health Organization lists ⬇120 reportable animal diseases of international concern (http:// www.oie.int/eng/maladies/en_classiÞcation2009.htm? e1d7). These include 26 diseases that affect multiple species and 14 that affect cattle. Of these, 15 and Þve, respectively, involve arthropods in the transmission cycle. Arthropod transmitted disease can become established in an area through the introduction of an infected exotic vector (Lounibos 2002, Reiter 2008) or through the introduction of a pathogen into an indigenous vector. Dramatic examples of the latter are the introduction and spread of West Nile virus throughout North America since 1999 and Bluetongue virus throughout Europe since 2006 (Carpenter et al. 2009). Diseases of particular concern to the North American livestock industry that may be vectored by mosquitoes include Japanese encephalitis (Nett et al. 2009) and Rift Valley fever (Turell et al. 2008). The introduction and transmission of foreign animal diseases into a country can result in lost productivity, restricted animal exports, and in the case of zoonotic diseases, direct effects on human health (Bram et al. 2002). Livestock diseases are frequently introduced to an area through animal movement by importation and exportation. As a result, governments are increasingly 1
Corresponding author, e-mail:
[email protected].
concerned about developing plans and strategies, such as import policies, to prevent the introduction of animal diseases yet allow fair trade. There is increasing interest in conducting risk analyses to determine the likelihood and impact of foreign animal disease introduction, establishment, and spread, as well as developing emergency animal health management strategies in the event of an introduction of exotic animal diseases. To conduct risk analyses and develop emergency management strategies for arthropod-borne animal diseases, regulators and policy makers require current information on potential vectors in an area. This includes which species are present in an area, what temperatures they are active at, and the seasonality of the vector. Studies on mosquito fauna and their host range were conducted in southern Alberta during the late 1950s through the 1970s (Shemanchuk 1959, 1969; Shemanchuk et al. 1963). Larval mosquito populations were surveyed in the southern Alberta, Canada, during 1976 Ð1978 (ScholeÞeld et al. 1981). Studies identifying adults attacking cattle were conducted in central Alberta during 1973Ð1975 (Shemanchuk 1978, Hudson 1983), however, the mosquito fauna seems to differ greatly between central and southern Alberta. There have been numerous changes in agricultural
January 2010
LYSYK: MOSQUITO ACTIVITY ON CATTLE FACILITIES
Alberta
33
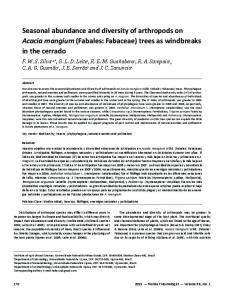
A
C B
D
F E
G H
Fig. 1. Location of eight cattle facilities in southern Alberta, Canada, where mosquitoes were sampled during 2002Ð 2004.
practices in southern Alberta since these early studies were conducted with the amount of irrigated land nearly doubling between 1975 and 2008 (http:// www1.agric.gov.ab.ca/$department/deptdocs.nsf/ all/irr8775). The number of farms with ⬎1,100 cattle has tripled, and the number of cattle on these farms has increased from ⬇450,000 to ⬎2 million animals. Such changes in agricultural practices may have inßuenced the mosquito fauna in the area. Although the mosquito fauna has been studied in southern Alberta, information on the inßuence of environmental factors on mosquito seasonality in the area is scant. There are several analytical methods that can be used to establish these relationships. One is to use linear regression to relate numerical abundance to a set of environmental factors; however, this can be unsatisfactory due to inconsistent responses among years (Shaman et al. 2002), the failure of environmental factors to explain more than small amounts of variation in mosquito abundance (Reisen et al. 2008) and an inability to accurately predict population levels (Ailes 1998). An alternative approach is to use logistic models to relate environmental factors to whether or not abundance exceeds a threshold value (Shaman et al. 2002, Kokkinn et al. 2009, Williams et al. 2009). Using this approach tends to focus less on the actual numbers of mosquitoes because actions may be triggered only when populations exceed some threshold level. An example is the use of a threshold of Þve parous female Culicoides, below which vector-free periods are declared, allowing for animal movement in Europe (Carpenter et al. 2009). Although typically used to predict outbreaks, this method also can be used to predict seasonality because seasonality can be related to periods when abundance exceeds a threshold. The purpose of this study was to identify the most common mosquito species at feedlots and other cattle
facilities in southern Alberta, determine their patterns of seasonal abundance, and relate periods of activity to environmental factors. The relationship between mosquito abundance and the proportion of traps positive for a species was identiÞed and used to estimate thresholds for deÞning activity. The relationship between the proportion of positive traps and temperature was established and used to estimate a weekly temperature threshold above which a mosquito species was active. Logistic regression models were then developed for Þve species of mosquitoes to relate seasonal presence to environmental variables.
Materials and Methods Mosquito Sampling. Mosquito sampling was conducted at eight locations in southern Alberta as part of a program to identify vectors associated with cattle production facilities. Locations of sampling sites were described previously (Lysyk 2006) and are shown in Fig. 1. Locations AÐE and G were commercial feedlots, location F was a research feedlot, and location H was a rangeland site near the shore of an irrigation lake. The area sampled was roughly triangular with distance of ⬇94 km between locations A and H and ⬇89 km between locations A and E and locations E and H. Sampling was conducted using one 6-V blacklight trap (model 1212, J. W. Hock Inc., Gainesville, FL) per location mounted on a post ⬇1 m above ground. Traps were operated continuously between May and October during each of 2002, 2003, and 2004 and insects collected in propylene glycol. The traps were serviced twice weekly and collections taken to the laboratory for identiÞcation. Female mosquitoes were identiÞed using Wood et al. (1979), and the number of females captured per location at each sample time was recorded. Collections for each trap were summed by
34
JOURNAL OF MEDICAL ENTOMOLOGY
week before analysis. Voucher specimens are held at Lethbridge Research Centre. Weather Data. Daily maximum-minimum temperatures and precipitation were obtained from weather stations operated near each location. Weather data for location A was obtained from the Vauxhall weather station located 19 km SE from the site. Weather data for locations B, C, and D were obtained from the Picture Butte weather station located ⬇13 km south of location C. Weather data for location E was obtained from the Monarch weather station located 23 km NNE. Weather data for locations F and G were obtained from the Lethbridge Research Centre located 30 km NNW from location G, and weather data for location H was obtained from the Milk River weather station located 23 km SSE. The Monarch weather station had missing values for May 2003. These were estimated from linear regression of the remaining daily maxima and daily minima with corresponding daily values from the Lethbridge Research Centre. The equations used were Ymax ⫽ ⫺0.68 ⫹ 0.99 ⫻ Xmax (t ⫽ 309; df ⫽ 1,063; P ⬍ 0.0001; r2 ⫽ 0.99) and Ymin ⫽ ⫺2.05 ⫹ 1.00 ⫻ Xmin (t ⫽ 184; df ⫽ 1,063; P ⬍ 0.0001; r2 ⫽ 0.97), where Y are values from the Monarch station and X are values from the Lethbridge Research Centre weather station. For the Picture Butte weather station, missing values for February, October, and November 2002; February 2003, and January, February, and November 2004 were estimated using the relationships Ymax ⫽ 0.44 ⫹ 1.00 ⫻ Xmax (t ⫽ 192, df ⫽ 892, P ⬍ 0.0001; r2 ⫽ 0.98) and Ymin ⫽ ⫺2.00 ⫹ 1.00 ⫻ Xmin (t ⫽ 113, df ⫽ 891, P ⬍ 0.0001, r2 ⫽ 0.93), where Y are values from the Picture Butte weather station and X are values from the Lethbridge Research Centre weather station. Mean weekly temperatures (Celsius) were calculated for each location from the daily maxima and minima, and total precipitation (millimeters) during each week was calculated. Cumulative degreedays above 5⬚C (DD5) were calculated from daily maxima and minima using sine-wave interpolation (Allen 1976). Data Analysis. The total number of each species was calculated for each year of the study and for all years combined. The abundance of the 10 most common species was compared by ranking species abundance within each locationÐyear combination, then using FreidmanÕs test used to compare species rankings (Ipe 1987). The Þve most abundant species were selected for further analyses. The weekly mean number of females captured per trap night was calculated across all locations and used as a measure of weekly abundance. A variable describing the presence Ð absence of each species was calculated for each location and week by assigning weekly samples that contained at least one female of species i the value Yi ⫽ 1 and those that did not the value Yi ⫽ 0. CohenÕs weighted kappa (Fleiss et al. 2003) was calculated for each species to determine the degree of agreement the presenceÐabsence of each species showed across locations. Logistic regression was used to determine the relationship between the proportion of positive samples and weekly mean abundance using
Vol. 47, no. 1
the model P(Yi ⫽ 1) ⫽ 1/(1 ⫹ exp(⫺(0 ⫹ 1X1))), where X1 is log10(mean females per trap night). The level of abundance at which 50% of the traps were positive, M50, and its 95% CL were estimated using PROC PROBIT (SAS Institute 2004) using the logistic distribution and inverse conÞdence limits options. The relationship between mean weekly temperatures and the presenceÐabsence of each mosquito species also were determined using the logistic regression model P(Yi ⫽ 1) ⫽ 1/(1 ⫹ exp(⫺(0 ⫹ 2X2))), where X2 is the mean weekly temperature during the sampling interval. The temperature at which 50% of the traps were positive, T50, was designated as the ßight threshold (Semakula et al. 1989) and its 95% CL also were estimated using PROC PROBIT (SAS Institute 2004). Forward selection stepwise logistic regression (PROC LOGISTIC, SAS Institute 2004) was used to identify weather variables that had a signiÞcant effect on the presenceÐabsence of each of the Þve species. Weather variables considered for inclusion in the model were DD5, DD52, mean weekly temperature (Celsius) during the sample week t (Tt), previous week (Tt⫺1), 2 and 3 wk previous (Tt⫺2 and Tt⫺3) and total precipitation during the sample week (Pt), previous week (Pt⫺1), and 2 and 3 wk previous (Pt⫺2 and Pt⫺3). Variables were retained at P ⬍ 0.05. Predicted values were generated and plotted against observed proportions of positive traps. Model Þt was evaluated based on the ability of the logistic regression to classify weeks according to whether or not populations were above a threshold level of abundance. Because logistic regression predicts the probability of an event occurring, the classiÞcation threshold for each species (C) was determined by solving the equations in Table 2 for the value 0.14 females per trap night. This level was chosen because it corresponds with the presence threshold of one female mosquito per week. Weeks with predicted values ⬎ C (using equations in Table 5) were classiÞed as positive, weeks with predicted values ⱕ C were classiÞed as negative. The observed mean abundance for each week were classiÞed as positive if mean abundance was ⬎0.14 females per trap night and negative if ⱕ0.14 female per trap night. Several measures of agreement were calculated including sensitivity (proportion of actual positives classiÞed correctly), speciÞcity (proportion of actual negatives classiÞed correctly), proportion agreement, and kappa (Fleiss et al. 2003). The ability of the model to predict the beginning and end of the seasonal activity periods for each species were evaluated by solving the logistic regressions in Table 5 on a daily basis using weather data from Lethbridge during 2002Ð2004, and comparing the Þrst and last days that predicted values exceeded C with the observed Þrst and last days that mean abundance exceeded 0.14. The duration of activity was calculated as the difference between the Þrst and last days.
January 2010 Table 1.
LYSYK: MOSQUITO ACTIVITY ON CATTLE FACILITIES
35
Numbers of mosquitoes captured at eight livestock facilities in southern Alberta, Canada, during 2002–2004
Species Cs. inornata Ae. dorsalis Cx. tarsalis Ae. vexans Ae. campestris Ae. sticticus Ae. melanimon Ae. spencerii Ae. flavescens Ae. nigromaculus Miscellaneous Total identiÞed UnidentiÞed
2002
2003
2004
All yr
Total
%
Total
%
Total
%
Total
%
1,807 5,951 863 4,039 1,379 1,385 692 229 40 82 24 16,491
11.0 36.1 5.2 24.5 8.4 8.4 4.2 1.4 0.2 0.5 0.2 15929
4,951 2,119 5,255 1,516 1,700 2 180 130 39 33 4
31.1 13.3 33.0 9.5 10.7 0.0 1.1 0.8 0.2 0.2 0.0 16,086
7,614 2,735 2,459 2,142 856 3 41 73 107 48 8
47.3 17.0 15.3 13.3 5.3 0.0 0.3 0.5 0.7 0.3 0.0 48,506
14,372 10,805 8,577 7,697 3,935 1,390 913 432 186 163 36
29.6 22.3 17.7 15.9 8.1 2.9 1.9 0.9 0.4 0.3 0.1
1,413
7.9
2,392
13.1
1,772
9.9
5,577
10.3
Rank (mean ⫾ SE)a 1.8 ⫾ 0.2a 2.5 ⫾ 0.2a 3.5 ⫾ 0.3b 3.9 ⫾ 0.4b 4.0 ⫾ 0.2b 8.8 ⫾ 0.4d 7.1 ⫾ 0.3c 6.5 ⫾ 0.2c 8.4 ⫾ 0.3d 8.5 ⫾ 0.2d
a Rank is the average species ranking (1, most abundant) within each locationÐyear combination. FreidmansÕs test followed by a rank sum multiple comparison test (Ipe 1987) was used to separate means.
100.0
Females/trap night
Species Abundance. We were able to identify to species 89.7% of the mosquitoes collected, whereas the remainder were too damaged for accurate identiÞcation. A total of seventeen species were identiÞed, however, Þve species accounted for 93.6% of the individuals identiÞed and ten species accounted for 99.9%. Analysis of species rankings within locationyears for the ten most common species indicated that several species were consistently ranked among the most abundant, whereas others among the least (F ⫽ 76.4; df ⫽ 9, 207; P ⬍ 0.0001). The mean rankings matched well with the percentage of total mosquitoes collected for the Þve most abundant species (Table 1). Culiseta inornata (Williston) was the most abundant in 14 of 24 location Ð years, and second or third most abundant in another 7. Aedes dorsalis (Meigen) was ranked most abundant in Þve of 24 location Ð years, and second or third in another 15. Culex tarsalis (Coquillett), Aedes vexans (Meigen), and Aedes campestris Dyar & Knab were the next most abundant. Cx. tarsalis was most abundant at three location-years, and second or third most abundant at ten. Ae. vexans was most abundant at a single location Ð year, second most abundant for eight location Ð years, and fourth or Þfth for 12 location Ð years. Ae. campestris was ranked fourth or Þfth most abundant for 15 location Ð years. Mean rankings and percentage of total captured did not correspond well for the Þve least abundant species (Table 1). Aedes sticticus (Meigen) accounted for 2.9% of the individuals collected, but had the lowest mean rank. This was because most individuals were captured at location E in 2002, whereas relatively few were captured in subsequent years or elsewhere. Aedes spencerii (Theobald) and Aedes melanimon Dyar accounted for 3.8% of the individuals identiÞed, and had the sixth and seventh greatest mean rankings. Aedes flavescens (Muller) and Aedes nigromaculus (Ludlow) accounted for 0.7% of the individuals identiÞed, and with Ae. sticticus, had the lowest mean ranks. The remaining seven species were represented by 36 specimens that included ten of Aedes cataphyla
(Dyar), eight each of Culiseta alasakensis (Ludlow) and Aedes provocans (Walker), Þve of Anopheles earlei Vargas, two each of Aedes impiger (Walker) and Aedes intrudens Dyar, and one of Culiseta incidens (Thomson). Seasonal Abundance of Common Species. Numbers of Cs. inornata increased during May with a peak in early to mid-June each year (Fig. 2A). Populations increased until a second peak was reached, occurring in early July in 2002 and mid-August in 2003 and 2004. Numbers declined through early September and then showed a Þnal peak in late September and early October. Ae. dorsalis showed variable patterns of seasonal abundance each year (Fig. 3A). In 2002, numbers increased sharply in mid- to late June and then de-
30.0
A
10.0 3.0 1.0 0.2 0.0 1.00
Proportion Positive
Results
B
0.75 0.50 0.25 0.00 M
J
J
A
S
O
Fig. 2. Seasonal changes in abundance (A) and proportion of traps positive (B) for Cs. inornata. Black circles are observations made in 2002, gray triangles in 2003, and white squares in 2004. Lines in B were predicted using logistic regression from Table 4. Solid line, 2002; dashed line, 2003; and dotted line, 2004.
36
JOURNAL OF MEDICAL ENTOMOLOGY
30.0
100.0
A
Females/trap night
Females/trap night
100.0
10.0 3.0 1.0 0.2 0.0
A
10.0 3.0 1.0 0.2 0.0 1.00
B
Proportion Positive
Proportion Positive
1.00
30.0
Vol. 47, no. 1
0.75 0.50 0.25 0.00
B
0.75 0.50 0.25 0.00
M
J
J
A
S
O
M
J
J
A
S
O
Fig. 3. Seasonal changes in abundance (A) and proportion of traps positive (B) for Ae. dorsalis. Black circles are observations made in 2002, gray triangles in 2003, and white squares in 2004. Lines in B were predicted using logistic regression from Table 4. Solid line, 2002; dashed line, 2003; and dotted line, 2004.
Fig. 4. Seasonal changes in abundance (A) and proportion of traps positive (B) for Cx. tarsalis. Black circles are observations made in 2002, gray triangles in 2003, and white squares in 2004. Lines in B were predicted using logistic regression from Table 4. Solid line, 2002; dashed line, 2003; and dotted line, 2004.
clined throughout the remainder of the summer. Abundance showed a bimodal pattern in 2003, with an initial peak during mid-May through mid-June, and a second period of activity beginning in early July and ending in early September. In 2004, abundance increased from early June to mid-August then declined through September and October. Cx. tarsalis was generally scarce during May and June of all years (Fig. 4A). Small peaks of abundance occurred in late May and early June of some years, but generally numbers increased from mid-June until they reached a single peak that occurred mid-July in 2002 and in mid-July through mid-August during 2003 and 2004. Numbers typically declined through the beginning of October (Fig. 4A). Populations of Ae. vexans showed only a minor amount of activity before mid-June each year (Fig. 5A). Populations increased abruptly in mid-June during 2002 but more gradually during 2003 and 2004. Populations remained high through mid-August, and then declined by the end of September. Ae. campestris showed variable patterns of seasonal abundance, ranging from having a single peak in early- to mid-July (2002) to a rapid increase during mid-May (2003) with variable abundance until early August (Fig. 6A). Presence–Absence of Common Species. The presence-absence of all species showed fair to moderate agreement among locations as indicated by the values of weighted kappa (Table 2). The proportion of positive traps increased with the overall trap mean for each species when mean species abundance was ⬍1 female per trap night, and asymptotically approached 1.0 at greater levels of abundance (Fig. 7AÐE). The relationships between the proportion of positive traps and mean abundance varied among the Þve species (2 ⫽ 36.2, df ⫽ 8, P ⬍ 0.0001). The proportion of
positive traps increased at a similar rate with mean abundance for Cs. inornata, Cx. tarsalis, and Ae. campestris, whereas Ae. dorsalis and Ae. vexans had lower rates of increase. This is reßected in the similar estimates of M50 among the Þrst three species and the greater values of M50 for Ae. dorsalis and Ae. vexans. Expressing density in terms of the proportion positive traps simpliÞed the seasonal population curves, resulting in
Females/trap night
100.0 30.0
A
10.0 3.0 1.0 0.2 0.0
Proportion Positive
1.00
B
0.75 0.50 0.25 0.00 M
J
J
A
S
O
Fig. 5. Seasonal changes in abundance (A) and proportion of traps positive (B) for Ae. vexans. Black circles are observations made in 2002, gray triangles in 2003, and white squares in 2004. Lines in B were predicted using logistic regression from Table 4. Solid line, 2002; dashed line, 2003; and dotted line, 2004.
January 2010
LYSYK: MOSQUITO ACTIVITY ON CATTLE FACILITIES
Fig. 6. Seasonal changes in abundance (A) and proportion of traps positive (B) for Ae. campestris. Black circles are observations made in 2002, gray triangles in 2003, and white squares in 2004. Lines in B were predicted using logistic regression from Table 4. Solid line, 2002; dashed line, 2003; and dotted line, 2004.
most showing as an increase in the proportion positive traps during May through July, a plateau during July and August, and a decline from September on (Figs. 2BÐ 6B). The proportion of positive traps increased with mean weekly temperature for the Þve most abundant species (Fig. 7FÐJ); however, the relationships varied among the species (2 ⫽ 206.9, df ⫽ 8, P ⬍ 0.0001). This was reßected in the estimated ßight thresholds and the 95% CL (Table 3). The threshold was lowest for Cs. inornata, followed by Ae. dorsalis, and was similar among Cx. tarsalis, Ae. vexans, and Ae. campestris. Logistic regression indicated that seasonal trends in the proportion of positive traps were further inßuenced by cumulative degree-days above 5⬚C. A linear term for DD5 was signiÞcant for Cs. inornata, whereas both linear and quadratic terms were signiÞcant for the remainder of the Þve common species. The proportion positive traps also increased with mean temperatures either two or three weeks previous to the
37
sample. The effects of precipitation varied among the species. Precipitation either one week or two weeks before the sample had a negative effect on the proportion of positive traps for both Cx. tarsalis and Cs. inornata (Table 4). Precipitation had no effect on the proportion of traps positive for Ae. dorsalis and Ae. campestris. Precipitation 2 and 3 wk before the sample had a positive effect on the proportion of traps positive for Ae. vexans. Model Evaluation. The values of C ranged from 0.39 to 0.44, was least for Ae. vexans, and greatest for Cx. tarsalis and Ae. campestris. The sensitivity (proportion of true positives that were classiÞed correctly) ranged from 0.89 to 0.95, whereas the proportion of negatives classiÞed correctly ranged from 0.64 to 1.00 (Table 5). The lowest speciÞcity occurred for Cs. inornata, the species with the lowest number of actual negatives. Agreement was lowest for Cs. inornata, but was generally high and ⬎0.88. The kappa statistics indicated moderate agreement between predicted and observed for Cs. inornata but excellent agreement for the remaining species. The logistic regression tended to overestimate the proportion of traps positive for Cs. inornata during September and October of 2002 (Fig. 2B). Mean observed and predicted dates for the beginning, end, and duration of the vector period are listed in Table 6. Cs. inornata had the earliest, latest, and longest period of seasonal activity. Ae. dorsalis and Ae. campestris began their activity periods at similar times, however, the period of activity for Ae. dorsalis ended later, resulting in its having the second longest period of activity. The periods of activity for Ae. vexans and Cx. tarsalis started the latest but ended about the same time as for Ae. dorsalis, resulting in the shortest periods of activity. Predicted start dates averaged 4 Ð9 d earlier than observed, whereas predicted end dates averaged 0 Ð 4 d longer than observed. Discussion Shemanchuk (1959) used larval collections and visual attraction traps to identify 16 species of mosquitoes in southern Alberta. Of these, seven were sufÞciently numerous to be considered pests and in order of abundance were Ae. dorsalis, Ae. vexans, Cs. inornata, Cx. tarsalis, Ae. spencerii, Ae. campestris, and Ae. flavescens. In later studies, mosquitoes captured in farmyards, pastures and sheltered sites using sweep
Table 2. Relationship between mosquito abundance (females per trap night) and the proportion of positive traps for five species of mosquitoes captured at cattle facilities in southern Alberta, Canada Species
0 ⫾ SE
1 ⫾ SE
2
M50 (L95, U95)
PM (L95, U95)
⫾ SE
Cs. inornata Ae. dorsalis Cx. tarsalis Ae. vexans Ae. campestris
1.79 ⫾ 0.16 1.12 ⫾ 0.13 1.57 ⫾ 0.19 0.75 ⫾ 0.12 1.49 ⫾ 0.16
2.47 ⫾ 0.24 1.76 ⫾ 0.16 2.15 ⫾ 0.20 1.44 ⫾ 0.16 2.05 ⫾ 0.20
176.3 188.8 226.1 109.1 158.8
0.19 (0.14, 0.24) 0.23 (0.16, 0.31) 0.19 (0.14, 0.24) 0.30 (0.19, 0.44) 0.19 (0.14, 0.25)
0.42 (0.35, 0.51) 0.41 (0.34, 0.48) 0.44 (0.38, 0.50) 0.39 (0.32, 0.46) 0.44 (0.37, 0.51)
0.45 ⫾ 0.02 0.50 ⫾ 0.02 0.54 ⫾ 0.02 0.48 ⫾ 0.02 0.50 ⫾ 0.02
Logistic regression is P(Y ⫽ 1) ⫽ 1/(1 ⫹ exp(⫺(0 ⫹ 1X1))), where Y ⫽ 1 if a trap was positive and 0 otherwise; X1 is log10(mean females per trap night) during the week; M50 is the predicted mean abundance at which 50% of the traps were positive; PM is the proportion of traps positive when density ⫽ 0.14 mosquitoes per trap night; and L95 and U95 are the upper and lower 95% CL, respectively. All 2 values are signiÞcant at P ⬍ 0.0001. is CohenÕs weighted kappa statistic.
38
JOURNAL OF MEDICAL ENTOMOLOGY
Vol. 47, no. 1
Proportion Positive
1.00 0.75 0.50 0.25
A
0.00 0.1
1
10 100
B 0.1
1
C
10 100
0.1
1
10 100
E
D 0.1
1
10 100
0.1
1
10 100
Females/trap night
Proportion Positive
1.00 0.75 0.50 0.25
F
0.00 0
5 10 15 20 25 0
G 5 10 15 20 25 0
H
I
5 10 15 20 25 0
5 10 15 20 25 0
J 5 10 15 20 25
o
Mean Weekly Temperature ( C)
Fig. 7. Relationships between the proportion of positive traps and mosquito abundance (AÐE) and mean weekly temperature (FÐJ) for Cs. inornata (A and F), Ae. dorsalis (B and G), Cx. tarsalis (C and H), Ae. vexans (D and I), and Ae. campestris (E and J). Black circles are observations made in 2002, gray triangles in 2003, and white squares in 2004.
nets and visual attraction traps were composed of roughly equal percentages (⬇25%) of Ae. dorsalis, Cs. inornata, Ae. vexans and lower percentages of Ae. spencerii (⬇13%) and Cx. tarsalis (⬇5%) (Shemanchuk et al. 1963). Mosquitoes captured arriving at bird-baited traps were composed mainly of Cx. tarsalis (57%) with Ae. dorsalis, Ae. flavescens, Ae. vexans, and Cs. inornata making up 7Ð12% of the mosquitoes captured. Comparisons between our results and those reported by Shemanchuk (1959, 1969) and Shemanchuk et al. (1963) can be summarized as follows. Four of the Þve major species we captured at feedlots were among the most common in previous studies. These included Cs. inornata, Ae. dorsalis, Cx. tarsalis, and Ae. vexans. Ae. campestris seemed to have increased in relative abundance compared with earlier studies and made up from 5.3 to 8.7% of the total mosquitoes identiÞed each year in the current study but was ⱕ1% of the mosquitoes attracted to sentinel chickens (Shemanchuk 1969) or collected near farmyards (Shemanchuk et al. 1963) in earlier studies. Ae. spencerii seemed to have
a lower relative abundance in the current study (0.5Ð 1.4%) compared with earlier studies (3.9 Ð12.8%, Shemanchuk et al. 1963, Shemanchuk 1969). This may reßect different sampling methods as Ae. spencerii is a day-ßying species and probably not readily captured using light traps. Ae. flavescens made up 0.2Ð 0.7% of the mosquitoes captured in the current study but ranged from 1.3% (Shemanchuk et al. 1963) by using sweeping and visual traps to 9.6% (Shemanchuk 1969) by using chicken-baited traps. Differences between this and the 1969 study may reßect different sampling methods. Previous studies generally considered Ae. sticticus to be a rare species, however, that was not the case during 2002. Ae. sticticus was collected at all eight locations after exceptionally heavy rainfall during June (248 mm, Lysyk 2006) that resulted in ßooding of local rivers. Approximately 95% of the Ae. sticticus were captured at location E that was ⬍1 km from the Belly River. Ae. sticticus develops in ßood plains along rivers (Trpis et al. 1973), and the extensive ßooding that year probably contributed to its increased abun-
Table 3. Logistic regression for calculating the flight threshold (T50) for five species of mosquitoes captured at cattle facilities in southern Alberta, Canada Species
0 ⫾ SE
1 ⫾ SE
2
T50
L95
U95
Cs. inornata Ae. dorsalis Cx. tarsalis Ae. vexans Ae. campestris
⫺2.46 ⫾ 0.35 ⫺5.56 ⫾ 0.49 ⫺4.69 ⫾ 0.43 ⫺5.16 ⫾ 0.46 ⫺6.83 ⫾ 0.57
0.26 ⫾ 0.03 0.41 ⫾ 0.03 0.31 ⫾ 0.03 0.33 ⫾ 0.03 0.47 ⫾ 0.04
127.9 267.5 188.2 199.2 302.1
9.6 13.4 15.0 15.6 14.6
8.5 12.9 14.4 15.0 14.2
10.5 14.0 15.7 16.2 15.1
Logistic regression is P(Y ⫽ 1) ⫽ 1/(1 ⫹ exp(⫺(0 ⫹ 1X1))), where Y ⫽ 1 if a trap was positive and 0 otherwise; X1 is mean temperature (⬚C) during week; T50 is the predicted temp at which 50% of the traps were positive; and L95 and U95 are the upper and lower 95% CL, respectively. All 2 values are signiÞcant at P ⬍ 0.0001.
January 2010
LYSYK: MOSQUITO ACTIVITY ON CATTLE FACILITIES
39
Table 4. Relationship between the proportion of positive traps and meteorological variables for five species of mosquito in southern Alberta, Canada Xi
Is. inornata
Ae. dorsalis
Cx. tarsalis
Ae. vexans
Ae. campestris
0 DD5 DD52 Tt Tt⫺2 Tt⫺3 Pt⫺1 Pt⫺2 Pt⫺3 2b df n
⫺4.624 ⫾ 0.508 0.115 ⫾ 0.024 nsa 0.252 ⫾ 0.040 0.103 ⫾ 0.039 ns ns ⫺0.012 ⫾ 0.005 ns 212.1** 4 567
⫺6.797 ⫾ 0.597 0.505 ⫾ 0.157 ⫺0.026 ⫾ 0.007 0.264 ⫾ 0.038 ns 0.124 ⫾ 0.039 ns ns ns 321.4** 4 571
⫺9.966 ⫾ 0.981 0.495 ⫾ 0.173 ⫺0.019 ⫾ 0.008 0.251 ⫾ 0.041 ns 0.254 ⫾ 0.044 ⫺0.018 ⫾ 0.009 ns ns 371.7** 5 567
⫺10.949 ⫾ 1.011 0.903 ⫾ 0.187 ⫺0.036 ⫾ 0.008 0.243 ⫾ 0.040 ns 0.131 ⫾ 0.042 ns 0.013 ⫾ 0.007 0.018 ⫾ 0.006 333.8** 6 566
⫺6.070 ⫾ 0.563 ns ⫺0.004 ⫾ 0.001 0.354 ⫾ 0.045 0.099 ⫾ 0.036 ns ns ns ns 304.6** 3 571
Model is P(Y ⫽ 1) ⫽ 1/(1 ⫹ exp(⫺(0 ⫹ iXi))), where Xi are the values of meteorological variables listed above and i are the corresponding parameter estimates. DD5, cumulative degree days above 5⬚C at the beginning of week t; Tt, mean temperature (⬚C) during week t; P, total precipitation (mm). The subscript t denotes the sample week, and t⫺x denotes x weeks earlier. a ns denotes parameters that were not signiÞcant at P ⫽ 0.05. b All 2 values are signiÞcant at P ⬍ 0.0001.
dance at that location. Overall, we identiÞed 14 species in common with those reported by Shemanchuk (1959), three rare species not reported (Ae. provocans, Ae. impiger, and Cs. incidens) and failed to Þnd two species (Aedes cinereus Meigen and Aedes riparius Dyar & Knab) that were relatively uncommon in previous studies. The fauna associated with cattle facilities in southern Alberta seems to differ from that in central Alberta where Ae. vexans tends to be more abundant (⬎50%) than Cs. inornata (7Ð17%), Ae. dorsalis is uncommon (Graham 1969), and the Ae. communis (DeGeer) group (including Aedes punctor Kirby) and Aedes fitchii (Felt & Young) group also are attracted to cattle (Shemanchuk 1978, Hudson 1983). All of the Þve most common species have been implicated or have potential to transmit a number of viruses. Native viruses such as Western Equine Encephalitis virus, an unidentiÞed Flavivirus, and Cache Valley Virus have been identiÞed from collections of Cx. tarsalis, Cs. inornata, and Ae. vexans in Alberta or Saskatchewan (Shemanchuk and Morgante 1968, Iversen et al. 1979, Pabbaraju et al. 2009). Western Equine Encephalitis and California group virus also have been isolated from Ae. campestris and Ae. dorsalis in New Mexico (Clark et al. 1986). Cs. inornata, Cx. tarsalis, Ae. dorsalis, and Ae. vexans are all competent vectors of the introduced West Nile virus (Goddard et al. 2002). North American Ae. vexans are competent vectors of Rift Valley Fever virus (Turell et al. 2008), Table 5. Species Cs. inornata Ae. dorsalis Cx. tarsalis Ae. vexans Ae. campestris
and Nett et al. (2009) suggested that Cx. tarsalis, Cs. inornata, and Ae. dorsalis have potential to vector Japanese encephalitis virus if it were introduced to California. The presenceÐabsence of the Þve main species of mosquitoes showed a fair-to-moderate degree of association among the sites (weighted kappa for each species ranged from 0.45 to 0.54). The proportion of positive traps for each species increased with both mean abundance and temperature. These two factors probably do not operate independently as increasing temperatures are associated with increasing activity and abundance. As abundance increases, the species tend to spread out and occupy more of the available habitat, and it becomes more likely that these will be collected by traps. The principle utility of the relationship between the proportion of positive traps and temperature is that it allows estimation of an approximate ßight threshold, or temperature above which 50% of the traps become positive. This threshold was lowest for Cs. inornata, reßecting its earlier occurrence during the year, longer period of activity, and tolerance of cooler temperatures (Buth et al. 1990) compared with other species. Ae. dorsalis had the second lowest temperature threshold for activity, occurred earlier in the year than Cx. tarsalis and Ae. vexans and persisted later than Ae. campestris. The remaining species had similar ßight thresholds, and although Ae. campestris occurred earlier in the year
Evaluation of model fit for classifying weeks for the presence of five mosquito species in southern Alberta, Canada Positives classiÞed as Correct
Incorrect
55 42 36 36 38
4 5 2 2 3
Se 0.93 0.89 0.95 0.95 0.93
Negatives classiÞed as Correct
Incorrect
Sp
9 26 34 34 29
5 0 1 1 3
0.64 1.00 0.97 0.97 0.91
A
k ⫾ SE
0.88 0.93 0.96 0.96 0.92
0.59 ⫾ 0.12** 0.86 ⫾ 0.12** 0.92 ⫾ 0.12** 0.92 ⫾ 0.12** 0.83 ⫾ 0.12**
Se, sensitivity, proportion of true positives classiÞes correctly; Sp ⫽ speciÞcity, proportion of true negatives classiÞed correctly; A, agreement, proportion of negatives and positives classiÞed correctly; and k, CohenÕs weighted kappa (Fleiss et al. 2003).
40
JOURNAL OF MEDICAL ENTOMOLOGY
Vol. 47, no. 1
Table 6. Observed and predicted days for the beginning, end, and duration of periods that mosquito species were active in southern Alberta, Canada, during 2002–2004 Species Beginning (Julian date) Cs. inornata Ae. dorsalis Cx. tarsalis Ae. vexans Ae. campestris End (Julian date) Cs. inornata Ae. dorsalis Cx. tarsalis Ae. vexans Ae. campestris Duration (d) Cs. inornata Ae. dorsalis Cx. tarsalis Ae. vexans Ae. campestris
Observed
Predicted
Mean (SD)
Cal. date
Mean (SD)
Cal. date
PredictedÐ observed 关mean (SD)兴
147.7a (11.4) 154.7a (11.1) 175.7b (11.1) 171.0b (6.6) 152.3a (11.4)
26 May 2 June 23 June 19 June 31 May
143.7 (3.5) 152.3 (9.5) 167.0 (5.6) 167.0 (5.0) 144.7 (4.5)
22 May 31 May 15 June 15 June 23 May
⫺4.0 (14.7) ⫺2.3 (2.1) ⫺8.7 (8.1) ⫺4.0 (1.7) ⫺7.7 (10.8)
287.0b (10.5) 265.7a (13.9) 268.0a (6.0) 263.3a (10.1) 254.0a (1.0)
13 Oct. 21 Sept. 24 Sept. 19 Sept. 10 Sept.
290.7 (13.1) 265.3 (7.0) 272.0 (3.6) 265.3 (7.6) 255.7 (6.0)
16 Oct. 21 Sept. 28 Sept. 21 Sept. 11 Sept.
3.7 (2.5) ⫺0.3 (7.5) 4.0 (4.4) 2.0 (3.6) 1.7 (5.0)
139.3a (14.0) 111.0b (14.0) 92.3c (14.6) 92.3c (4.0) 101.7bc (10.7)
147.0 (15.1) 113.0 (8.2) 105.0 (7.8) 98.3 (2.9) 111.0 (8.7)
7.7 (15.5) 2.0 (6.2) 12.7 (10.3) 6.0 (3.6) 9.3 (15.7)
Observed means within each column followed by different letters differ at P ⬍ 0.05 using FisherÕs LSD. F(beginning) ⫽ 5.9; df ⫽ 4, 8; P ⬍ 0.017; F(end) ⫽ 6.2; df ⫽ 4, 8; P ⬍ 0.015; F(duration) ⫽ 22.9; df ⫽ 4, 8; P ⬍ 0.0002.
than Cx. tarsalis or Ae. vexans, its activity diminished earlier during the season, resulting in a similar duration of activity. Seasonal activity of Cs. inornata and Cx. tarsalis was relatively consistent among years, probably because both species overwinter as adults and larvae develop in standing waters such as irrigation seepages that tend to occur in a more consistent fashion among years compared with rainfall. Seasonal activity of Cs. inornata in southern Alberta begins when adults emerge from mammalian burrows during May and June (Shemanchuk 1965), which corresponds well with the early to mid-June peak we detected each year. Adults will enter burrows during September to hibernate (Shemanchuk 1965) and generally do not seek hosts or oviposit after mid-September (Shemanchuk 1969, Buth et al. 1990). In central Alberta, Cs. inornata typically does not feed on cattle after the last week of August due to the onset of diapause but can be captured in light traps through October (Hudson 1983). The late season adults we collected during early October in all years of this current study were probably in diapause. Cx. tarsalis, like Cs. inornata, overwinters as an adult and emerges from mammalian burrows during AprilÐ June (Shemanchuk 1965). Adults were trapped as early as 23 May but not in great abundance. Oviposition can begin early in May and ends in late August (Buth et al. 1990). The peak adult activity during mid-July and early August and the steady decline in numbers during mid-August through late September is consistent with earlier studies (Shemanchuk 1969). Cx. tarsalis is less tolerant of cold temperatures and enters diapause earlier in the season than Cs. inornata (Buth et al. 1990); thus, it does not show the late seasonal peak of abundance that Cs. inornata does. The presenceÐabsence of both species was primarily inßuenced by temperatures, with precipitation acting as
a negative inßuence. This is probably because these species oviposit on standing water and precipitation may inhibit the oviposition behavior of adults. Population peaks of the Aedes species occurred at variable times each year, agreeing with ShemanchukÕs observations that these do not show distinct seasonal patterns (Shemanchuk 1969). Ae. dorsalis and Ae. campestris typically were active earlier in the season than Ae. vexans. These species overwinter as eggs that hatch early in the season when Þrst ßooded by snowmelt, rainwater, or irrigation water. Ae. vexans eggs do not hatch during the Þrst ßooding in the spring but requires a second ßooding with water ⬎10⬚C (Brust and Costello 1969, EnÞeld and Pritchard 1977). This probably accounts for the later activity of this species as indicated in this and other studies (Hudson 1983). Termination of activity in September probably reßects lack of egg hatch due to limited rainfall, cooler temperatures, or diapause induction (Tauthong and Brust 1977). The use of logistic regression to identify periods when mosquitoes are active is a promising analytical technique. This method has previously been used to identify factors associated with the timing of mosquito population peaks of coastal mosquitoes (Kokkinn et al. 2009, Williams et al. 2009). The advantage of using logistic regression compared with conventional regression is that the input data are simpliÞed to indicate whether or not the population is above some threshold value rather than dealing with gradations of magnitude. The periods of activity can be deÞned in terms of when populations exceed a given threshold so that workers do not need to be concerned with periods of trivial activity. Threshold levels can be deÞned based on operational needs and modiÞed thresholds for classiÞcation can be used to make predictions according to local needs. The method has allowed deÞning periods when populations are active, and has identiÞed
January 2010
LYSYK: MOSQUITO ACTIVITY ON CATTLE FACILITIES
some environmental factors associated with increased abundance. Model predictions could be enhanced and strengthened if on-site weather data were used as input. The models tended to predict seasonal activity earlier than was observed but generally by no ⬎9 d. This is a reasonable level of error because the resolution of the observed data was 1 wk. Also, predicting events slightly earlier than they actually occur is less problematic than predicting events later than they occur. For now, models were evaluated in terms of their ability to Þt existing data. True model validation will require development of larger, independent data sets for comparison. Nonetheless, results from this study will be useful for developing risk mitigation procedures in the event of an outbreak of an exotic mosquito-borne disease. Acknowledgments I am grateful to C. Himsl-Rayner and R. C. Lancaster and (Lethbridge Research Centre) for expert technical assistance and to summer students A. Thorn, B. Gyorkos, T. Harron, and S. Thompson. Funding was provided by the Canadian CattlemenÕs Association Beef Cattle Research Council grant “Risk of Bluetongue and Anaplasmosis Infection in Western Canada Following Importation of U.S. Feeder Cattle” and by the Alberta Livestock Industry Development Fund grant “Risk of Bluetongue Infection in Western Canada Following Importation of U.S. Feeder Cattle.”
References Cited Ailes, M. C. 1998. Failure to predict abundance of saltmarsh mosquitoes Aedes sollicitans and A. taeniorhynchus (Diptera: Culicidae) by using variables of tide and weather. J. Med. Entomol. 35: 200Ð204. Allen, J. C. 1976. A modiÞed sine wave method for calculating degree-days. Environ. Entomol. 5: 388Ð396. Bram, R. A., J. E. George, R. E. Reichard, and W. J. Tabachnick. 2002. Threat of foreign arthropod-borne pathogens to livestock in the United States. J. Med. Entomol. 39: 405Ð416. Brust, R. A., and R. A. Costello. 1969. Mosquitoes of Manitoba: II. The effect of storage temperature and relative humidity on hatching of eggs of Aedes vexans and Aedes abserratus (Diptera: Culicidae). Can. Entomol. 101: 1285Ð 1291. Buth, L. J., R. A. Brust, and R. A. Ellis. 1990. Development time, oviposition activity and onset of diapause in Culex tarsalis, Culex restuans, and Culiseta inornata in southern Manitoba. J. Am. Mosq. Control Assoc. 6: 55Ð63. Carpenter, S., A. Wilson, and P. S. Mellor. 2009. Culicoides and the emergence of bluetongue virus in northern Europe. Trends Microbiol. 17: 172Ð178. Clark, G. G., C. L. Crabbs, C. L. Bailey, C. H. Calisher, and G. B. Craig, Jr. 1986. IdentiÞcation of Aedes campestris from New Mexico: with notes on the isolation of western equine encephalitis and other arboviruses. J. Am. Mosq. Control Assoc. 2: 529Ð534. Enfield, M. A., and G. Pritchard. 1977. Estimates of population size and survival of immature stages of four species of Aedes (Diptera: Culicidae) in a temporary pond. Can. Entomol. 109: 1425Ð1434. Fleiss, J. J., B. Levin, and M. C. Paik. 2003. Statistical methods for rates and proportions. Wiley, Hoboken, NJ.
41
Goddard, L. B., A. E. Roth, W. K. Reisen, and T. W. Scott. 2002. Vector competence of California mosquitoes for West Nile virus. Emerg. Inf. Dis. 8: 1385Ð1391. Graham, P. 1969. Observations on the biology of the adult female mosquitoes (Diptera: Culicidae) at George Lake, Alberta, Canada. Quaest. Entomol. 5: 309 Ð339. Hudson, J. E. 1983. Seasonal succession and relative abundance of mosquitoes attacking cattle in central Alberta. Mosq. News 43: 143Ð146. Ipe, D. 1987. Performing the Friedman test and the associated multiple comparison test using PROC GLM. In Proceedings of the Twelfth Annual SAS Users Group International Conference 12: 1146 Ð1148. Iversen, J. O., R. J. Wagner, M. K. Leung, L. B. Hayles, and J. R. McLintock. 1979. Cache Valley virus: isolations from mosquitoes in Saskatchewan, 1972Ð1974. Can. J. Microbiol. 25: 760 Ð764. Kokkinn, M. J., D. J. Duval, and C. R. Williams. 2009. Modelling the ecology of the coastal mosquitoes Aedes vigilax and Aedes camptorhynchus at Port Pirie, South Australia. Med. Vet. Entomol. 23: 85Ð91. Lounibos, L. P. 2002. Invasions by insect vectors of human disease. Annu. Rev. Entomol. 47: 233Ð266. Lysyk, T. J. 2006. Abundance and species composition of Culicoides (Diptera: Ceratopogonidae) at cattle facilities in southern Alberta, Canada. J. Med. Entomol. 43: 840 Ð 849. Nett, R. J., G. L. Campbell, and W. K. Reisen. 2009. Potential for the emergence of Japanese encephalitis virus in California. Vector-Borne Zoon. Dis. 9: 511Ð517. Pabbaraju, K., K.C.Y. Ho, S. Wong, J. D. Fox, B. Kaplen, S. Tyler, M. Drebot, and P.A.G. Tilley. 2009. Surveillance of mosquito-borne viruses in Alberta using reverse transcription polymerase chain reaction with generic primers. J. Med. Entomol. 46: 640 Ð 648. Reisen, W. K., D. Cayan, M. Tyree, C. M. Barker, B. Eldridge, and M. Dettinger. 2008. Impact of climate variation on mosquito abundance in California. J. Vect. Ecol. 33: 89 Ð98. Reiter, P. 2008. Climate change and mosquito-borne disease: knowing the horse before hitching the cart. Rev. Sci. Tech. Off. Int. Epiz. 27: 383Ð398. SAS Institute. 2004. SAS OnlineDoc䉸 9.1.3. SAS Institute, Cary NC. Scholefield, P. J., G. Pritchard, and M. A. Enfield. 1981. The distribution of mosquito (Diptera: Culicidae) larvae in southern Alberta, 1976 Ð1978. Quaest. Entomol. 17: 147Ð 168. Semakula, L. M., R. A. Taylor, and C. W. Pitts. 1989. Flight behavior of Musca domestica and Stomoxys calcitrans (Diptera: Muscidae) in a Kansas dairy barn. J. Med. Entomol. 26: 501Ð509. Shaman, J., M. Stieglitz, C. Stark, S. L. Blancq, and M. Cane. 2002. Using a dynamic hydrology model to predict mosquito abundances in ßood and swamp water. Emerg. Inf. Dis. 8: 6 Ð13. Shemanchuk, J. A. 1959. Mosquitoes (Diptera: Culicidae) in irrigated areas of southern Alberta and their seasonal changes in abundance and distribution. Can. J. Zool. 37: 899 Ð912. Shemanchuk, J. A. 1965. On the hibernation of Culex tarsalis Coquillet, Culiseta inornata Williston and Anopheles earlei Vargas (Diptera: Culicidae) in Alberta. Mosq. News 25: 456 Ð 462. Shemanchuk, J. A. 1969. Epidemiology of western encephalitis in Alberta: response of natural populations of mosquitoes to avian host. J. Med. Entomol. 6: 269 Ð275.
42
JOURNAL OF MEDICAL ENTOMOLOGY
Shemanchuk, J. A. 1978. A bait trap for sampling the feeding populations of blood-sucking Diptera on cattle. Quaest. Entomol. 14: 433Ð 439. Shemanchuk, J. A., and O. Morgante. 1968. Isolation of western encephalitis virus from mosquitoes in Alberta. Can. J. Microbiol. 14: 1Ð5. Shemanchuk, J. A., A.E.R. Downe, and L. Burgess. 1963. Hosts of mosquitoes (Diptera: Culicidae) from the irrigated areas of Alberta. Mosq. News 23: 336 Ð341. Tauthong, P., and R. A. Brust. 1977. The effect of photoperiod on diapause induction, and temperature on diapause termination in embryos of Aedes campestris Dyar and Knab (Diptera: Culicidae). Can. J. Zool. 55: 129 Ð134. Trpis, M., W. O. Haufe, and J. A. Shemanchuk. 1973. Embryonic development of Aedes (O.) sticticus (Diptera: Culicidae) in relation to different constant temperatures. Can. Entomol. 105: 43Ð50.
Vol. 47, no. 1
Turell, M. J., D. J. Dohm, C. N. Mores, L. Terracina, D. L. Wallette, L. J. Hribar, J. E. Pecor, and J. A. Blow. 2008. Potential for North American mosquitoes to transmit Rift Valley Fever Virus. J. Am. Mosq. Control Assoc. 24: 502Ð 507. Williams, C. R., S. R. Williams, J. Nicholson, S. M. Little, J. Riordan, S. R. Fricker, and M. J. Kokkinn. 2009. Diversity and seasonal succession of coastal mosquitoes (Diptera: Culicidae) in the northern Adelaide region of South Australia. Aust. J. Entomol. 48: 107Ð112. Wood, D. M., P. T. Dang, and R. A. Ellis. 1979. The mosquitoes of Canada (Diptera: Culicidae). Agriculture Canada Publ. No. 1686. Agriculture Canada, Ottawa, ON, Canada. Received 24 August 2009; accepted 23 September 2009.