IEEE TRANSACTIONS ON IMAGE PROCESSING, VOL. 20, NO. 11, NOVEMBER 2011
3207
Spread Spectrum Image Watermarking Based on Perceptual Quality Metric Fan Zhang, Member, IEEE, Wenyu Liu, Member, IEEE, Weisi Lin, Senior Member, IEEE, and King Ngi Ngan, Fellow, IEEE
Abstract—Efficient image watermarking calls for full exploitation of the perceptual distortion constraint. Second-order statistics of visual stimuli are regarded as critical features for perception. This paper proposes a second-order statistics (SOS)-based image quality metric, which considers the texture masking effect and the contrast sensitivity in Karhunen–Loève transform domain. Compared with the state-of-the-art metrics, the quality prediction by SOS better correlates with several subjectively rated image databases, in which the images are impaired by the typical coding and watermarking artifacts. With the explicit metric definition, spread spectrum watermarking is posed as an optimization problem: we search for a watermark to minimize the distortion of the watermarked image and to maximize the correlation between the watermark pattern and the spread spectrum carrier. The simple metric guarantees the optimal watermark a closed-form solution and a fast implementation. The experiments show that the proposed watermarking scheme can take full advantage of the distortion constraint and improve the robustness in return. Index Terms—Image quality metric, perceptual watermark, subjectively rated database.
I. INTRODUCTION
I
MAGE watermarking is applied in copyright management (copyright authentication, traitor tracing, and access control) as well as channel error resilience. Perceptual watermarking (except fragile watermarking) exploits aspects of the human visual system (HVS) and seeks an invisible and robust watermark. This process can be generally formulated as (1) where is the perceptual distortion of the watermarked with respect to the cover image and evaluates image the robustness of the watermark. For instance, conventionally Manuscript received October 14, 2010; revised January 30, 2011; accepted April 04, 2011. Date of publication April 21, 2011; date of current version October 19, 2011. This work was supported in part by the National Science Foundation of China under Grant 60903172 and Grant 60873127 and by MoE AcRF Tire 2, Singapore, under Grant T208B1218. The associate editor coordinating the review of this manuscript and approving it for publication was Dr. Jana Dittmann. F. Zhang is with the Huazhong University of Science and Technology, Hubei 430074, China (e-mail:
[email protected]). W. Liu is with the Department of Electronics and Information Engineering, Huazhong University of Science and Technology, Hubei 430074, China (e-mail:
[email protected]). W. Lin is with Nanyang Technological University, 639798 Singapore (e-mail:
[email protected]). K. N. Ngan is with the Chinese University of Hong Kong, Shatin, N. T., Hong Kong (e-mail:
[email protected]). Color versions of one or more of the figures in this paper are available online at http://ieeexplore.ieee.org. Digital Object Identifier 10.1109/TIP.2011.2146263
in spread spectrum watermarking scheme, the secret message may be compressed to reduce the data load; then, utilizing a key, a pseudorandom sequence is generated to modulate the secret message and added to the cover image. To take into account the perceptual impact, is a positive multiplier to balance the invisibility and the robustness, since a robust watermark may involve a high watermark strength and thus cause large distortion. Some work of perceptual watermarking does not rely on an explicit image quality metric. For example, in [1]–[3], the upper bounds of watermark strength is set by the Just Noticeable Difference (JND) [4], which indicates the extent of a signal difference pattern being just perceived. These methods were usually testified by the subjective test on whether the watermark was visible or not with a given watermark strength. However, the critical question is whether the watermark takes full advantage of the perceptual distortion constraint and achieves the robustness as high as possible. Because there is no explicit metric, it is difficult to justify: 1) whether the watermark invisibility is accurately evaluated; 2) whether the watermark takes full account of the relevant HVS characteristics; and 3) whether such heuristic embedding strength is the optimal for the tradeoff between the invisibility and the robustness of watermark. This study is devoted to perceptual watermarking with an explicit distortion metric whose accuracy is to be quantitatively evaluated by the subjectively rated databases (benchmarking for image quality assessment), meanwhile, watermarking can be posed as an optimization problem with an analytic solution. To make (1) easy to optimize, we need to keep the metric simple. Note that, for a spread spectrum watermark, is a linear function with respect to , as, as will be explained in Section V, a good metric is able to ensure (1) with an analytic solution. For instance, if is differentiable with respect to , (1) can be approached by any gradient-based technique; if is absolutely convex with , (1) may have a closed-form solution and the watermarked image can be computed without iterations. Fortunately, many image quality metrics can be generalized to a form as follows, which makes (1) easy to solve: (2) where the cover image and the watermarked image are respectively vectorized in the raster scanning order to column vector , , and is the number of pixels. According to the classification in [5], many metrics including [6]–[8] conform to (2) and belong to the error sensitivity-based metrics. In those metrics, image difference is calculated at first, and then is decomposed into multiple channels, which are related to the neural responses in the HVS. This channel decomposition is performed that may be selective for spatial location, freby quency band and orientation. For instance, can be a Toeplitz
1057-7149/$26.00 © 2011 IEEE
3208
matrix if a 2-D convolution operator (e.g., a Gabor filter) is used can to decompose the HVS channel [9], and, alternatively, also represent any orthogonal transform based on nonoverlapping blocks. In these two cases, is equal to . If is mapped from an overcompleted transform, is greater than . Finally, the image difference in each channel is weighted by the diag. Several HVS related features may be onal matrix encapsulated into the weighting matrix , given here. • Contrast Sensitivity Function (CSF): It models the sensitivity of the HVS as a function of the spatial frequency in visual stimuli. It usually peaks at the middle frequency and drops with both increasing and decreasing frequencies. The CSF can be reflected in with Fourier transform [6], DCT [7], and wavelet transform [8]. • Texture masking effect: Also termed noise visibility function, this refers to the reduction of visibility of noise-like watermark due to the presence of the cover image which shows similar frequency and orientation content. Generally, the watermark is more difficult to be noticed in the texture region. • Luminance masking effect: Also termed light adaptation, it indicates that the watermark is less visible in the very dark or bright region of the cover image. Finally, the differences from all of the channels are pooled into a ). scalar score by the -order Minkowski norm (denoted by MSE (Mean Squared Error) is the simplest case of Definition are both the identity matrices . SNR (2), where and (Signal to Noise Ratio) and PSNR (Peak Signal to Noise Ratio) are monotonic regression from the MSE and thus are equivalent to MSE. Definition (2) is differentiable with , and more specifically, when the 2nd-order Minkowski norm is used, Definition (2) makes Problem (1) have an analytic solution as explained in Section V. Definition (2) keeps concise due to ignoring some nonlinear characteristics, for example, suprathreshold [10] and threshold effect [4]. Suparathreshold effect refers to the fact that the same amount of distortion becomes perceptually less significant when the overall distortion level increases, which seldom happens in watermarking because watermarks often avoid causing heavy distortion. Threshold effect refers to the invisibility of distortions below the JND and need to be captured by a piece-wise function, which is indifferentiable. Definition (2) does not cover several metrics, like visual information fidelity (VIF) [11] and structural similarity index (SSIM) [5]. Perceptual image processing by optimizing SSIM is nontrivial work yet [12]. No literature has reported how to guide image processing by optimizing VIF. To conclude, (2) provides a metric framework, which embodies the typical HVS characteristics and makes the watermarking problem easy to optimize. In this paper, our metric design conforms to (2), that is, we focus on the selection of , , and . Traditionally, the CSF associated with the image-independent transform (e.g., DCT or wavelet) is employed, where the frequency subbands correspond to fixed visual patterns and the CSF parameters have to be estimated by visual psychological experiments. Such experiments are sensitive to the viewing conditions. This paper uses the Karhunen–Loève transform to decompose the frequency subbands and the corresponding eigenvalue to calculate the CSF parameters. Without tuning the parameters, the proposed metric achieves a better overall performance than
IEEE TRANSACTIONS ON IMAGE PROCESSING, VOL. 20, NO. 11, NOVEMBER 2011
the state-of-the-art metrics on subjectively rated databases, and meanwhile the optimal spread spectrum watermark has a closed-form solution and can be computed without iterations. The novelty of this paper includes the following aspects: 1) the spread spectrum watermarking is posed as an optimization problem with simplified formulation of the invisibility and the robustness; 2) the proposed quality metric is simple but outperforms the state-of-the-art metrics in overall and ensures watermarking problem an analytic solution; and 3) under the guidance of the proposed metric, the watermark can be efficiently detected. It is important to clarify the watermark invisibility. Invisibility generally means that the watermark cannot be perceived. However, the “visible” watermark sometimes is also acceptable when it is not annoying (i.e., without degrading the image quality too much) or is hardly distinguished from the passive channel noises. Some applications pay more attention to the watermark payload and robustness rather than the distortion. In a word, watermarking is a tradeoff. Keeping this in mind, the quality of watermarked image with respect to the cover image is linked with the loosened invisibility (i.e., relaxed distortion constraint) of watermark. The remainder of this paper is organized as follows. After a brief description of the related metric for watermarking in Section II, a new metric is proposed in Section III. The metric performance is compared in Section IV with seven existing metrics on six publicly accessible databases. The corresponding watermarking scheme is proposed in Section V. Section VI is devoted to comparison of the watermark performance. A smart detector associated with the proposed embedding method is presented and evaluated in Section VII, followed by the conclusion in Section VIII. II. RELATED WORKS Image quality assessment is a common problem for many applications including image restoration, coding, as well as watermarking. Image quality metric can be classified into full reference (FR), reduced reference, and no reference, according to the availability of the distortion free image (i.e., the cover image in watermarking), which may be used as the reference to evaluate the distorted counterpart. The FR metric can provide the more reliable assessment concerning the annoyance introduced by watermark. PSNR and weighted PSNR (WPSNR) [13] are currently the most commonly used for watermarking, due to their simplicity. It is well acknowledged that PSNR does not predict the image quality well. WPSNR is more accurate due to consideration of the texture masking effect, yet it does not consider the CSF and is thus not helpful for watermarking in the frequency domain, since the watermark is usually perceptually shaped in the frequency domain according to the CSF. Many other FR metrics have high correlation with subjectivities, e.g., SSIM and VIF. However, they are not specially designed for watermarking and make Problem (1) difficult to optimize. Most of them can only post-evaluate the watermark output, but cannot constrain the watermark in loop. The accuracy of the typical FR metrics from the viewpoint of watermarking is compared in [14], where a new metric CPA is also proposed, yet how to apply the CPA metric to watermarking is still a problem.
ZHANG et al.: SPREAD SPECTRUM IMAGE WATERMARKING BASED ON PERCEPTUAL QUALITY METRIC
In this paper, we pay special attention to two typical metrics: the metric implied in [15] (we name it as LSE metric for it is based on the Least-Squares prediction Error within the cover image) and DCTune [7]. Both metrics have been incorporated in watermarking. LSE is a recent method with only consideration of the texture masking effect, similar to the WPSNR and several proposals in [16]. DCTune is a typical JND-based metric. It was originally developed for perceptual coding and widely used in watermarking schemes [1], [17] and adopted to evaluate the quality of watermarked images in the Checkmark Benchmarking Tool [18]. Many perceptual metrics in various spatial frequency domains can be thought as the variations of the DCTune. We briefly introduce these two metrics and their conformity with (2). 1) LSE Metric: The LSE metric estimates the texture masking effect from the least-squares (LS) prediction error within the cover image. The absolute error of filtering prediction is defined as (3) represents convoluting (noncausally filtering) the In (3), image by an LS filter , where image is supposed to have rows and columns, i.e., is of the same size with and has nonnegative elements. Filter is learned by LS prediction: and is the filter to minimize the squared prediction error. In [15], the LSE watermark strength is proportional to . This heuristic scheme is actually the optimal solution to (1) when the robustness is commonly defined (like (14) in Section II), and the distortion is defined by (4) where and
and
are the pixel intensity of image at the location , respectively . Since is nonnegative, the LSE watermark scheme [15] embeds strong watermarks in the rough region with large , slight watermarks in the smooth region with small , and specifically no watermark in the region with . To ensure that the LSE metric, i.e., (4), returns a limited value, we need set as a positive constant to avoid dividing by a zero. The LSE metric is a special case of (2), considering that is replaced by the identity matrix , the diagonal elements of consist of the reciprocal square root of , and the second-order norm is adopted. 2) DCTune: DCTune is defined as
3209
where and index the frequency band of 8 8 DCT transform , and indexes the block (suppose a total of blocks, i.e., and ); and are the DCT coefficients of image and respectively; is the DC coefficient of th block and is the mean of all . DCTune is a special case of (2), where the fourth-order norm is used, is mapped from DCT, and the diagonal element of consists of the reciprocal square root of . In the definition of , constant is the CSF, plays the role of the texture masking effect, functions as the luminance masking effect, and the parameters are determined from psychophysical experiments. A recent work related to ours was [19], in which the distortion constraint on the watermark consists of two separated constraints: the CSF-based one and the texture-masking-based one. Such separation has three drawbacks. First, it burdens the distortion controlling with an additional balance among the separated constraints. Second, it is difficult to evaluate the accuracy of the separated distortion definition. Finally, it has to have multiple steps to compute the optimal watermark. In this paper, both the CSF and the texture-masking effect are encapsulated into a single explicit metric, so its performance can be tested and a good watermark shaping can be easily computed. Our approach is also different from CPA [14] and the distortion definition in [19] in that we use an efficient CSF which comes from the statistics of the cover image but do not rely on actual HVS model parameters. Our metric is therefore not sensitive to the displaying characteristics or the viewing configurations. III. PROPOSED METRIC Second-order statistics are regarded as critical features for visual pattern discrimination [20]. Karhunen–Loève transform is a projection whose directions are associated with the secondorder statistics of the data samples. Along the principal directions, samples present a large variance (the second-order moment). Such directions capture the typical appearance of the samples and are often used for matching. The local variance (i.e., the luminance variance of the local image block) is another second-order statistics, which has been exhaustively studied and usually employed to capture the texture masking effect in images. The proposed metric is named the second-order statistics (SOS)-based metric. If the image is divided into nonoverlapping blocks and the th block of the cover image and the watermarked image are vectorized and denoted by and , respectively, the SOS metric is defined as (6)
(5)
is the standard deviation of image block , is a where constant for avoiding dividing by zero, is the covariance matrix about all of the vectors within the cover image, and is the trace of , i.e., the sum of all of the eigenvalues of . By the eigendecomposition of the covariance matrix, we have . Generally, the covariance matrix derived from natural images is nonsingular, so represents the complete
3210
IEEE TRANSACTIONS ON IMAGE PROCESSING, VOL. 20, NO. 11, NOVEMBER 2011
KLT, and has eigenvalues, , as its diagonal elements. Definition (6) can be rewritten in the KLT domain, after absorbing into , as (7) represents the eigenvalue normalized by , and where are the th KLT coefficients of block and , respectively, and . Definition (7) is a nested summation; the inner summation pools the errors in the KLT subbands while the outer summation pools errors spatially. are the weights of the inner summation and plays a similar role as the CSF. Here, the CSF is considered in the KLT domain. As well known, KLT is more likely a kind of spatial-frequency channel decomposition. In [21], it is explained why the principal components of natural image patches are always 2-D sinusoids when recovered to the patch case, that is, why the KLT subbands are closely related to the oscillation frequency. Natural images often have the energy concentrated in their low frequency subbands, and the larger eigenvalues just correspond to the image energy in the lower and middle frequency subbands. With the CSF of , the metric emphasizes the distortion in the low frequency bands while tolerates more distortion in the high-frequency bands. On the other hand, the reciprocal of is the weight of the outer summation and represents the texture masking. The metric thus emphasizes the distortion in the smooth region while tolerating the distortion in textures and edges. The SOS metric follows (2), considering that is mapped from KLT and the diagonal eleconsist of . ments of It is interesting to compare the proposed metric with Mahalanobis distance [22] as defined in
(8) which is a dissimilarity metric between two random vectors and of the same distribution with the covariance matrix . A notable difference between Mahalanobis distance and the proposed metric is whether or the reciprocal is used to weigh the distance along the eigenvector. In other words, should the distortion along the principal components be emphasized or be tolerated? Mahalanobis distance has an intuitive explanation: when a test point seems to belong to a mass of sample points, it must be close to the mass center along the nonprincipal axis where the sample points spread out over a small range, but could be a little far along the principal axis where the sample points spread out over a large range. Obviously, Mahalanobis distance tolerates the distortions along the principal components while the proposed metric emphasizes them. Although Mahalanobis distance is often used to detect outliers in statistical testing, we find that it is not suitable for measuring the quality of natural images. The reason is probably that the HVS has been evolved to pay more attention to the principal components of images,
where images show more diversity and uncertainty. In this way, humans can efficiently learn from natural images. Therefore, the distortion along the principal components should be emphasized rather than be tolerated. In other words, the CSF of can be explained as the HVS’s adaptation to the prior of stimuli. Note that the proposed CSF does not rely on actual HVS model parameters and is just the statistics of the cover image. IV. METRIC PERFORMANCE It is important to make sure that the proposed metric works well before applying it to watermarking, so here we focus on comparison of the metric performance from the viewpoint of watermarking. The existing benchmark tools for watermarking often use PSNR or WPSNR to evaluate the quality of watermarked images but pay little attention to justify whether the metrics correlates well with the subjectivities in quality evaluation. [23]. On the contrary, several subjectively rated databases are built and can be taken as the “ground truth” for evaluating the metrics. The databases contain the reference (or cover) images, the impaired (or watermarked) images and the corresponding subjective quality scores rated by human observers. The subjective assessment tests generally follow the procedures under normalized viewing conditions as those defined by the International Telecommunications Union (ITU) recommendations, e.g., [24]. The accuracy of a metric is evaluated by the correlation between its objective scores and the subjective scores of the database assigned to each impaired images. Specifically, the Linear Correlation Coefficient or Pearson correlation (LCC) and Spearman Rank Order Correlation Coefficient (SROCC) are used to assess how well the relationship between the subjective and the objective scores can be described using a monotonic function. Calculating LCC requires that the objective scores are monotonic regressed by the logistic function proposed in [25], while SROCC does not depends on the monotonic regression. The larger LCC and SROCC values mean the higher correlation. The best LCC and SROCC of 1 will occur when the objective scores is the perfect monotonic function of the subjective ones. The reader may find that (4) and (7) are not the strict second-order norm due to lack of square root. However, the omission does not affect the LCC and SROCC performance of the metric, since the square root is also a monotonic function and will be compensated by the regression. The early subjectively rated databases were designed for coding applications [26]–[28], while the databases for watermarking were also developed recently [29]–[31]. A main difference between them is the range of distortion levels. Severe distortions are often covered by the databases for coding but not contained in the database for watermarking due to the distortion constraint on watermark. Another difference is the types of image distortions. The databases for coding frequently take into account the compression, additive noise, blur, and network transmission error, while the databases for watermarking collect the typical watermarking algorithms to generate distortions. In practice, the watermarks may resemble the distortions in coding applications but also possibly have more diverse frequency spectrum. It is worth testing the metrics for watermarking by the databases for coding, since there are no fixed formularies for watermarks and any perceptually shaped
ZHANG et al.: SPREAD SPECTRUM IMAGE WATERMARKING BASED ON PERCEPTUAL QUALITY METRIC
3211
TABLE I METRIC PERFORMANCE ON SUBJECTIVELY RATED DATABASES
noises are possible choices for spread spectrum watermark. We highlight the importance of using sufficient databases to evaluate metrics. Due to the analysis above, the comparative experiment is configured below. 1) Databases: Six databases, including three databases for watermarking and three databases for coding, are selected. Databases of FourierSB [29], BA [30], and Meerwald [31] have the different watermarks as distortions. A short description about them is contained in [14]. Databases of LIVE [26], TID [32], and CSIQ [28] have diversified distortion types for coding applications and sufficient distorted images. We exclude the distortions of “local block-wise distortions of different intensity” and “mean shift” in TID, as well as “contrast change” in TID and CSIQ. These distortions are difficult to handle by most metrics and seldom happen during embedding spread spectrum watermarks. From each one of LIVE, TID, and CSIQ, we also choose the image subset with the highest half of quality as a new test set, so as to simulate the distortion constraint on watermark. Consequently, we have a total of nine test sets. 2) Metrics: Eight metrics are compared, including: 1) VIF and MSSIM (the multiscale version of SSIM), which exhibit an outstanding performance in the previous study [25], [32]; 2) PSNR, WPSNR, and CPA, which are either commonly used metrics in watermarking community or devised for watermarking specially; and 3) LSE, DCTune, and the proposed SOS metrics, on which the comparison of watermarking in Section IV are based. The codes of VIF and MSSIM are in the MeTrixMux tool [33], while WPSNR and DCTune are in the CheckMark Benchmarking tool [18]. We choose and for SOS as well as for LSE. This parameter setting makes SOS and LSE achieve the best overall performance, yet a slight adjustment of the parameters will not influence the performance rank since the metric performance is not sensitive to the parameters.
The result of metric performance is presented in Table I, where the best correlations for each test set are marked bold. SOS performs quite well, and it is the only metric which always keep its difference from the highest correlation within 0.03 for all the data sets. The performance of VIF and MSSIM are fairly stable too, yet they do a little worse in the databases for watermarking than those for coding. On the contrary, CPA does well in the databases for watermarking but not for coding. LSE and WPSNR have a similar performance, both of which are good at BA and Meerwald but poor for FourierSB. DCTune sometimes is even inferior to PSNR. SOS obviously outperforms LSE and DCTune. Compared with PSNR, WPSNR and CPA, VIF and MSSIM seem more suitable for the benchmarking of watermarking. V. PERCEPTUAL WATERMARKING A. Perceptual Spread Spectrum Watermarking In this paper, we focus on the watermark embedding step of spread spectrum watermarking [34]. Without loss of generality, we embed one bit of message , , into a cover image . The watermarked image is obtained by ; to generate the watermark pattern , a pseudorandom carrier is first modulated by and then is weighted by watermark strength, while the key controls the generation of and ensures the security of the watermark. Consequently, highly correlates with . Denote the correlation by (9) where , ; is the variance of and is often normalized to 1. The correlation reflects the global watermark strength. The embedding process can be expressed in the vector form (10)
3212
IEEE TRANSACTIONS ON IMAGE PROCESSING, VOL. 20, NO. 11, NOVEMBER 2011
The watermarked image is possibly corrupted by attacking, which is usually modeled as additive noise (11) To detect the watermark in a blind way, the watermark decoder uses the key to recover and then usually makes linear correlation detection (LCD) as (12) without accessing the cover image: The last two terms in (12) can be neglected due to the independency between and and the independency between and . Finally, the watermark message is estimated according to sign threshold (13) null else , the To embed multiple bits of message nonoverlapping regions cover image can be divided into , and each region is embedded with one bit of message, that is, the watermark payload can be increased by reducing the repetition rate of one-bit watermark embedding. In principle, the watermark robustness is evaluated by the average bit error rate (BER) over a set of cover images at the decoder, yet the BER cannot be simply compared due to four factors. • Watermark attack. Watermark robustness is a concept closely related to the watermark attack. Different type and strength of attacks may affect the BER to different extents. • Watermark payload. The BER also depends heavily on the watermark payload. For the watermark designer, the payload setting is a compromise due to the application requirements and the channel environments. • Detection threshold. The threshold in (13) influences the BER and the false alarm rate (i.e., reporting watermark from innocent images) in opposite way. To achieve a low BER and avoid being swapped by false alarm, the threshold setting is a compromise for the watermark decoder. • Smart detector. The smart detecting methods, which are often based on the prior knowledge about the embedding methods, may detect watermarks more efficiently and thus improve the BER. This will be discussed in Section VII. To conclude, the robustness is a characteristic dependent on several prerequisites. It is still very challenging for the embedder to predict the BER. We resort to measure the robustness in a simple way. For the embedder who has little knowledge about the potential attacks or the smart detectors, maximizing the correlation of (9) is an intuitive strategy to obtain a robust watermark. Actually, the BER is derived to decrease with the correlation of (9) in assumption that the cover image and the attack noise are independent Gaussian signals [35]. Maximizing correlation is also adopted in [19], [36]. Similarly, we fulfill Problem (1) by defining the expected robustness as
(14)
is a linear function with . With the distortion definition of (6), the objective function of (1) is a quadratic with respect to . The solution to (1) can be derived directly. At the decoder, the correlation of (12) can roughly capture the survival robustness after attacking. The absolute value of correlation usually decreases with the attack strength, and the descending trend reflects the robustness against such type of attack. In this way, we avoid bothering to try all watermark payloads and the detection thresholds. B. Baseline for Comparison To evaluate watermarking, the characteristics often include invisibility, robustness, capacity, and complexity. Capacity is defined as the maximal payload of the watermark to be successfully decoded when the prerequisites including the invisibility constraint, the attack set and the BER constraint are given [37]. It is difficult to compare capacity, because it needs to enumerate and fix the prerequisites above. On the contrary, the respective comparisons of the invisibility and the robustness are helpful in capturing the capacity. All the watermarks to be compared are fast to be embedded and decoded. Due to above reasons, the invisibility and the robustness are the mainly compared. For fair comparison, all the watermarks satisfy a fixed correlation at the embedder (15) At this baseline, the watermarks have equal global strength before attacking, i.e., the same expected robustness. We can compare the distortion by the third-party metrics and compare the survival robustness after attacking according to the absolute correlation of (12). It is easy to satisfy Constraint (15) for an LSE-based watermark by simply following the scheme in [15]. For DCTune-based watermark, we heuristically make the watermark strength proportional to the in (5) and set the global watermark strength according to Constraint (15). This strategy is often adopted by the watermark based on the HVS mask [1], [17]. For the proposed SOS watermark as well as the LSE and heuristic DCTune watermark above, we always seek the solution to
(16) where is defined as (14) and Problem (16) has the solution
is defined as (2) with
.
(17) In (17), the watermark is a pixel-by-pixel weighted sequence , where is the pixel-wise weights after perceptual shaping, and is the global weight to satisfy Constraint (15). The only difference among the three kinds of watermarks is the design of and .
ZHANG et al.: SPREAD SPECTRUM IMAGE WATERMARKING BASED ON PERCEPTUAL QUALITY METRIC
3213
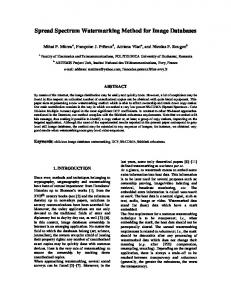
Fig. 1. Original and the corresponding three types of watermark (left column: SOS; middle column: LSE; right column: DCTune. Top row: difference in spatial domain between the watermarked image and the cover one. Bottom row: spectra of the error image. The six images are equalized for display purpose).
VI. EXPERIMENTS FOR WATERMARKING This section is devoted to comparing the three watermarking schemes based on the LSE metric, DCTune metric, and SOS metric, which will be named respectively as LSE watermark, DCTune watermark and SOS watermark in the remainder of this paper. The experiment configuration is described here. • Test images. Twenty-nine test images are the full set of the StirMark image database [38], which are collected especially for watermark benchmark covering images with texture and detail, images with lines and edges, smooth bright images, dark images, medical images, and computer generated images. The color components of images, if they exist, are removed before use. (1, 3, and 5) are • Watermark strength. Three levels of used and watermarks are embedded in weak, moderate, and strong strength, respectively. • Attack type. Gaussian noise, JPEG compression, Wiener filtering, and the copy attack [18] are considered. Image enhancement (adjustment of image contrast and mean) makes little impact on spread spectrum watermarks and thus are not discussed. Spread spectrum watermarks are usually fragile to protocol attacks and desynchronization attacks (e.g., cropping and geometrical attack). A more sophisticated strategy is necessary to resist those attacks, which is beyond the focus of this paper. A. Distortion . In the Fig. 1 shows the watermark pattern for image pixel domain, the SOS watermark and the LSE watermark concentrate on the edges and texture regions, while the distribution of the DCTune watermark is relatively uniform. In the spatial frequency domain, the SOS watermark concentrates in high frequency, the DCTune watermark shows special distribution in the vertical and horizontal low frequency, while the LSE watermark appears “white” with nearly uniform spectra. Fig. 2 shows the watermarked results with of 1, 3, and 5, respectively. For clear comparison, we show the central parts of the results. With scrutiny, we could discriminate the three
types of watermarked images from the cover image when is above 3. However, the LSE watermark impairs sharp edges and texts and the DCTune yields blocking artifacts, which are more annoying than the distortion introduced by the SOS watermark. In Fig. 2, the VIF, CPA, and PSNR of each entire watermarked image are also listed as reference to their perceptual distortion and watermark strength respectively. However, the more strict comparison on perceptual distortion is conducted below. We embedded the three types of watermarks to the 29 StirMark images with three levels of strength, repeated each configuration of random watermark ten times, and finally generwatermarked images. In Fig. 3, ated each vertical bar depicts the range of the objective scores which are assigned to the 290 images with the same type and strength of watermark, and the marker depicts the mean of the scores. VIF, MSSIM, and WPSNR predict the better quality by the higher scores while CPA on the contrary. Under the evaluation by VIF, MSSIM, and CPA, the SOS watermarked images have the best quality overall. The WPSNR metric is quite similar to the LSE metric, so the LSE watermark is destined to keep the most undetectable among the three ones when being measured by WPSNR. With the additional consideration of the comparison in Table I, it is concluded that the SOS watermark is less visible. B. Correlation (Robustness) Fig. 4 shows the results of watermark (survival) robustness, which is measured by the correlation of (12). The previous 2610 watermarked images suffer from the four types of attacks respectively. Each vertical bar depicts the range of the correlations which are possessed by the 290 attacked images with the same type and strength of watermark, and the marker depicts the mean of the correlations. The solid, dashed, and dotted lines stand for the watermark strengths of 1, 3, and 5, respectively. The three types of watermarks are all immune to the Gaussian noise and the copy attack, since the average correlation keeps almost consistent after attack. They are also resilient to JPEG compression to some extent. Specifically, at the high watermark strength , the SOS watermark is a little more robust
3214
IEEE TRANSACTIONS ON IMAGE PROCESSING, VOL. 20, NO. 11, NOVEMBER 2011
Fig. 2. Watermarked
(from left to right: SOS, LSE, and DCTune. Top row:
than the other two ones. For the Wiener filtering, the LSE watermark is the winner. The SOS metric appears more fragile to Wiener filtering than others, yet its advantage will be clarified in Section VII. C. Correlation-Quality Performance Due to the results above, the SOS watermark achieves the least distortion, the comparable robustness against the Gaussian noise, the JPEG compression and the copy attack, as well as a poor robustness against Wiener filtering, given the same
; middle row:
; bottom row:
).
correlation at the embedder. Such robustness analysis is not thorough because the watermarks are not compared at the same baseline of invisibility. Aforementioned, the optimal watermark is a tradeoff between the invisibility and the robustness. We suggest using the Correlation-Quality curve to evaluate the comprehensive performance of watermark, just like the Rate-Distortion curve for image coding. To be specific, the attack strength is preassigned, the survival robustness is still measured by Definition (12), while the invisibility of the watermarked image (before attacking) is evaluated by an
ZHANG et al.: SPREAD SPECTRUM IMAGE WATERMARKING BASED ON PERCEPTUAL QUALITY METRIC
3215
words, the SOS metric can improve the robustness that is shown in Fig. 4 by taking full advantage of the perceptual distortion constraint. In summary, the SOS watermark promises a better comprehensive performance than the LSE and the DCTune watermarks when exploring the balance between the watermark invisibility and the watermark robustness. VII. PROPOSED DETECTION SCHEME
Fig. 3. Objective quality of the StirMark images embedded with three types of watermark. (Better quality corresponds to higher values of VIF, MSSIM, and WPSNR and lower CPA scores).
Fig. 4. Survival robustness of the three types of watermarks on the SirMark images. (Higher correlation for better robustness.)
Fig. 5. Curves of the quality of the image embedded with the three types of watermarks versus the correlation after Wiener filtering attack (window size is 3).
accurate third-party metric. For instance, Fig. 5 shows the Correlation-Quality performance of the three types of watermarks on the three StirMark images (Material, Arch, and ), where VIF and CPA is used as the quality metric and Wiener filtering with a window size of 3 is assigned. In Fig. 5, the point on the right corresponds to the high correlation and robustness; the higher position in the left figure and the lower position in the right one imply the better quality. The SOS watermarks have the best Correlation-Quality performance therein. In other
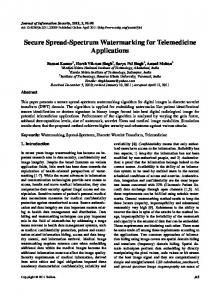
In above comparative study, a simple detection method, LCD, is employed. This is usually efficient in an open industrial society, where watermark decoders have little prior knowledge about watermark embedders and the interoperability between the different spread spectrum watermarking algorithms can be supported. However, for a closed society, a more sophisticated detector associated with the watermark embedding method may improve the performance. For example, the designers of LSE watermark proposed to use LS filter to estimate the masked watermark before performing the correlation-based detector [15]; Liu developed the locally optimum detector (LOD) to detect JND-based watermarks, where the Bayesian hypothesis testing (BHT) is employed according to the generalized Gaussian distribution (GGD) model on the frequency transform coefficients of natural images [39]. Here, we present a KLT-based detector associated with the SOS watermark. The detector first estimates the SOS watermark by filtering the received image and then performs the normalized LCD between the estimated watermark and the watermark carrier. One interesting feature of the SOS metric is that it shapes the SOS watermark pattern into distinct KLT spectra from the cover image. As aforementioned, the SOS watermark pattern exhibits the eigenvalues being reciprocal to the cover image’s eigenvalues, that is, the SOS watermark pattern concentrates most of its energy in the least principal components of the cover image. (the curve As illustrated in Fig. 6, the samples of original marked by circles) have descending eigenvalues from the most principal KLT basis to the least one. The samples of the with a SOS watermark (the curve marked by squares) exhibit approximately descending eigenvalues except having a bigger tail. This is because it has been added with a SOS watermark which has ascending eigenvalues1 (the curve marked by cross). Therefore, it is reasonable to estimate SOS watermark pattern by “high-pass” filtering the received image in the KLT domain of the cover image. Although the KLT bases of the cover image are not available for a blind watermark detector, it is found that the SOS watermarked images have approximately equal KLT bases with those of the cover images, except that the least principal KLT bases are regrouped in order. Consequently, it is feasible to do filtering in the KLT domain of the received image. The filter shows a high-pass frequency response function as the curve marked by dots in Fig. 6. Note that the filter is defined in the KLT domain of the received image; we approximately show it in that of the cover image for illustration purpose. By the eigendecomposition of the covariance matrix of the . The received image samples, the decoder has columns of represent the KLT bases of the received image has eigenvalues, , in a descending order and 1Since the watermark and the watermarked image do not have exactly the same KLT bases as the cover image, their eigen-value is calculated as the variance of their sample projections along the corresponding KLT basis.
3216
IEEE TRANSACTIONS ON IMAGE PROCESSING, VOL. 20, NO. 11, NOVEMBER 2011
Fig. 7. Output distributions of the detectors for the 7527 40 image blocks with SOS watermarks.
40 StirMark
Fig. 6. Demonstration of the signal spectra and the filter response in the KLT . domain of StirMark image
as its diagonal elements. Filtering the received image and estimating the SOS watermark is done by (18) captures the frequency response The diagonal matrix equal diagonal elfunction, having the first , and the last diagonal elements, ements, , in an ascending order. The diagonal elements are illustrated by the curve marked by dots in Fig. 6. is the vectorized received image block and is the estimation of the watermark pattern block in the vector form. empirically, while as same as the waWe set termark embedder. Then, the normalized correlation between the estimated watermark pattern and the watermark carrier is calculated to determine the watermark message (19) and are the standard deviation of the watermark carrier and the watermark pattern , which contains one bit of the watermark message. Finally, the watermark message is estimated according to (20) null
Fig. 8. ROC curves for the 7527 40 40 StirMark image blocks after (a) JPEG compression with the quality factor being 70, (b) Wiener filtering with window size being 3, (c) additive Gaussian noise with STD of 7, and (d) copy attack.
else
The detection performance of the KLT-based detector and the normalized LCD are compared on the StirMark images without attacks. Embedding one bit message “ ” into every 40 40 nonoverlapping block of an image, we collected a total of 7527 image blocks from 29 original StirMark images as well as 29 watermarked images, and then input them to the two detectors respectively. The distributions of outputs are shown in Fig. 7. A significant improvement is observed by using KLT-based detector. In Sections VI-B and VI-C, we use the correlation of (12) to evaluate the robustness of the watermarks in general. In this section, we further compare the robustness by the ROC curve at the decoder for the particular watermark attacks and certain
watermark payloads. Both the simple LCD and the smart detectors are considered among the SOS, the LSE, and the DCTune watermarks. For the smart detections, the KLT-based detector is integrated for the SOS watermark, the LS-filter-based detector for the LSE [15], and the LOD for the DCTune [39]. For fair comparison, we calculate the LOD if among the image region more than 20% DCT coefficients have the magnitudes above in (5); using Watson’s mask as the Watson’s mask (see the threshold is proposed in [39]), otherwise, still calculate the LCD because the LOD does not work well for small coefficients, as pointed out in [39]. We adjust the detecting threshold, which makes the LCD and the LOD achieve the equal false alarm rates, and then average their probabilities of detection as the final one.
ZHANG et al.: SPREAD SPECTRUM IMAGE WATERMARKING BASED ON PERCEPTUAL QUALITY METRIC
The baseline of a moderate watermark strength is kept at the embedders for the three types of watermarks. Again, the original StirMark images and their watermarked versions with a message “ ” in every 40 40 block are input to the detectors after being attacked. JPEG compression with a quality factor being 70, Wiener filtering with a window size being 3, additive Gaussian noise with the standard deviation of 7 and the copy attack are considered, respectively. For each case of the attacks, the ROC curves of the three watermarks are plotted in Fig. 8, where the dashed curves stand for employing the simple LCD and the solid curve for the corresponding smart detector. Two main observations are found from the results. • With the LCD detection, the SOS watermark can be less efficiently detected than the other two schemes for JPEG compression and Wiener filtering. • With the smart detection, the SOS watermark obtains the most performance gain and outperforms the others for all the four attacks. The significant incremental performance of the KLT-based detector confirms that the distinct KLT spectra of the SOS watermark can facilitate the watermark detection. Given the same watermark strength at the embedder, the SOS watermark has kept the least visibility in Section VI-C and has also exhibited the most detection efficiency in this section. Therefore, taking advantage of the KLT-based detector, the SOS watermark achieves the best comprehensive performance against the attack sets having been considered. It should be cautiously pointed out that the SOS watermark is vulnerable to a “low-pass” filtering in the KLT domain, just like every perceptual watermarking scheme suffering from a particular attack associated with the corresponding visual mask in the corresponding transform domain. VIII. CONCLUSION For designing a robust watermark, it is very important to exploit the perceptual distortion in line with human perception. In this paper, we propose the SOS metric, which provides the following two advantages. • Accuracy. It predicts image quality in a way that highly correlates with the subjectively rated databases and guides watermarking by introducing the distortion as invisible as possible. • Simplicity. It ensures a closed-form solution to the optimal watermark. This paper also suggests using the correlation-quality curve to objectively evaluate the performance of robust watermarks, where the quality of watermarked images should be rated by third-party metrics. With the explicit SOS metric, the proposed watermark achieves a good correlation-quality performance and can make a satisfactory tradeoff between the robustness and the distortion, compared with two typical watermarking schemes. Moreover, the SOS watermark can be efficiently detected by exploiting its distinct KLT spectra from those of the cover image. Although this paper only discusses the spread spectrum watermark, the SOS metric is promised to have wider applications such as those listed here. • QIM watermark. Quantization Index Modulation [40] can be also formulated as (1) with an adequate definition of and thus employ the SOS metric.
3217
• Image Matching. The Principal Component Analysis (PCA) method is frequently used for image matching. The SOS metric is actually a similarity measurement in the PCA domain, with guaranteed accuracy. It may be applied to texture synthesis and image inpainting, for example. ACKNOWLEDGMENT The authors would like to thank Dr. F. Autrusseau for kindly sharing the source code of the CPA metric, as well as Dr. W. Liu and Prof. W. Zeng for the implementation of the LOD. REFERENCES [1] C. I. Podilchunk and W. Zeng, “Digital image watermarking using visual models,” Human Vision and Electron. Imaging II, pp. 100–111, 1997. [2] M. Kutter and S. Winkler, “A vision-based masking model for spread spectrum image watermarking,” IEEE Trans. Image Process., vol. 11, no. 1, pp. 16–25, Jan. 2002. [3] H. Qi, D. Zheng, and J. Zhao, “Human visual system based adaptive digital image watermarking,” Signal Process., vol. 88, no. 1, pp. 174–188, 2008. [4] W. S. Lin, “Computational models for just-noticeable difference,” in Digital Video Image Quality and Perceptual Coding, H. R. Wu and K. R. Rao, Eds. Boca Raton, FL: CRC, 2005. [5] Z. Wang et al., “Image quality assessment: From error visibility to structural similarity,” IEEE Trans. Image Process., vol. 13, no. 4, pp. 600–612, Apr. 2004. [6] S. Daly, “The visible differences predictor—An algorithm for the assessment of image fidelity,” Human Vision, Visual Process., and Digital Display III, vol. 1666, no. 598, pp. 2–15, 1992. [7] A. B. Watson, “DCTune: A technique for visual optimization of DCT quantization matrices for individual images,” in Soc. Inf. Display Dig. Tech. Papers, 1993, vol. XXIV, pp. 946–949. [8] A. B. Watson et al., “Visibility of wavelet quantization noise,” IEEE Trans. Image Process., vol. 6, no. 8, pp. 1164–1175, Aug. 1997. [9] U. Grenander and G. Szego, Toeplitz Forms and Their Applications, 2nd ed. New York: Chelsea, 1981. [10] A. B. Watson and L. Kreslake, “Measurement of visual impairment scales for digital video,” in Proc. SPIE—Human Vision, Visual Process., and Digital Display,, 2001, vol. 4299, pp. 79–99. [11] H. R. Sheikh and A. C. Bovik, “Image information and visual quality,” IEEE Trans. Image Process., vol. 15, no. 2, pp. 430–444, Feb. 2006. [12] Z. Wang, Q. Li, and X. L. Shang, “Perceptual image coding based on a maximum of minimal structural similarity criterion,” in Proc. Int. Conf. Image Process., 2007, vol. 1–7, pp. 685–688. [13] S. Voloshynovskiy et al., “Generalized watermarking attack based on watermark estimation and perceptual remodulation,” in Proc. SPIE Security and Watermarking of Multimedia Contents, 2000, pp. 358–370. [14] M. Carosi, V. Pankajakshan, and F. Autrusseau, “Towards a simplified perceptual quality metric for watermarking applications,” in Proc. ICIP, 2010. [15] I. G. Karybali and K. Berberidis, “Efficient spatial image watermarking via new perceptual masking and blind detection schemes,” IEEE Trans. Inf. Forens. Security, vol. 1, no. 2, pp. 256–274, 2006. [16] S. Voloshynovskiy et al., “A stochastic approach to content adaptive digital image watermarking,” in Proc. Inf. Hiding, 2000, vol. 1768, pp. 211–236. [17] Q. Li and I. J. Cox, “Using perceptual models to improve fidelity and provide resistance to valumetric scaling for quantization index modulation watermarking,” IEEE Trans. Inf. Forens. Sec., vol. 2, no. 2, pp. 127–139, 2007. [18] S. Pereira et al., “Second generation benchmarking and application oriented evaluation,” in Proc. Inf. Hiding Workshop, Pittsburgh, PA, 2001, vol. LNCS, 2137, pp. 340–353. [19] H. O. Altun et al., “Optimal spread spectrum watermark embedding via a multistep feasibility evaluation,” IEEE Trans. Image Process., vol. 18, no. 2, pp. 371–387, Feb. 2009. [20] B. Julesz et al., “Inability of humans to discriminate between visual textures that agree in second-order statistics—Revisited,” Perception, vol. 2, pp. 391–405, 1973. [21] A. Hyvärinen et al., “Natural image statistics a probabilistic approach to early computational vision,” in Computational Imaging and Vision. London, U.K.: Springer, 2009, pp. 106–107. [22] P. C. Mahalanobis, “On the generalised distance in statistics,” in Proc. Nat. Inst. Sci. India, 1936, pp. 49–55.
3218
[23] P. Le Callet, F. Autrusseau, and P. Campisi, “Visibility control and quality assessment of watermarking and data hiding algorithms,” in Multimedia Forensics and Security, C. T. Li, Ed. Hershey, PA: IGI Global, 2008, pp. 163–192. [24] “Methodology for the subjective assessment of the quality of television pictures,” ITU, 2002, ITU-R-Recommendation-BT.500-11. [25] H. R. Sheikh, M. F. Sabir, and A. C. Bovik, “A statistical evaluation of recent full reference image quality assessment algorithms,” IEEE Trans. Image Process., vol. 15, no. 11, pp. 3440–3451, Nov. 2006. [26] H. R. Sheikh, “LIVE image quality assessment database, release 2.” 2005 [Online]. Available: http://live.ece.utexas.edu/research/quality [27] N. Ponomarenko, “TAMPERE IMAGE DATABASE 2008 version 1.0.” 2008 [Online]. Available: http://www.ponomarenko.info/ tid2008.htm [28] D. M. Chandler, “CSIQ Image Database.” 2010 [Online]. Available: http://vision.okstate.edu/index.php?loc=csiq [29] F. Autrusseau and P. L. Callet, “FourierSB database.” [Online]. Available: http://www.irccyn.ec-nantes.fr/~autrusse/Databases/FourierSB/ [30] F. Autrusseau and P. L. Callet, “BA database.” [Online]. Available: http://www.irccyn.ec-nantes.fr/~autrusse/Databases/BA/ [31] F. Autrusseau and P. L. Callet, “Meerwald database.” [Online]. Available: http://www.irccyn.ec-nantes.fr/autrusse/Databases/Meerwald/ [32] N. Ponomarenko et al., “TID 2008—A database for evaluation of full reference visual quality assessment metrics,” Adv. Modern Radioelectron., vol. 10, pp. 30–45, 2009. [33] M. Gaubatz, “MeTrix Mux visual quality assessment package.” [Online]. Available: http://foulard.ece.cornell.edu/gaubatz/metric_mux/ [34] I. J. Cox et al., “Secure spread spectrum watermarking for multimedia,” IEEE Trans. Image Process., vol. 6, no. 12, pp. 1673–1687, Dec. 1997. [35] H. S. Malvar and D. A. F. Florencio, “Improved spread spectrum: A new modulation technique for robust watermarking,” IEEE Trans. Signal Process., vol. 51, no. 6, pp. 898–905, Jun. 2003. [36] F. Pereira, S. Voloshynovskiy, and T. Pun, “Optimal transform domain watermark embedding via linear programming,” Signal Process., vol. 81, no. 6, pp. 1251–1260, 2001. [37] P. Moulin and A. Ivanovic, “The zero-rate spread-spectrum watermarking game,” IEEE Trans. Signal Process., vol. 51, no. 4, pp. 1098–1117, Apr. 2003. [38] “StirMark Image Database 2.0.” [Online]. Available: http://www.petitcolas.net/fabien/watermarking/image_database/index.html [39] W. Liu, L. Dong, and W. Zeng, “Optimum detection for spread-spectrum watermarking that employs self-masking,” IEEE Trans. Inf. Forens. Sec., vol. 2, no. 4, pp. 645–654, 2007. [40] B. Chen and G. W. Wornell, “Quantization IDEX modulation methods: A class of provably good methods for digital watermarking and information embedding,” IEEE Trans. Inf. Theory, vol. 47, no. 4, pp. 1423–1443, Apr. 2001. Fan Zhang (M’11) received the B.E. and Ph.D. degrees from Huazhong University of Science and Technology, Beijing, China, in 2002 and 2008, respectively, both in electronic and information engineering. He was a Visiting Student with Nanyang Technological University, Singapore, in 2008 and held a postdoctoral position with the Chinese University of Hong Kong from 2009 to 2010. He has been a Research Engineer with Technicolor Research, Beijing, China, since 2010. He co-organized the special session at the Asia Pacific Signal and Information Processing Association (APSIPA 2011). His research interests are quality of experience and perceptual watermarking.
Wenyu Liu (M’08) received the B.S. degree in computer science from Tsinghua University, Beijing, China, in 1986, and the M.S. and Ph.D. degrees in electronics and information engineering from Huazhong University of Science and Technology (HUST), Wuhan, China, in 1991 and 2001, respectively. He is currently a Professor and Associate Dean of the Department of Electronics and Information Engineering, Huazhong University of Science and Technology, Wuhan, China. His current research areas include multimedia information processing, and computer vision.
IEEE TRANSACTIONS ON IMAGE PROCESSING, VOL. 20, NO. 11, NOVEMBER 2011
Weisi Lin (M’92–SM’98) received the B.Sc. degree in electronics and M.Sc. degree in digital signal processing from Zhongshan University, Guangzhou, China, in 1982 and 1985, respectively, and the Ph.D. degree in computer vision from King’s College, London University, London, U.K., in 1992. He taught and conducted research at Zhongshan University, Shantou University, Bath University, the National University of Singapore, the Institute of Microelectronics, and the Institute for Infocomm Research. He has been the Project Leader of 13 major successfully delivered projects in digital multimedia technology development. He also served as the Lab Head, Visual Processing, and the Acting Department Manager, Media Processing, for the Institute for Infocomm Research. Currently, he is an Associate Professor with the School of Computer Engineering, Nanyang Technological University, Singapore. His areas of expertise include image processing, perceptual modeling, video compression, multimedia communication, and computer vision. He holds ten patents, edited one book, authored one book and five book chapters, and has authored or coauthored over 160 refereed papers in international journals and conferences. Dr. Lin is a Fellow of Institution of Engineering Technology. He is also a Chartered Engineer (U.K.). He organized special sessions at the IEEE International Conference on Multimedia and Expo (ICME 2006), the IEEE International Workshop on Multimedia Analysis and Processing (2007), the IEEE International Symposium on Circuits and Systems (ISCAS 2010), the Pacific-Rim Conference on Multimedia (PCM 2009), SPIE Visual Communications and Image Processing (VCIP 2010), Asia Pacific Signal and Information Processing Association (APSIPA 2011), and MobiMedia 2011. He gave invited/keynote/panelist talks in International Workshop on Video Processing and Quality Metrics (2006), the IEEE International Conference on Computer Communications and Networks (2007), SPIE VCIP 2010, and the IEEE Multimedia Communication Technical Committee (MMTC) Interest Group of Quality of Experience for Multimedia Communications (2011), and tutorials in PCM 2007, PCM 2009, IEEE ISCAS 2008, IEEE ICME 2009, APSIPA 2010, and IEEE International Conference on Image Processing (2010). He is currently on the editorial boards of the IEEE TRANSACTIONS ON MULTIMEDIA, the IEEE SIGNAL PROCESSING LETTERS and the Journal of Visual Communication and Image Representation, and four IEEE Technical Committees. He co-chairs the IEEE MMTC Special Interest Group on Quality of Experience. He has been on Technical Program Committees and/or Organizing Committees of a number of international conferences.
King Ngi Ngan (F’00) received the Ph.D. degree in electrical engineering from the Loughborough University, Loughborough, U.K. He is currently a Chair Professor with the Department of Electronic Engineering, Chinese University of Hong Kong. He was previously a Full Professor with the Nanyang Technological University, Singapore, and the University of Western Australia, Australia. He holds honorary and visiting professorships with numerous universities in China, Australia and South East Asia. He is an associate editor of the Journal on Visual Communications and Image Representation, as well as an area editor of EURASIP Journal of Signal Processing: Image Communication. He has published extensively including 3 authored books, 5 edited volumes, over 300 refereed technical papers, and edited 9 special issues in journals. In addition, he holds 10 patents in the areas of image/video coding and communications. Prof. Ngan is a Fellow of the Institution of Engineering Technology and the Institution of Engineering Australia. He was an IEEE Distinguished Lecturer from 2006 to 2007 and served as an associate editor of the IEEE TRANSACTIONS ON CIRCUITS AND SYSTEMS FOR VIDEO TECHNOLOGY. He chaired a number of prestigious international conferences on video signal processing and communications, and served on the advisory and technical committees of numerous professional organizations. He was a general co-chair of the IEEE International Conference on Image Processing (ICIP) held in Hong Kong in September 2010.