of chemical kinetics. Students redly enjoy building reac- tion models and comparing results as they change initial parameters; Stella can be programmed to ...
Figure 4. Chemical oscillations generated by the Oregonator model of the Belousov-Zhabotinskii reaction. of chemical kinetics. Students redly enjoy building reaction models and comparing results as they change initial parameters; Stella can be programmed to adjust parameters automatically on multiple runs. Perhaps most significantlv. usinc software like Stella enables them to studv compikx kinetic phenomena that they would not have eve; considered before. We encourage students to explore a large number of "what if?" scenarios for a wide variety of reactions in classraom presentations and on problem sets. In the process teaching and learning kinetics becomes not a tedious exercise but an eniovable and beneficial experisupplementary inf&maence. We will be happy to tion to interested readers. Acknowledgment We would like to acknowledge NSF-ILI grant USE915353 which was used to develop the chemistry department computer laboratory. In addition, we are indebted to our colleagues, W. R. Winchester and N. S. Mills, for insightful discussions and critical reading of the manuscript. We thank our many wonderful students who have made teaching chemistry fun. LKS would like to thank the Camille and Henry Dreyfus Foundation for their generous support.
Spreadsheet Simulation of a Simple Kinetic System
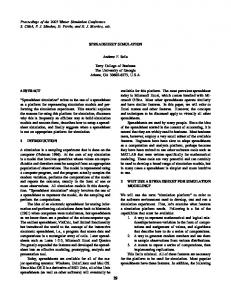
C o n s t ~ c t i o nof the Spreadsheet The construction of the spreadsheet for this problem is quite simple. Begin with a column of times with a range between 0 and 100 s as an example. The associated population of the heads and tails will be in the two adiacent columns. The important input parameters are the initial population ofheads, the initial population of tails, the rate constant for the heads to tails reaction, kf,and the rate constant for the tails to heads reaction, k,. These values will be assigned to specific cells on the spreadsheet. The initial population values are assigned to the cell locations corresponding to zero time. The coins are assumed to be on a trav that is aeitated once each second. The number of heads that change to tails in a given second will be equal to the rate constant for the heads to tails reaction, kf, multiplied by the number of heads prior to the agitation. The number of wins that change from tails to heads can be calculated in an analogous way. To get the population of heads after one second, take the initial number of heads, subtract the number of coins that flipped from heads to tails, and add the number that flipped from tails to heads. Calculate the number of tails after one second in an analogous way. The formulas for these calculations can be copied to the remaining cell locations, and the graph feature of the spreadsheet can be used to give plots of the head and tail populations vs time. As a first example, consider the case in which the pennies are initially all heads up and can flip from heads to tails but not from tails to heads. This corresponds to the irreversible H +T reaction. The actual time dependence of the number of heads-up pennies will depend on the rate constant for the heads-to-tails reaction. Figure 5 shows a plot of the number of heads-up and tails-up pennies versus time when the initial number is five million pennies all heads-up and the rate constant is 0.050 s-', which corresponds to there being a 5.0% probability of a penny flipping from heads to tails in one second. As expected, the number of heads decreases exponentially with the time, a result that can be verified by performing a log plot. The half-life for a first-order reaction is eoual to 0.693/kf.which is 14 s for this example (7). This value is consistentkth the decay curve of Figure 5.Another quantity of interest is the relaxation time, which is the average time that it takes a penny to flip from heads to tails. The relaxation time is equal to the reciprocal of the rate constant and is 20 s for this example (7).Students can "experiment" with this simulation by trying larger and smalle-r rate constants as well as different initial populations. After an&zing the irreversible problem, the case of a reversible reaction can be explored. Figure 6 shows a plot
Charles J. Maruacco Rhode Island College Providence, RI 02908 Kinetics and equilibrium are important and conceptually dimcult topics in the introductory as well as the advanced chemistry curriculum. This article describes a spreadsheet simulation of a first-order intramolecular rearrangement reaction that has been quite effective in illustrating the concepts of kinetics and equilibrium to both general chemistry and physical chemistry students. Cis-trans and keto-en01 isomerizations are examples of such reversible processes. In order to make the problem more concrete, the flipping of pennies can be used as a effective teaching analogy to such problems. The simulation can be readily done by students with only a very basic knowledge of Lotus 1-2-3,Excel or other spreadsheet software.
-.. Figure 5. The number of heads and tails versus time for the situation where all coins are heads-up initially and the rate constant for H +T, k,, is 0.050 s-' and that forT + H,k,, is 0.0 s-'. Volume 70 Number 12 December 1993
993