Proc. R. Soc. B (2005) 272, 1601–1607 doi:10.1098/rspb.2005.3115 Published online 11 July 2005
Stable isotopes, beaks and predators: a new tool to study the trophic ecology of cephalopods, including giant and colossal squids Yves Cherel1,* and Keith A. Hobson2 1
Centre d’Etudes Biologiques de Chize´, UPR 1934 du CNRS, BP 14, 79360 Villiers-en-Bois, France Prairie and Northern Wildlife Research Centre, Environment Canada, Saskatchewan, Canada S7N 0X4
2
Cephalopods play a key role in the marine environment but knowledge of their feeding habits is limited by lack of data. Here, we have developed a new tool to investigate their feeding ecology by combining the use of their predators as biological samplers together with measurements of the stable isotopic signature of their beaks. Cephalopod beaks are chitinous hard structures that resist digestion and the stable isotope ratios of carbon (d13C) and nitrogen (d15N) are indicators of the foraging areas and trophic levels of consumers, respectively. First, a comparison of d13C and d15N values of different tissues from the same individuals showed that beaks were slightly enriched in 13C but highly impoverished in 15N compared with lipid-free muscle tissues. Second, beaks from the same species showed a progressive increase in their d15N values with increasing size, which is in agreement with a dietary shift from lower to higher trophic levels during cephalopod growth. In the same way, there was an increase in the d15N signature of various parts of the same lower beaks in the order rostrum, lateral walls and wings, which reflects the progressive growth and chitinization of the beaks in parallel with dietary changes. Third, we investigated the trophic structure of a cephalopod community for the first time. Values of d15N indicate that cephalopods living in slope waters of the subantarctic Kerguelen Islands (nZ18 species) encompass almost three distinct trophic levels, with a continuum of two levels between crustacean- and fish-eaters and a distinct higher trophic level occupied by the colossal squid Mesonychoteuthis hamiltoni. d13C values demonstrated that cephalopods grow in three different marine ecosystems, with 16 species living and developing in Kerguelen waters and two species migrating from either Antarctica (Slosarczykovia circumantarctica) or the subtropics (the giant squid Architeuthis dux). The stable isotopic signature of beaks accumulated in predators’ stomachs therefore revealed new trophic relationships and migration patterns and is a powerful tool to investigate the role of the poorly known cephalopods in the marine environment. Keywords: Antarctica; community; octopus; ontogenic changes; Southern Ocean predators
1. INTRODUCTION Cephalopods play key roles in marine environments both as predators and as food of top predators, particularly in the deep oceans of the world (Clarke 1996). Determining and quantifying their trophic relationships is therefore a key issue in understanding the structure and functioning of marine ecosystems. Cephalopods are voracious, versatile and fast-growing predators but, except for some fast swimming and muscular species, knowledge of their feeding habits is limited by lack of data (Rodhouse & Nigmatullin 1996). Detailed information on the biology of cephalopods is restricted to a few commercially exploited species, mainly belonging to shelf-living families, and much less is known about oceanic and more prolific forms. Our poor understanding of cephalopod ecology mainly stems from a paucity of scientific surveys devoted to the group and our inadequacy in catching oceanic species. Research on their trophic relationships is further complicated by the fact that prey is torn into small pieces by their chitinous beaks, thus often precluding direct specific identification of food items in their stomachs. * Author for correspondence (
[email protected]). Received 13 December 2004 Accepted 2 April 2005
Here, we have developed a new tool to investigate the food and feeding ecology of cephalopods by combining the use of their predators as biological samplers together with measurements of the stable isotopic signature of their beaks (hard structures that resist digestion). There is substantial potential for using data on cephalopod consumers to gather unique information on the biology of their prey. For example, predators catch larger specimens and a greater diversity of squids than fisheries sampling gear (Rodhouse 1990). Moreover, increasing knowledge on the morphology of beaks allows species identification of accumulated items found in predators’ stomachs. Descriptions of dietary habits are the first step to better understand trophic interactions and to determine key species in ecosystems. In turn, it can provide useful information on species composition, distribution, abundance and ecology of cephalopods occurring within the foraging range of cephalopod predators (Clarke 1980; Cherel & Duhamel 2004). Since the stable isotopic signature of a consumer reflects that of its diet, stable isotope ratios of carbon (d13C) and nitrogen (d15N) have been used extensively to trace pathways of organic matter among organisms (Kelly 2000). Consumers are enriched in 15N relative to their
1601
q 2005 The Royal Society
1602 Y. Cherel & K. A. Hobson
Stable isotope signature of cephalopod beaks
food (mean value: 2.5–3.4‰; Minagawa & Wada 1984; Vanderklift & Ponsard 2003) and consequently d15N measurements serve as indicators of a consumer’s trophic position (Hobson & Welch 1992). By contrast, d13C values vary little along the food chain and are mainly used to determine primary sources in a trophic network. In the marine environment, d13C values indicate the lowerversus higher-latitude plankton and inshore versus offshore, or pelagic versus benthic, contribution to food intake (Hobson et al. 1994; Cherel et al. 2000). Almost no information is available on the stable isotopic signatures of cephalopods, but one preliminary study on muscle tissue underlined the potential of that method to investigate their trophic position and migration (Takai et al. 2000). We focused on three points; first, we compared the d13C and d15N values of beaks with that of muscle to evaluate inter-tissue variation within the same individuals. Muscle is one of the main tissues used for determining the stable isotope signature of animals (Hobson et al. 1994; Kelly 2000). Second, we hypothesized that the d15N signature increases with beak size. In cephalopods feeding shifts occur from small, lower trophic level prey of juveniles to large, higher trophic level prey eaten by adults (Rodhouse & Nigmatullin 1996). Finally, we investigated for the first time the trophic structure of a community of cephalopods because the stable isotopic approach is a powerful method of providing new insights into trophic segregation between closely related species (Hobson et al. 1994). Using top predators as biological samplers, we recently described the ecologically important and rich cephalopod fauna surrounding subantarctic islands (Cherel et al. 2004). The community includes poorly known oceanic taxa and the two largest living invertebrates, the colossal (Mesonychoteuthis hamiltoni) and giant (Architeuthis dux) squids (Cherel & Duhamel 2004).
2. MATERIAL AND METHODS (a) Field study Beaks were collected either from cephalopods taken as bycatches of the Patagonian toothfish fishery at Kerguelen or from stomach contents of various Southern Ocean predators breeding at the subantarctic Crozet and Kerguelen archipelagoes and in Ade´lie Land, Antarctica (Electronic Appendix). Predators included penguins, albatrosses, sleeper sharks and the Patagonian toothfish (Cherel & Weimerskirch 1999; Cherel & Duhamel 2004; Cherel et al. 2002; Cherel et al. 2004; unpublished data). Cephalopods were first identified from the morphology of their beaks; second, lower rostral length (LRL) of squid beaks and lower hood length (LHL) of octopus beaks were measured and, finally, allometric equations were used to estimate their dorsal mantle length (ML) from their LRL or LHL (Cherel & Duhamel 2004; Cherel et al. 2004). Undarkened or darkening (chitinizing) beaks were considered as belonging to juvenile and subadult squids, respectively, while wholly dark (chitinized) beaks indicated adult cephalopods (Clarke 1986). The cephalopod community from Kerguelen includes at least 38 different species (Cherel et al. 2004). Stable isotopes were measured on lower and upper beaks from the commonest 18 species of that community (Electronic Appendix). Beaks from avian predators were fresh items, not accumulated items, thus indicating that squids were caught in Kerguelen waters, as were fish prey. To help the Proc. R. Soc. B (2005)
investigation of feeding areas of cephalopods, the isotopic signatures of species spanning a latitudinal gradient in stable isotopes (Franc¸ois et al. 1993) were used. These control species were one Antarctic squid from Ade´lie Land (Psychroteuthis glacialis), two endemic Kerguelen octopuses (Benthoctopus thielei and Graneledone gonzalezi) and one subtropical octopus from Amsterdam Island. (b) Laboratory methods All samples were kept frozen in the field and in the laboratory until dietary analysis and identification. Cleaned beaks and muscle tissues were thereafter kept in 70% ethanol until isotopic analysis. Relative abundance of stable isotopes of carbon (13C/12C) and nitrogen (15N/14N) were determined by continuous-flow isotope-ratio mass spectrometry (CFIRMS). Prior to analysis, samples were dried, ground to a fine powder and lipids extracted from muscle samples using successive rinses in a 2 : 1 chloroform : methanol solution. Beak samples were not acidified because, to our knowledge, chitinous beaks of cephalopods do not contain significant amounts of carbonates, except those of nautiluses (Clarke 1986). Results are presented in the usual d notation relative to PDB belemnite and atmospheric N2 (AIR) for d13C and d15N, respectively. Replicate measurements of internal laboratory standards (albumin) indicate measurement errors of G0.1 and G0.3‰ for d13C and d15N, respectively. (c) Statistics Values reported are meansGs.d. Data were statistically analysed using SYSTAT 9 for WINDOWS (Wilkinson 1999).
3. RESULTS (a) d15N and d13C values in muscle and beaks of the same individuals The isotopic signatures of lower and upper beaks of P. glacialis were identical for d13C (paired t-test, tZ1.52, pZ0.163) and significantly different for d15N (tZ3.73, pZ0.005), but the difference was small (0.3G0.2‰) and within the measurement error of the method (figure 1). On the other hand, the isotopic signatures of buccal masses and arms were different in both d15N and d13C values (both p!0.0001), and they differed from those of lower and upper beaks (all p!0.001). When compared with lower beaks, buccal masses and arms were impoverished in 13C (K1.4G0.5 and K0.6G0.3‰, respectively) and enriched in 15N (2.7G0.4 and 3.8G0.3‰; figure 1). (b) Ontogenic changes Stable isotope signatures segregated beaks of different sizes of Kondakovia longimana (figure 2). There was a progressive rise in d15N values in beaks in correlation to ascending sizes of small, medium and large, that corresponded to squids of increasing sizes (LRLZ1.5G 0.3, 3.8G0.8 and 14.1G1.2 mm; MLZ33G12, 119G28 and 503G47 mm, respectively); the overall increase in d15N values averaged 4.0‰ (ANOVA, F2,26Z69.75, p!0.0001). In the same way, beaks of Moroteuthis ingens of large sizes were more enriched in 15N than beaks of smaller sizes at both Crozet (t-test, tZ8.99, p!0.0001; LRLZ5.4G0.4 and 8.4G0.3 mm, MLZ221G13 and 327G11 mm, respectively) and Kerguelen Islands
Stable isotope signature of cephalopod beaks Y. Cherel & K. A. Hobson
Figure 1. Stable carbon and nitrogen isotope values of various tissues from the same individuals of the Antarctic squid Psychroteuthis glacialis.
Figure 2. Stable carbon and nitrogen isotope values of beaks of different sizes of the onychoteuthid squids Kondakovia longimana (circles) and Moroteuthis ingens (squares) from Crozet (filled symbols) and Kerguelen (empty symbols) Islands.
(tZ7.00, p!0.0001; LRLZ4.6G0.3 and 7.5G0.3 mm, MLZ193G10 and 295G11 mm, respectively). Chitinization of lower beaks begins at the rostrum and darkens the beaks as they grow, spreading down from the hood over the lateral walls and wings (Clarke 1980). We, therefore, hypothesized that, within the same beak, the d15N values would increase from the rostrum to the lateral walls and from the lateral walls to the wings. Accordingly, there was an overall 4.8G1.2‰ increase in d15N values in beaks of B. thielei (LHLZ5.7G0.8 mm, MLZ79G 9 mm) from the rostrums to the wings (figure 3). d15N values were higher in lateral walls than in rostrums (tZ4.32, pZ0.002) and in wings than in lateral walls (tZ7.66, p!0.0001). By contrast, the d13C values varied slightly (0.6G0.3‰ between rostrums and wings; paired t-test, tZ6.37, p!0.0001). Rostrums, lateral walls and wings of large beaks of K. longimana (LRLZ15.2G 1.3 mm, MLZ543G49 mm) also differed in their stable isotope signature, but the overall increase in d15N values between wings and rostrums was smaller (1.5G0.7‰; tZ6.90, p!0.0001) and the increase in d13C was non-significant (0.7G1.0‰; tZ2.22, pZ0.053). (c) Kerguelen cephalopod community Cephalopods of the Kerguelen community were segregated by the d15N and d13C values of their beaks Proc. R. Soc. B (2005)
1603
Figure 3. Stable carbon and nitrogen isotope values of different parts of the same beaks of the octopodid Benthoctopus thielei from Kerguelen Islands.
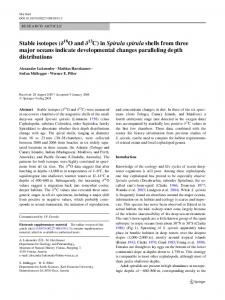
(Kruskall–Wallis testZ130 and 84, both p!0.0001). Species were deliberately placed in trophic sequence, and not in taxonomic order, according to their nitrogen signatures to illustrate the trophic structure of the community (figure 4). Most of the coexisting cephalopods on the Kerguelen slope fed along a continuum of about two trophic levels (5.6‰) from 2.8G0.6‰ (Martialia hyadesi) to 8.4G0.5‰ (Gonatus antarcticus). This gradual enrichment in 15N then stopped and there was a jump of 3.0‰ along the food chain to the colossal squid, which reached the highest d15N value of the community (11.4G 0.8‰). Kerguelen cephalopods had a restricted range in d13C values of their beaks, with 16 out of 18 species showing a gradual enrichment in 13C from K20.8G0.5‰ (Moroteuthis knipovitchi) to K19.1G0.4‰ (B. thielei). On the other hand, two species that differed in d13C values, Slosarczykovia circumantarctica and the giant squid, showed very low (K25.1G0.3‰) and high (K17.4G 0.3‰) d13C values, respectively (figure 4). S. circumantarctica had the same d13C value as our Antarctic control species, P. glacialis (Mann–Whitney, UZ37.0, pZ0.141), and Architeuthis dux had a d13C value close to, but different from, our subtropical control species, the Amsterdam octopus (UZ16.0, pZ0.021). We also investigated resource partitioning of closely related species. The four coexisting onychoteuthids (K. longimana and Moroteuthis spp.) and the two brachioteuthids (Brachioteuthis linkovskyi and S. circumantarctica) segregated by both their trophic position (d15N values) and habitat (d13C values; Kruskall–Wallis testZ 8.1 and 13.5, pZ0.045 and 0.004, respectively; and UZ94.0 and 100.0, pZ0.001 and p!0.0001, respectively). On the other hand, the two species of benthic octopods (B. thielei and G. gonzalezi) had different d15N values but identical d13C values (UZ18.5 and 60.5, pZ0.017 and 0.427), while juveniles of the two ommastrephids (M. hyadesi and Todarodes sp.) had almost identical d15N values but different d13C values (UZ25.0 and 20.0, pZ0.059 and 0.023). Finally, giant squids (LRLZ14.0G3.5 mm, MLZ1.13G0.80 m) and colossal squids (LRLZ23.6G 5.0 mm, MLZ1.44G0.31 m) are segregated by their stable isotope signatures. Beaks of giant squids had much lower d15N values but higher d13C values than
1604 Y. Cherel & K. A. Hobson
M. hamiltoni G. antarcticus C. veranyi M. psychrophila A. dux T. danae N. dimegacotyle M. knipovitchi M. sp. B (imber) G. gonzalezi H. eltaninae M. ingens B. linkovskyi B. thielei K. longimana S. circumantarctica Todarodes sp. M. hyadesi
Stable isotope signature of cephalopod beaks
(a)
Kerguelen community (n=18)
2
0
4
6
8
10
12
14
δ15N (%o) Amsterdam octopus A. dux B. thielei C. veranyi M. sp. B (imber) G. gonzalezi N. dimegacotyle M. ingens M. hamiltoni Todarodes sp. H. eltaninae B. linkovskyi T. danae M. hyadesi G. antarcticus M. psychrophila K. longimana M. knipovitchi P. glacialis S. circumantarctica –26
(b)
–24
–22
–20 δ13C (%o)
–18
–16
–14
Figure 4. (a) Stable nitrogen and (b) carbon isotope values of beaks of the main cephalopod species living in Kerguelen waters. Open symbols refer to control species endemic to Kerguelen waters (G. gonzalezi and B. thielei) and species known to live in Antarctica (P. glacialis) and in subtropical waters (Amsterdam octopus).
those of colossal squids (UZ0.0 and 37.0, pZ0.005 and 0.016, respectively; figure 4). 4. DISCUSSION (a) Methodological comments This study is the first, to our knowledge, to measure the stable isotopic signature of cephalopod beaks. As expected, little variation was found between the signature of lower and upper beaks of the same individuals of P. glacialis. Overall, there was a 1.4‰ difference between the least (buccal mass) and the most (lower beaks) 13 C enriched tissue, which is within the range of d13C values found in different tissues from the same organism (DeNiro & Epstein 1978; Tieszen et al. 1983). By contrast, d15N values showed 3–4‰ differences between Proc. R. Soc. B (2005)
the 15N enriched muscles and the 15N depleted beaks (figure 1). Stable isotopes are usually measured on lipidfree tissue extracts that mainly contain proteins. Cephalopod beaks contain not only proteins but also chitin, which is a polymer of N-acetyl-b-D-glucosamine (Merzendorfer & Zimoch 2003). In arthropods, crude exoskeleton chitin and purified D-glucosamine are also depleted in 15N, but not in 13C, when compared with muscles and diet (DeNiro & Epstein 1978, 1981; Schimmelmann & DeNiro 1986). The d15N difference between muscle tissues and beaks is thus likely to result from different metabolic pathways for protein and chitin synthesis and further investigation on cephalopods raised on control diets is needed to investigate the nitrogen isotopic shift between food and beaks.
Stable isotope signature of cephalopod beaks Y. Cherel & K. A. Hobson Two consequences arose from the isotopic signature of beaks and muscles of P. glacialis. First, caution must be made when comparing the d15N, but not the d13C, values of beaks with those of other tissues from cephalopods and other organisms to trace pathways of organic matter. Second, this does not preclude comparing the d15N values of beaks between different cephalopods, because it is likely that, similar to proteins, the metabolic pathway of chitin synthesis and hence dietary isotopic shift shows little difference among species. The usefulness of the d15N values of beaks is also underlined by its variation during ontogeny and within cephalopod species belonging to the same community (see below). (b) Ontogenic changes The d15N value verified our hypothesis of an enrichment of beak 15N with growth, which can be connected with ontogenic dietary shifts. In the few cephalopods so far investigated, most species feed on small crustaceans as juveniles and shift the diet to larger fishes and other cephalopods during growth (Rodhouse & Nigmatullin 1996). We observed a 1.9‰ difference (about half a trophic level) in d15N between medium and large beaks of M. ingens; a value that corresponds well with the known feeding ecology of the species with smaller squids feeding on both crustaceans and fishes, while larger squids prey mainly upon mesopelagic fishes (Cherel & Duhamel 2003; Phillips et al. 2003). A larger difference (4‰; about one trophic level) was noted between small and large beaks of K. longimana (figure 2). Little is known about the feeding habits of K. longimana (Lubimova 1985) but, in comparison with M. ingens, our data suggest that the species shift progressively from a crustacean to a mesopelagic fish diet at the Crozet Islands. As expected, we observed differences in the d15N value of various parts of the same beaks with an increase from the rostrum to the laterall walls and a further increase from the lateral walls to the wings (figure 3). For K. longimana however, the difference within large beaks (between rostrums and wings) is much smaller than that between beaks of different sizes (1.5‰ versus 4.0‰, respectively). The most likely explanation is that while the isotopic signature of small beaks truly reflects the feeding ecology at the beginning of life, that of rostrums integrate the whole life. Cephalopod beaks grow by accretion of new molecules of proteins and chitin and there is no turnover after synthesis. Consequently, cephalopod beaks retain molecules built up from early development to time of death and their isotopic signature integrates the feeding ecology of the animal over its whole life. Owing to differences in size, however, the signature of large beaks is skewed to the last period of life during which more mass accretion occurred. This is also true for the rostrum, which is the first part of the beak to chitinize. On the other hand, the isotopic signature of the wings, which are the last parts to be chitinized, is likely to be a good index reflecting the feeding ecology during the later period of the animal’s life. In that context, it is noteworthy that the d15N value of the wings of beaks from adult K. longimana is higher than that of the whole beaks (6.7G0.6‰ versus 5.5G0.5‰, respectively; tZ4.69, p!0.0001), thus again showing a higher trophic level in adult squids. The carbon signature of beaks of M. ingens did not change with size and that of different parts of lower beaks Proc. R. Soc. B (2005)
1605
of B. thielei showed little variation, suggesting that each species live essentially in the same water mass all life long. On the other hand, there was an impoverishment in 13C with increasing beak size in K. longimana (figure 2). This difference is, however, more likely to result from different foraging areas of the top predators than in those of K. longimana, because first, large and smaller squids were prey of the wandering albatross and king penguin, respectively (Electronic Appendix), and second, rostrums, lateral walls and wings from the same large beaks of K. longimana had identical d13C values. (c) Community structure The d15N values of beaks indicate that the community of cephalopods living in slope waters at Kerguelen Islands encompasses almost three distinct trophic levels. This is more than previously found in communities of closely related marine organisms (Hobson et al. 1994; Lesage et al. 2001; Nyssen et al. 2002), thus suggesting a greater diversity in the feeding habits of coexisting cephalopods. The structure of the community showed both a trophic continuum and distinct trophic levels (figure 4). At Kerguelen Islands, juveniles of M. ingens feed on both euphausiids and mesopelagic fishes (Cherel & Duhamel 2003), while juveniles of the ommastrephids M. hyadesi and Todarodes spp. prey upon amphipods and euphausiids (unpublished data). Accordingly, the medium d15N value of M. ingens is higher (5.3‰) than that of ommastrephids (2.8–3.4‰), which had the lowest d15N values of the community. This strongly suggests that subantarctic cephalopods spread out in a continuum between crustacean- and fish-eaters and that omnivory, defined as feeding on more than one trophic level, appears to be their dominant feeding strategy. The colossal squid, however, is segregated from all the other species by having a very high d15N value. Hence, the species is a top predator, probably feeding on large fishes and squids, and being, in turn, the prey of apex predators like sperm whales and sleeper sharks (Clarke 1980; Cherel & Duhamel 2004). Size is an important factor structuring trophic links within communities and ecosystems. A slight but significant linear relationship was found between d15N and squid size, indicating the larger the squid the higher its trophic level (data not shown). However, the relationship is not significant when removing the colossal squid. Surprisingly, small (ML!20 cm) and delicate squids like Mastigoteuthis psychrophila and Chiroteuthis veranyi had higher d15N values than large (MLO40 cm) and robust species like K. longimana, Taningia danae and giant squid. This emphasizes how poorly the trophic interactions of many cephalopod taxa in the Southern Ocean and elsewhere are known. Most of the Kerguelen cephalopods showed a narrow range with small variances in d13C values close to those previously found in other marine organisms from the area (Cherel et al. 2000). Sixteen out of 18 of the cephalopod species retained the isotopic signature of Kerguelen waters, their primary habitat, where some of them—the two octopods—are moreover known to be endemic. Two species however showed very distinct d13C signatures, the 13 C depleted S. circumantarctica and the 13C enriched giant squid (figure 4). Lower-latitude plankton food bases have higher d13C values relative to higher-latitude waters in the Southern Ocean and the geographical range
1606 Y. Cherel & K. A. Hobson
Stable isotope signature of cephalopod beaks to study inter-individual variation in habitat use and the degree of specialization of some individuals. In summary, the stable isotopic signature of beaks accumulated in predators’ stomachs revealed new and unexpected trophic relationships and migration patterns among poorly known cephalopod species and families. It proved to be a useful tool to investigate trophic interactions where other methods are largely ineffective and has great potential due to the high number of cephalopod beaks that can be easily recovered from the stomach of sharks, large predatory fishes, seabirds and marine mammals.
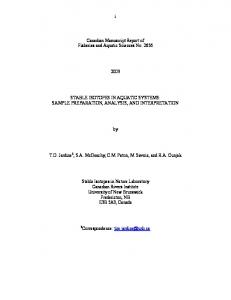
14 12 10 8
Mesonychoteuthis hamiltoni Architeuthis dux
6 4
–22
–21
–20 –19 δ13C (%o)
–18
–17
Figure 5. Stable carbon and nitrogen isotope values of individual beaks of colossal squids Mesonychoteuthis hamiltoni (open circles) and giant squids Architeuthis dux (filled squares) from Kerguelen Islands. d15N values of beaks of colossal squids are positively and linearly related to their d13C values ( yZ0.45xC20.22, rZ0.81, pZ0.005), which is in agreement with latitudinal variations in the isotopic signature of particulate organic matter at the base of the food web in the Southern Ocean (Franc¸ois et al. 1993; Altabet & Franc¸ois 1994).
between Antarctica, Kerguelen and the subtropics spans a natural gradient in d13C values in marine waters (Franc¸ois et al. 1993). Hence, the very negative d13C value of S. circumantarctica, which is identical to that of the endemic Antarctic P. glacialis, strongly suggests that the species grew in Antarctic waters before migrating to the Kerguelen area. Similarly but in an opposite way, the more positive d13C value of giant squids, which is similar to that of albatrosses moulting in subtropical waters (Cherel et al. 2000), indicates squids migrated from north of the subtropical front to Kerguelen waters. Consequently, the large range in d13C values demonstrates that Kerguelen cephalopods grew in three different marine ecosystems, from the subtropics to Antarctica. Stable isotope measurements also revealed interesting features among closely related cephalopods. For example, the two benthic octopods have identical carbon signatures but are segregated by their d15N values, indicating different diets in the same habitat. By contrast, juveniles of the two ommastrephids had identical d15N values but differed in their d13C values, showing that both species fed on the same trophic level but that M. hyadesi lives in more offshore waters than Todarodes sp. Even larger differences were found between the two newly described brachioteuthids that are segregated by their d15N and d13C values, S. circumantarctica being an Antarctic species and B. linkovskyi a subantarctic one. Finally, it is noteable that giant and colossal squids also segregated by their d15N and d13C values. While the colossal squid is, as expected, a top predator, giant squids surprisingly showed a much lower position (more than one trophic level) in the food chain. The d13C values of colossal squids are the only ones to show a large variance (figure 4). Indeed, there was a continuum of d13C values indicating individuals developing in subtropical to southern waters and, thus, overlapping at least in part with the subtropical signature of giant squids (figure 5). This example illustrates the usefulness of the method, not only at the community and population levels, but also Proc. R. Soc. B (2005)
The authors thank P. Healy for preparing samples for stable isotope analysis and M. Stocki for running the samples at the Department of Soil Science, University of Saskatchewan.
REFERENCES Altabet, M. A. & Franc¸ois, R. 1994 Sedimentary nitrogen isotopic ratio as a recorder for surface ocean nitrate utilization. Global Biogeochem. Cycles 8, 103–116. Cherel, Y. & Duhamel, G. 2003 Diet of the squid Moroteuthis ingens (Teuthoidea: Onychoteuthidae) in the upper slope waters of the Kerguelen Islands. Mar. Ecol. Prog. Ser. 250, 197–203. Cherel, Y. & Duhamel, G. 2004 Antarctic jaws: cephalopod prey of sharks in Kerguelen waters. Deep Sea Res. I 51, 17–31. Cherel, Y. & Weimerskirch, H. 1999 Spawning cycle of onychoteuthid squids in the southern Indian Ocean: new information from seabird predators. Mar. Ecol. Prog. Ser. 188, 93–104. Cherel, Y., Hobson, K. A. & Weimerskirch, H. 2000 Using stable-isotope analysis of feathers to distinguish moulting and breeding origins of seabirds. Oecologia 122, 155–162. Cherel, Y., Weimerskirch, H. & Trouve´, C. 2002 Dietary evidence for spatial foraging segregation in sympatric albatrosses (Diomedea spp.) rearing chicks at Iles Nuageuses, Kerguelen. Mar. Biol. 141, 1117–1129. Cherel, Y., Duhamel, G. & Gasco, N. 2004 Cephalopod fauna of subantarctic islands: new information from predators. Mar. Ecol. Prog. Ser. 266, 143–156. Clarke, M. R. 1980 Cephalopoda in the diet of sperm whales of the Southern Hemisphere and their bearing on sperm whale biology. Discov. Rep. 37, 1–324. Clarke, M. R. 1986 A handbook for the identification of cephalopod beaks. Oxford: Clarendon Press. Clarke, M. R. 1996 The role of cephalopods in the world’s oceans. Phil. Trans. R. Soc. B 351, 977–1112. DeNiro, M. J. & Epstein, S. 1978 Influence of diet on the distribution of carbon isotopes in animals. Geochim. Cosmochim. Acta 42, 495–506. DeNiro, M. J. & Epstein, S. 1981 Influence of diet on the distribution of nitrogen isotopes in animals. Geochim. Cosmochim. Acta 45, 341–351. Franc¸ois, R., Altabet, M. A. & Goericke, R. 1993 Changes in the d13C of surface water particulate matter across the subtropical convergence in the SW Indian Ocean. Global Biogeochem. Cycles 7, 627–644. Hobson, K. A. & Welch, H. E. 1992 Determination of trophic relationships within a high Arctic marine food web using d13C and d15N analysis. Mar. Ecol. Prog. Ser. 84, 9–18. Hobson, K. A., Piatt, J. F. & Pitocchelli, J. 1994 Using stable isotopes to determine seabird trophic relationships. J. Anim. Ecol. 63, 786–798. Kelly, J. F. 2000 Stable isotopes of carbon and nitrogen in the study of avian and mammalian trophic ecology. Can. J. Zool. 78, 1–27.
Stable isotope signature of cephalopod beaks Y. Cherel & K. A. Hobson Lesage, V., Hammill, M. O. & Kovacs, K. M. 2001 Marine mammals and the community structure of the Estuary and Gulf of St Lawrence, Canada: evidence from stable isotope analysis. Mar. Ecol. Prog. Ser. 210, 203–221. Lubimova, T. G. 1985 Results of Soviet investigation of the distribution and ecology of pelagic squids (Oegopsida) in the Southern Ocean. Selected Papers SC-CCAMLR 1985, 79–111. Merzendorfer, H. & Zimoch, L. 2003 Chitin metabolism in insects: structure, function and regulation of chitin synthases and chitinases. J. Exp. Biol. 206, 4393–4412. Minagawa, M. & Wada, E. 1984 Stepwise enrichment of 15 N along food chains: further evidence and the relation between d15N and animal age. Geochim. Cosmochim. Acta 48, 1135–1140. Nyssen, F., Brey, T., Lepoint, G., Bouquegneau, J. M., De Broyer, C. & Dauby, P. 2002 A stable isotope approach to the eastern Weddell Sea trophic web: focus on benthic amphipods. Polar Biol. 25, 280–287. Phillips, K. L., Nichols, P. D. & Jackson, G. D. 2003 Sizerelated dietary changes observed in the squid Moroteuthis ingens at the Falkland Islands: stomach contents and fatty acid analyses. Polar Biol. 26, 474–485. Rodhouse, P. G. 1990 Cephalopod fauna of the Scotia Sea at South Georgia: potential for commercial exploitation and
Proc. R. Soc. B (2005)
1607
possible consequences. In Antarctic ecosystems. Ecological change and conservation (ed. K. R. Kerry & G. Hempel), pp. 289–298. Berlin: Springer. Rodhouse, P. G. & Nigmatullin, C. M. 1996 Role as consumers. Phil. Trans. R. Soc. B 351, 1003–1022. Schimmelmann, A. & DeNiro, M. J. 1986 Stable isotopic studies on chitin. II. The 13C/12C and 15N/14N ratios in arthropod chitin. Contrib. Mar. Sci. 29, 113–130. Takai, N., Onaka, S., Ikeda, Y., Yatsu, A., Kidokoro, H. & Sakamoto, W. 2000 Geographical variations in carbon and nitrogen stable isotope ratios in squid. J. Mar. Biol. Assoc. UK 80, 675–684. Tieszen, L. L., Boutton, T. W., Tesdahl, K. G. & Slade, N. A. 1983 Fractionation and turnover of stable carbon isotopes in animal tissues: implications for d13C analysis of diet. Oecologia 57, 32–37. Vanderklift, A. & Ponsard, S. 2003 Sources of variation in consumer-diet d15N enrichments: a meta-analysis. Oecologia 136, 169–182. Wilkinson, L. 1999 SYSTAT 9 for Windows. Chicago: SPSS. The supplementary Electronic Appendix is available at http://dx.doi. org/10.1098/rspb.2005.3115 or via http://www.journals.royalsoc.ac.uk. As this paper exceeds the maximum length normally permitted, the authors have agreed to contribute to production costs.