Statistical mechanics of convergent evolution in spatial patterning Bhavin S. Khatria,b,1, Tom C. B. McLeishc,d, and Richard P. Seara aDepartment
of Physics, University of Surrey, Guildford GU2 7XH, United Kingdom; cSchool of Physics, University of Edinburgh, Edinburgh EH9 3JZ, United Kingdom; bSchool of Physics and Astronomy, University of Leeds, Leeds LS2 9JT, United Kingdom; and dDepartments of Physics and Chemistry, Durham University, Durham DH1 3HP, United Kingdom Edited by Jose´ N. Onuchic, University of California at San Diego, La Jolla, CA, and approved April 24, 2009 (received for review December 3, 2008)
We explore how the genotype–phenotype map determines convergent evolution in a simple model of spatial gene regulation during development. Evolution is simulated via a Monte Carlo scheme that incorporates mutation, selection, and genetic drift, by using a bottom-up model of gene regulation with a fitness function that is optimized by a switch-like response to a morphogen gradient. We find that even for very simple regulation, the genotype–phenotype map gives rise to an emergent fitness landscape of remarkable complexity. This leads to a richness of evolutionary behavior as population size is increased that parallels the thermodynamics of physical systems as temperature decreases. Convergence is controlled by the existence of sufficiently dominant global optima in ‘‘free fitness,’’ which is a quantity that is the balance of mutational entropy and fitness. In independent simulations at low population sizes, we find convergence to a phenotype of suboptimal fitness due to the multiplicity or entropy of solutions. This contrasts with convergence to the optimal fitness phenotype at high population size. However, at sufficiently large population sizes, we find convergence in only the phenotypes with greatest effect on fitness, whereas noncritical phenotypes exhibit divergence due to quenched disorder on a locally rough landscape. Our results predict that for large populations, the evolution of even simple gene regulatory circuits may be glassy-like, such that, counter to the commonly accepted view that conservation implies function, many conserved phenotypes are simply frozen accidents of little consequence to the fitness of the organism. fitness landscapes 兩 gene regulation 兩 genotype–phenotype map 兩 mutational entropy 兩 population genetics
O
ver the past 150 years, much work has established natural selection, mutation, and genetic drift as the basic processes of evolution (1–5). However, there still remains much controversy concerning how the complexity and diversity of biological form has arisen from essentially random processes; does evolution play out in an arena of weak constraints, or are there hidden limits to the possibilities of biological form. This is epitomized in the debate regarding the role of historical contingency in evolution; were we to replay the tape of life, would, as Stephen Jay Gould (6) suggested, historical accidents compound and amplify in time such that biological organisms on Earth today would be unrecognizable, or is evolution constrained to the extent that life forms would correspond with those on earth today, as argued by Simon Conway Morris (7). There are many examples in the natural world of independent convergence that support the latter stance, a famous example is the near-identical structure of the mammalian and octopus camera eye (7), whereas empirical support for divergence in evolution is rarer, because by its very nature, the demonstration of different solutions under the same selective pressure is difficult. At the heart of this debate is that, despite an understanding of the basic mechanisms of evolution, questions of the genotype to phenotype map and the underlying structure of evolutionary landscapes have attracted little attention to date. However, there are exceptions, for example, the body of work that has studied the genotype–phenotype map of the folding of 9564 –9569 兩 PNAS 兩 June 16, 2009 兩 vol. 106 兩 no. 24
RNA sequences (8), which suggest that a single RNA shape (phenotype) maps to large neutral networks in sequence (genotype) space. Such redundancy is also seen in the context of the evolution of transcription factor binding (9–11), where a single binding constant of a protein to a regulatory region can be realized by a number of different pairs of sequences, distinguished only by the number of mismatches between them. The many-to-one nature of the genotype–phenotype map naturally gives rise to the concept of mutational entropy (9, 12, 13), which importantly, can bias the course of evolution in a manner not predictable from studies based on phenotypic landscapes (14). In this article, we study the genotype–phenotype map for the evolution of spatial patterning in development and examine the role that mutational entropy and finite population size play in determining the independent convergence of evolutionary solutions. In the regime of small population size, the most appropriate model of evolution is described by a Wright–Fisher process (2, 3), where populations are monomorphic at loci, aside from short periods when a rare and ultimately successful mutation vies for fixation in the population. Here, we introduce a Monte Carlo (MC) scheme based on the probability of fixation of a mutant of fitness ␦F compared with the wild type, which we use to explore the fitness landscape. As demonstrated by Sella and Hirsh (12) in the general case, and Berg and La¨ssig (9), for the case of transcription factor binding, there is an exact mathematical correspondence between the Wright–Fisher process and the canonical ensemble of statistical mechanics in steady state; the ratio of forward and reverse fixation rates (␦F)/(⫺␦F) ⫽ exp(␦F), implying that the probability distribution of the most recent common ancestor is a Boltzmann distribution with an effective temperature ⫺1 ⫽ (2(N ⫺ 1))⫺1 for haploid asexual populations, as is assumed in this article. As shown by Sella and Hirsh (12), this means that in steady-state evolutionary processes, there is a balance between mutational entropy S and mean fitness 具F典, where a quantity analogous to the Helmholtz free 1 energy, the free fitness ⌽ ⫽ 具F典 ⫹ S is at maximum. We use this analogy to show that from a simple model of the genotype– phenotype map for gene regulation, an emergent and unexpected complexity arises, which leads to a richness of behavior as population size is varied that parallels that found in condensed-matter physics as a function of temperature. This, in turn, gives rise to a number of unexpected consequences for molecular evolution, which we explore within the context of the question of convergence. Model There are 3 main elements to the model: (i) a model of spatial patterning of an embryo, (ii) a model for the genotype–phenotype map, and (iii) a means of determining fitness of a phenotype and Author contributions: B.S.K., T.C.B.M., and R.P.S. designed research; B.S.K. performed research; and B.S.K., T.C.B.M., and R.P.S. wrote the paper. The authors declare no conflict of interest. This article is a PNAS Direct Submission. 1To
whom correspondence should be addressed. E-mail:
[email protected].
This article contains supporting information online at www.pnas.org/cgi/content/full/ 0812260106/DCSupplemental.
www.pnas.org兾cgi兾doi兾10.1073兾pnas.0812260106
Spatial Patterning. Spatial patterning is of profound importance in
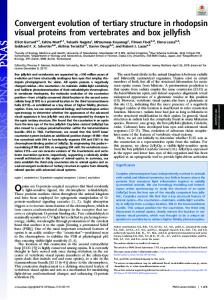
developmental biology because it allows the organization of transcription factors (TFs) into different spatial regions, which then ultimately leads to differentiation of the embryo into a variety of cell types and higher morphological forms (15). However, different regions or cells must receive information on their relative position within a developing embryo. A well-studied mechanism to achieve this is the formation of a concentration gradient of a morphogen that pervades the embryo (16); concentration then becomes a function of position, which can then be ‘‘read-off’’ by downstream targets. Many developmental processes have been shown to rely on morphogens, such as bicoid (17) or decapentaplegic (Dpp) (18) and wingless (Wg) (19), which pattern the anterior–posterior (A–P) axis of the syncytial blastoderm and the wing imaginal disc, respectively, in Drosophila. Here, we choose a simplified patterning model, based on an extracellular morphogen gradient acting on downstream targets in a cellularized embryo of fixed length L. As shown in Fig. 1, we use a minimal gene regulatory module that will be evolved to pattern an embryo into 2 halves along a given developmental axis, such as the A–P axis, forming a boundary of expression at its midpoint. The minimal system consists of a morphogen M with an exponential concentration gradient [see supporting information (SI)] with steepness characterized by the inverse decay length ␣, a transcription-initiator protein R (e.g., RNA polymerase) with fixed concentration and a single TF T, whose concentration profile is the output of the network, dependent on the concentration and cooperative binding of M and R to the regulatory region of T. In this article, we do not allow T to affect its own transcription in the interests of keeping the evolutionary computations simple. Genotype–Phenotype Map. The genotype–phenotype map represents how genomic sequences are mapped to organismal function on which selection ultimately acts. In this article, a genotype is expressed in terms of binary sequences, whereas we consider a phenotype to be any function of those sequences. To study the genotype–phenotype map, we use a binary genome G, following the ‘‘2-state’’ approximation (11, 20) for transcription factor binding. This assumes that amino acid base pair hydrogen-binding energies are approximately additive and that each ‘‘nonoptimal’’ interaction increases the energy of binding by the same amount. As depicted in Fig. 1, we assume each protein has a pair of binary sequences, 1 for binding to DNA, as described above and 1 for ‘‘gluing’’ protein pairs for cooperative DNA binding, where the cooperative glue energy Khatri et al.
adds stability for each favorable hydrophobic interaction between amino acids (21). The regulatory region that controls transcription of the TF consists of adjacent nonoverlapping binding sites, each with its own binary sequence. More complicated regulatory schemes are possible, such as allowing overlapping binding sites (22); however, we choose a nonoverlapping approximation to keep our model of the genotype phenotype map simple. In this article, we assume the length of binding sequences are lb ⫽ 10 and glue sequences lg ⫽ 5, giving a total genome size, G ⫽ 50. The binding and cooperative energies are calculated by using the Hamming distance or number of mismatches between a relevant pair of binary sequences. To allow switch-like behavior with changing concentration (or chemical potential) for the occupation of binding sites requires the background free energy (binding of other nontarget sites in the genome) to be within kBT of the maximum TF binding energy (20). Hence, in this article, all energies are measured relative to the strongest binding TF or equivalently the genomic background free energy. In our minimal model of spatial gene regulation, there is only a single regulatory region with 2 binding sites, so that the binding free energy of the ith protein to the jth binding site, with sequences bi and rj, respectively, is Eij ⫽ b共bi, rj兲,
[1]
where (b, r) is the Hamming distance between sequences b and r, b is the cost in energy for each mismatch and the indices can take values, i ⫽ {R, M} and j ⫽ {P, 1}, P being the promoter site and 1 being the adjacent binding site. We assume b ⫽ 2kBT as a typical value for the mismatch energy, which are found to be in the range 1 ⫺ 3kBT (11, 20). Similarly, the cooperative energy ␦Eii⬘ between the ith and i⬘th proteins is
␦Eii⬘ ⫽ g共lg ⫺ 共gi, ˘g i⬘兲兲,
[2]
where gi is the glue sequence of the ith protein, and ˘g represents the binary sequence flipped about its center. This mimics the chirality of real proteins and prevents the cooperative stability from always being maximum for homodimers; maximum stability will be achieved between proteins i and i⬘, when gi ⫽ ˘gi⬘. The parameter g is the stability added for each favorable hydrophobic interaction between amino acids, which we assume to be g ⫽ ⫺kBT. Given lg ⫽ 5, this gives interactions consistent with typical literature values of ⫺2 to ⫺7kBT for hydrophobic interactions between proteins (23, 24). The binding and glue energies represent 1 level of phenotype, which are explicit functions of an underlying genotype G. The morphogen steepness ␣ is also a phenotype, because, in principle, PNAS 兩 June 16, 2009 兩 vol. 106 兩 no. 24 兩 9565
EVOLUTION
subsequent evolution via Monte Carlo simulation. An overview of the first 2 parts is given in Fig. 1.
APPLIED PHYSICAL SCIENCES
Fig. 1. An overview of the genotype–phenotype map. The gene regulatory module has input a morphogen gradient M(x) across a 1-dimensional embryo of length L and outputs a transcription factor T(x). The specific equation shown for the morphogen profile arises from solving the reaction-diffusion equation with reflecting boundary conditions and is valid for all ␣ (SI). Gene regulation of T by using a morphogen and RNAP (R) is controlled in a bottom-up manner by binding to its regulatory region consisting of a promoter P and adjacent binding site 1. Binding (E) and glue energies (␦E) are determined by comparison of the relevant sequences contained in G.
it could also be resolved into a binary sequence, for example, related to protease-specific binding that would target it for degradation. However, because this sequence would not directly interact with the binding process involved in regulation, we choose to ‘‘coarse-grain’’ its evolution as a continuous parameter while retaining a ‘‘finegrain’’ model of binding and glue sequences that determine transcription. Given an exponential morphogen concentration profile M(x,␣) as a function of the position of embryonic cells, x, and a fixed concentration of RNAP, R, in each cell, we follow Shea and Ackers (23) to calculate the TF concentration profile T(x), assuming transcription is proportional to the probability of RNAP being bound to the promoter pRP. This probability can be calculated by using the canonical ensemble of statistical mechanics (details can be found in SI). Because T cannot affect its own transcription, the steady-state concentration profile is then simply proportional to pRP(G, R, M (x, ␣)), where G ⫽ [bR, bM, rP, r1, gR, gM] is the genome and is a function of all of the binding and glue sequences from proteins and DNA. The proportionality constant will be given by the ratio of the rate of transcription and translation to the rate of degradation of T, which is not important in our study, because we are only interested in the shape or contrast of T(x) that can be achieved. Monte Carlo Scheme. To determine the goodness of the spatial gene
regulation, the resulting concentration profile T(x) is then mapped to a Malthusian fitness by use of a functional that promotes expression of the TF in the anterior half while penalizing expression in the posterior half,
F ⫽ F 关T共x兲兴 ⫽
冕
L/2
T共x兲dx ⫺
冕
L
T共x兲dx
L/2
0
L 2
maxx兵T共x兲其
,
[3]
where, importantly, the functional weighting is chosen so that F has a maximum possible value of 1, obtained by a perfectly sharp boundary at x ⫽ L/2 and so that only the contrast of the TF profile affects fitness. As long as concentration levels of protein species per cell are sufficiently large, so that relative fluctuations in copy number are small (25), ignoring the magnitude of T should be realistic in determining fitness. Eq. 3 was chosen for its simplicity, and is just one of a number of possible fitness functionals that would achieve localized protein expression; for example, Eq. 3 could also include terms that select for a large negative gradient at the boundary of expression x ⫽ L/2. In addition, F should be considered as an indicator of fitness, because in practice, this phenotype along with many others, will contribute in a complicated and nonlinear way (epistasis) to the growth rate of the organism. As indicated by Eq. 3, fitness is determined by both the genome G and the morphogen gradient M(x), which is determined by the effective production rate at the source J, and the gradient steepness ␣. The quantity J will only affect the magnitude of M(x), so the fitness as defined by Eq. 3 will be insensitive to it. In contrast, it is clear that ␣ will have a strong impact on fitness, so we allow continuous ‘‘mutations’’ in this parameter, chosen from a Gaussian distribution of standard deviation ␦␣ ⫽ 0.5. By using Eq. 3, mutations in the genome between subsequent MC steps give rise to a change in fitness ␦F. In the regime of small population size (N ⬍⬍ 1), where N is the effective size of the haploid asexual population of the idealized Wright–Fisher process (3), and is the mutation rate per base pair per organism, the probability of fixation of this mutant with fitness difference ␦F compared with the current wild type is given by ref. 5,
共␦F兲 ⫽
1 ⫺ e⫺2␦F . 1 ⫺ e⫺2N␦F
9566 兩 www.pnas.org兾cgi兾doi兾10.1073兾pnas.0812260106
[4]
Fig. 2. Output concentration profiles T(x) at various time points for a typical simulation run, for a population size of N ⫽ 50 and a total of 106 attempted mutations (Monte Carlo steps) for a fitness functional that promotes expression of T in the anterior half of an embryo (Eq. 2).
Eq. 4 is then the acceptance probability in a MC scheme that simulates the stochastic success and failure of mutants fixing in the population. The chosen MC scheme assumes that populations are always monomorphic, such that the dynamics due to drift and selection that give rise to fixation, can be neglected because they occur on a much shorter time scale than the average time between fixation of successive mutations (26). In the case of neutral mutations (N␦F ⬍⬍ 1), this is true as long as the average time between successive fixation events (⬃1/) is much larger than the average time for genetic drift to affect fixation from the instant the mutation arises in the population (⬃N), i.e., N ⬍⬍ 1, which is satisfied by-definition for ‘‘small’’ populations. From Eq. 4, advantageous mutations (N␦F ⬎⬎ 1, ␦F ⬍⬍ 1) will fix at a rate N␦F and take approximately ln(N␦F)/␦F generations to fix (27), so here we require Nln(N␦F) ⬍⬍ 1. So for typical eukaryote mutation rates of ⬃ 10⫺9, we expect this formalism to be valid for most realistic population sizes encountered in eukaryote species and even small microbial colonies. Results To study evolutionary behavior in the simple model of spatial patterning described above, we ran multiple independent simulations each with a random initial genome G, but with the same initial morphogen steepness ␣, for a total of 107 mutations (equivalently MC steps). The first observation is that for sufficiently large population sizes (N ⬎ 10), the simulated evolutionary process always comes to an equilibrium that consists of an ensemble of significantly fit solutions, in which it is clear from visual inspection that T is expressed largely in the anterior only (Fig. 2). As the time series in Fig. 3 show, in general, phenotypes of good fitness require that some binding or glue energies are constrained, whereas others can accommodate large fluctuations. In particular, a defining characteristic of the ensemble of solutions found is that the morphogen binds strongly to the first binding site (EM1 ⬇ 0), the glue energy between M and R, ␦ERM, is large and negative and that the binding energy of RNAP to the promoter is always greater than the chemical potential of RNAP (ERP ⬎ R). After the discussion above, the constraint on ERP is a basic requirement for switch-like behavior. These facts indicate that the solution to the patterning problem consists of the morphogen cooperatively binding with RNAP to give a simple threshold mechanism, where the concentration of T is a sigmoidal function of M (see SI). The time series also show that there are certain energies, such as the binding energy of the morphogen to the promoter, that can evolve a large range of values with little consequence to fitness and so are essentially noncritical or neutral in nature. In addition, from Fig. 2. we can see that evolution also produces characteristic defects in the patterns, which are inherent to this threshold mechanism, namely a nonzero expression of T in the posterior, due to a background concentration Khatri et al.
of R and a decrease in concentration at the far anterior of the embryo, due to M–M complexes blocking R from binding to the promoter. At low population size, it is evident that these defects are not serious enough to be selected against. Equilibrium Statistical Mechanics Determines Convergence for Small Populations. Fig. 3 shows a typical set of time series data from a
simulation run at N ⫽ 50. The time series data of fitness F (Fig. 3A, gray) show that adaptation occurs very quickly compared with the duration of the simulation, followed by fluctuations from a maximum fitness state of F ⬇ 0.68. The fluctuations are changes in fitness as a result of substituted mutations in the population and as expected when genetic drift dominates, the size of these fluctuations do not exceed more than a few times 1/ ⬇ 0.01, for N ⫽ 50. However, it is clear that more structure appears when examining the time series of the morphogen gradient ␣ (Fig. 3A, red) and the various energies {E,␦E} (Fig. 3 B and C). We see there is stochastic bistable switching between 2 values of the morphogen gradient, ␣1 ⬇ 7 and ␣2 ⬇ 10, where the former is coincident with an increase in the likelihood of substitutions in the sequences that code for {E,␦E}, as shown by the increased frequency of changes in these energies. This suggests there is a difference in the local curvature and/or roughness of the fitness landscape for these 2 values of the morphogen gradient, a hypothesis we will test below. In addition, we note that the solutions represented by ␣1 are suboptimal compared Khatri et al.
PNAS 兩 June 16, 2009 兩 vol. 106 兩 no. 24 兩 9567
EVOLUTION
Fig. 3. Time series data from a typical simulation run for a population size of N ⫽ 50 and a total of 107 attempted mutations (only first 106 steps shown for clarity) for evolution of solutions for the patterning problem. The parameter t represents the number of attempted mutations. Each mutation is separated by an average of 1/NG generations. (A) Fitness F versus time (gray) and steepness of morphogen gradient ␣L versus time (red). (B) Time series of binding energies Eij of ith protein to jth binding site of regulatory region of T. (C) Time series of glue energies ␦Eii⬘, between the ith and i⬘th protein.
with ␣2 with an average difference in fitness of ⬇0.05, which is consistent with a steeper morphogen gradient allowing a sharper spatial boundary and thus greater fitness (see SI). To further understand this behavior, we performed simulations at a range of populations sizes between N ⫽ 20 and N ⫽ 110 with the expectation that a change in the characteristic scale of fitness 1/, would probe any difference in local curvature or roughness. In Fig. 4 we plot the effective ‘‘free fitness’’ (the analogue of free energy in statistical mechanics) ⌽(␣) projected onto to the morphogen gradient, which is calculated in similar fashion to the potential of mean force of a thermodynamical system: ⌽(␣) ⫽ lnZ(␣) ⬃ lnp(␣). Here, Z(␣) is the analogue of the partition function and is a sum or integral over genotype degrees of freedom for a fixed ␣. As shown by Sella and Hirsh (12), the free fitness is an effective landscape that balances the fitness of a phenotype and mutational entropic effects due to a multiplicity of genotypes that may gives rise to a given phenotype. It is effectively an energy function for the evolutionary dynamics: Maxima in free fitness correspond to stationary evolutionary states for populations of finite size. Furthermore, the contribution of mutational entropy to the free fitness implies that its maxima will not, in general, coincide with maxima in fitness of the phenotype. In order for the concepts of free fitness and mutational entropy to be relevant, the system should be in equilibrium; specifically, it should be ergodic, such that the phase space of genotypes should be sampled uniformly. To check that the system is ergodic, we repeated the simulations at each populations size a number of times, for various initial values of ␣ and also calculated the free fitness by averaging over the end-state from a large ensemble (⬇100) of simulations of shorter duration (see SI) but long enough that adaptation has occurred. In both cases, we find the same probability distributions of parameter values indicating that the system is ergodic for this range of population sizes. The bistability shown in Fig. 3 of the morphogen gradient ␣ singles this phenotype out for particular study; from Fig. 4, we see that at low population size (N ⬍ 30), there is a single peak in free fitness with a maximum at ␣ ⬇ 7. As the population size increases, we see a second peak that emerges at ␣ ⬇ 10 and continues to increase in free fitness tending toward convergence for N ⬎ 50. The observation of a single-peaked free fitness landscape shows that at sufficiently small populations sizes, there is convergence to a suboptimal value of ␣. This suggests that there is an entropic contribution to the free fitness that is dominating at small population size. This is further supported by the emergence of the
APPLIED PHYSICAL SCIENCES
Fig. 4. Free fitness landscape projected onto the morphogen steepness ␣ as a function of populations size N, where each plot for a given value of N is offset vertically for clarity. Analogous to the free energy, local maxima in free fitness represent local equilibrium states; upon increasing the population size N, we see a change in the dominance of the low ␣-phenotype to the high ␣-phenotype.
Fig. 5. Fitness landscape projected onto the morphogen steepness ␣, for populations sizes N ⫽ 20 (gray), N ⫽ 50 (red), and N ⫽ 500 (blue). For N ⫽ 20, and N ⫽ 50, the plot is obtained from single simulations of 107 attempted mutations, whereas for N ⫽ 500, each isolated blue trace is from a single independent simulation, which total 6 in this plot. Each of the numerous single peaks represents a fitness landscape of the patterning problem for a fixed genotype but with ␣ allowed to vary; vertical evolutionary transitions between curves arise from mutations in G, whereas evolution along each curve is due to mutations in ␣.
secondary peak at higher N, ␣ ⬇ 10, which from Fig. 3, is known to be of higher fitness and so indicates that the solutions of this phenotype have lower mutational entropy compared with the ␣ ⬇ 7 phenotype. In this case, where N ⬎ 50, by inspection, we can see a difference in free fitness between maxima of ⬇1/, and so given that the width of the 2 maxima are approximately equal, we expect that the probability of evolution picking the high-fitness phenotype (␣ ⬇ 10) is p ⫽ 1/(1 ⫹ e⫺1) ⬇ 0.73, which we also confirmed by direct calculation from the time spent in each phenotype. As the population size increases to n ⬇ 100, we see the difference in free fitness increases to ⌬⌽ ⬇ 2, such that p ⬇ 0.9. However, as N increases beyond N ⫽ 110, we find that independent simulations result in different probability distributions of ␣ and the binding and glue energies, indicating that evolution is no longer ergodic. It is possible that simulations of longer duration at these population sizes may recover ergodicity, however, as we will see in the next section, simulations at significantly larger population sizes provide direct evidence of local fitness valleys, suggesting that at N ⬎ 110, we begin to probe this local roughness in the fitness landscape and the consequent slowing of dynamical degrees of freedom. The free fitness plots in Fig. 4, in general, give highly redundant 1-dimensional projections of the various phenotypic parameters, which makes it difficult to infer correlations between parameters. In Fig. 5, we show a scatter plot of fitness versus morphogen gradient ␣, for N ⫽ 20, 50, and 500, where each point represents the fitness of a mutation that has fixed in the population at some point during the simulation. From Fig. 5, it is clear that the genotype-tophenotype map of even a simple regulatory system gives rise to a highly complex and discrete structure to the fitness landscape. Each of the numerous peaks is the fitness landscape for a fixed set of binding and glue energies {Eij,␦Eii⬘}, which will be shown empirically below and is supported by an analytical calculation of the fitness landscape F(␣) in SI. Given this picture of the fitness landscape, we can write the partition function as Z(␣) ⫽ ¥neFn(␣), where the sum runs over all solutions for different genotypes, so it is clear that the large entropic component of the free fitness at N ⫽ 20 is due to the very large number of solutions that are clustered around ␣ ⬇ 7, and are within a few times 1/ of the maximum fitness, such that they contribute significantly to the partition sum. As expected, as the population size is increased to N ⫽ 50, the proportion of time the population adopts the more-fit phenotype increases, as the effects of entropy become less important. 9568 兩 www.pnas.org兾cgi兾doi兾10.1073兾pnas.0812260106
Fig. 6. Local roughness of fitness landscape. (A) Typical time-series traces of binding energies {Eij} versus time, for independent simulations at a large population size of N ⫽ 500. The time series show that after an initial adaptation period, evolution becomes trapped to a locally optimum set of binding and glue energies (as shown in A for binding energies). Independent simulations at N ⫽ 500 show the same behavior but trapped to a different set of energies. (B) Free fitness landscape at N ⫽ 50, projected onto the binding energies ER1 and EMP for low (A) and high (B) ␣-phenotype, respectively, calculated by partitioning time-series data visually and excluding any transition regions. Fitness is represented by the shade of gray as indicated by the color bar, where black is high fitness, and white is low fitness.
Divergent Evolution of Noncritical Phenotypes for Large Populations.
Also shown in Fig. 5 are scatter plots of fitness versus morphogen gradient at a significantly higher population size of N ⫽ 500, where now each isolated blue peak corresponds to a different independent simulation. We see that ergodicity is lost at very high population size, because each independent run is trapped to a single, but different, solution of the patterning problem. We can see explicitly that each of these curves is indeed 1 genotype with a fixed set of {Eij,␦Eii⬘} by plotting the time course of the evolving phenotypes for a single simulation at N ⫽ 500. This is shown in Fig. 6A, where after adaptation, the populations remains fixed to the same set of binding and glue energies with no further substitutions. The simplest explanation for such behavior is that the landscape is locally rough with valleys in fitness that are in far in excess of the characteristic scale of fitness for N ⫽ 500, 1/ ⬇ 0.001; once adaptation has occurred to the closest local maxima, it will take an exponentially long waiting time to escape. This can be seen more directly by analyzing the free fitness landscape projected onto the phenotypes EMP and ER1, which are largely unconstrained at low population sizes (Fig. 3). In Fig. 6B, we show such a landscape for each ␣-phenotype at N ⫽ 50; it is clear that the high-fitness phenotype exhibits a pronounced ‘‘checkerboard effect,’’ whereas the suboptimal phenotype is relatively smooth. Roughness in the high-fitness phenotype can be inferred, because mutations in these 2 energies can only give rise to vertical or horizontal moves on the landscape and because we see that single mutations can result in large relative changes in fitness. The scale of roughness or typical size of fitness valleys can be read off as ⬇0.02, which is an order of magnitude larger than the scale of fitness at N ⫽ 500 and so can explain the trapping of these phenotypes on the time scale of the simulations. In addition, the observation that the 2 ␣-phenotypes appear to have different local properties, with the high-entropy phenotype being smoother than the high-fitness phenotype is consistent with their different substitution rates observed in Fig. 3. To summarize at large populations sizes of N ⫽ 500, we see divergence in the noncritical phenotypes for patterning due to local Khatri et al.
1. 2. 3. 4. 5. 6. 7. 8. 9. 10. 11. 12. 13. 14. 15. 16. 17.
Darwin CR (1859) The Origin of Species (Murray, London). Fisher RA (1930) The Genetical Theory of Natural Selection (Oxford Univ Press, Oxford). Wright S (1931) Evolution in Mendelian populations. Genetics 16:97–159. Wright S (1945) The differential equation of the distribution of gene frequencies. Proc Natl Acad Sci USA 31:382–389. Kimura M (1962) On the probability of fixation of mutant genes in a population. Genetics 47:713–719. Gould S (1989) Wonderful Life (Norton, New York). Conway Morris, S (2003) Life’s Solution (Cambridge Univ Press, Cambridge, UK). Fontana W (2002) Modelling ‘evo– devo’ with RNA. BioEssays 24:1164 –1177. Berg J, Willmann S, La¨ssig M (2004) Adaptive evolution of transcription factor binding sites. BMC Evol Biol 4:42. Gerland U, Hwa T (2002) On the selection and evolution of regulatory DNA motifs. J Mol Evol 55:386 – 400. von Hippel PH, Berg OG (1986) On the specificity of DNA–protein interactions. Proc Natl Acad Sci USA 83:1608 –1612. Sella G, Hirsh AE (2005) The application of statistical physics to evolutionary biology. Proc Natl Acad Sci USA 102:9541–9546. Sengupta AM, Djordjevic M, Shraiman BI (2002) Specificity and robustness in transcription control networks. Proc Natl Acad Sci USA 99:2072–2077. Force A, et al. (1999) Preservation of duplicate genes by complementary, degenerative mutations. Genetics 151:1531–1545. Wolpert L, et al. (2006) Principles of Development (Oxford Univ Press), 3rd Ed. Wolpert L (1969) Positional information and the spatial pattern of cellular differentiation. J Theor Biol 25:1– 47. Driever W, Nu¨sslein-Volhard C (1988) The bicoid protein determines position in the Drosophila embryo in a concentration-dependent manner. Cell 54:95–104.
Khatri et al.
ACKNOWLEDGMENTS. This work was supported by The John Templeton Foundation’s Cambridge Templeton Consortium (1142). We thank the anonymous referees for helpful comments on the draft of this work.
18. Nellen D, Burke R, Struhl G, Basler K (1996) Direct and long-range action of a DPP morphogen gradient. Cell 85:357–368. 19. Zecca M, Basler K, Struhl G (1996) Direct and long-range action of a wingless morphogen gradient. Cell 87:833– 844. 20. Gerland U, Moroz JD, Hwa T (2002) Physical constraints and functional characteristics of transcription factor-DNA interaction. Proc Natl Acad Sci USA 99:12015–12020. 21. Wolberger C (1999) Physical constraints and functional characteristics of transcription factor–DNA interaction. Annu Rev Biophys Biomol Struct 28:29 –56. 22. Hermsen R, Tans S, ten Wolde PR (2006) Transcriptional regulation by competing transcription factor modules. PLoS Comput Biol 2:e164. 23. Shea MA, Ackers GK (1985) The OR control system of bacteriophage lambda. A physical– chemical model for gene regulation. J Mol Biol 181:211–230. 24. Buchler NE, Gerland U, Hwa T (2003) On schemes of combinatorial transcription logic. Proc Natl Acad Sci USA 100:5136 –5141. 25. Tostevin F, ten Wolde PR, Howard M (2007) Fundamental limits to position determination by concentration gradients. PLoS Comput Biol 3:78. 26. La¨ssig M (2007) From biophysics to evolutionary genetics: Statistical aspects of gene regulation. BMC Bioinformatics 8 Suppl 6:S7. 27. Desai MM, Fisher DS (2007) The speed of evolution and maintenance of variation in asexual populations. Genetics 176:1759 –1798. 28. Golding I, Cohen I, Ben-Jacob E (1999) Studies of sector formation in expanding bacterial colonies. Europhys Lett 48:587–593. 29. Guttenberg N, Goldenfeld N (2008) Cascade of complexity in evolving predator–prey dynamics. Europhys Lett 100:058102. 30. Ciliberti S, Martin OC, Wagner A (2007) Innovation and robustness in complex regulatory gene networks. Proc Natl Acad Sci USA 104:13591–13596.
PNAS 兩 June 16, 2009 兩 vol. 106 兩 no. 24 兩 9569
APPLIED PHYSICAL SCIENCES
Conclusions and Discussion In this article, we have studied the evolution of a simple model of spatial patterning, in the regime where mutations arise rarely and fix sequentially in populations of fixed size. From a minimal bottom-up model of gene regulation, we have demonstrated that a strikingly rich behavior emerges from the complexity of the genotype-to-phenotype map. In particular, we find evolution can be biased toward certain phenotypes, simply as a result of being mapped onto from a larger number of genotypes, even if these phenotypes represent suboptimal solutions. Convergence requires a global and sufficiently dominant optimum in free fitness as well as population sizes smaller than the inverse of typical local fitness valleys. Larger populations are trapped in local maxima, and we find that the evolutionary simulations are no longer ergodic. It is instructive that ergodicity can be achieved when only a small fraction of phase space (10⫺8 of 250 ⬇ 1015 possible binary states) can be visited with simulations of length 107 mutations. One explanation is that viable solutions cover the whole of gene space, but sparsely, similar to the neutral networks of RNA sequences that map to tertiary structure (8), in that only a relatively small number of mutations are needed to find this region from any given point in gene space. Importantly, it may also point to a deep underlying symmetry of genotype space, in which distant regions (large Hamming distance) give rise to exactly the same set of binding and glue energies. What is the biological relevance of these findings? An important conclusion of our results for evolution on locally rough landscapes is that not all conserved phenotypes are indicative of functional necessity for the organism. For populations of size greater than the typical size of local valleys, there may be certain phenotypes that are strongly conserved in a lineage, yet have little or no functional relevance, because their values are effectively frozen by unpassable valleys in genotype space. This behavior is analogous to that of glassy materials which exhibit ‘‘quenched disorder’’; microscopic degrees of freedom are frozen and take fixed random values as a result of quenching of the temperature below some critical threshold. If fitness landscapes are rough with respect to their ‘‘neutral’’
phenotypes, then our results make the prediction that we expect a larger number of conserved phenotypes for organisms evolved at sufficiently large population sizes or, conversely, more variation at small population sizes. We would caution that it is possible that by including other mutation operations such as insertions and deletions, populations may be able to traverse local fitness valleys. However, in the case of ‘‘indels,’’ it is likely that they will largely be deleterious and that advantageous or neutral occurrences will fix only very rarely. Importantly, we note that despite the divergence or quenched disorder of the less-important binding free energies, e.g., ER1 (Fig. 6A), we find that the binding free energy with the largest effect on the fitness, EM1, still converges at larger population sizes. This is strongly reminiscent of the evolution of the human and octopus eye, where critical features such as the broad geometry are convergent, whereas the presumably small fitness cost associated with different positions of the optic nerve has allowed this phenotype to diverge in the 2 lineages. It is striking that even for the minimal gene regulatory module studied here, the genotype-to-phenotype map reveals a highly nontrivial fitness landscape; for example, a priori, it would be difficult to predict that 2 patterning phenotypes would emerge with very different entropic contributions. This raises the open question of the importance of entropic contributions to free fitness landscapes for organisms in nature; are most organisms suboptimally adapted to their environments? It is anticipated that as more complex and realistic coupled genotype–phenotype regulatory schemes are studied, together with the inclusion of spatial or geographic variation (28), time-varying environments and/or competition between multiple species (29), that a very rich behavior will be uncovered. For example, as the combinatorial complexity of networks grows, we may expect very large and nontrivial entropic contributions to different parts of the underlying fitness landscape. Following the work of A. Wagner and coworkers (30) and the importance of neutral spaces in gene networks, we speculate that such contributions will have a strong bearing on understanding the remarkable robustness and evolvability of biological systems found in nature.
EVOLUTION
roughness. However, it should be noted that for the binding and glue energies that are critical for the threshold mechanism, we still observe convergent behavior.