RaptorRes.38(1) :47-54 2004 The Raptor ResearchFoundation, Inc.
STATUS
AND
DISTRIBUTION
OF
CHESAPEAKE
BREEDING
OSPREYS
IN
THE
BAY: 1995-96
BRYAND. WATTS,1 MITCHELL A. BYRD, AND MARIAN U. WATTS Center for Conservation Biology,College of Williamand Mary, Williamsburg, VA 23187 U.S.A. ABSTRACT.--Wesurveyedthe tidal portions of the ChesapeakeBay for nesting Ospreys(Pandionhaliaetus)during the breeding seasonsof 1995-96. The population wasestimatedto contain 3473 + 75 (SE) breedingpairs.The populationhasmore than doubledsincethe comprehensivesurveyconducted in 1973. During this recovery,there has been considerablespatialvariation in the rates of population growth. Mean doubling times for well-definedsubregionsvaried from a low of 4.3 yr to more than 40 yr. In general, growth rateshave been highestin the tidal fresh and upper estuarineareas,where pairs occurredin 1973. Basedon the pattern and magnitude of the recovery,it seemsthat the Chesapeake Bay population experienceda greater decline during the post World War II era than waspreviouslybelieved.Nestingsubstrateuseby ChesapeakeBayOspreyshasshiftedsince1973.The useof trees
for nestinghas declinedfrom 31.7-7.2% in 23 yr. Channelmarkersaccountedfor 53.5% of all nest structuresin the current study.Platformsestablishedspecificallyfor Ospreyssupported12.1% of pairs. The proliferation and diversificationof artificial substratesthroughout the ChesapeakeBay has been one of the most important factorscontributing to recent population expansion. KEYWORDS: Osprey; Pandion haliaetus;Chesapeake Bay;nestsubstrate;, populationincrease.
ESTATUS Y DISTRIBUCI6N DE •GUILAS PESCADORAS DURANTE SU REPRODUCCI6N EN LA BAHIA DE CHESAPEAKE: 1995-96
RzSUMEN.--Estudiamos las porcionesmar•ales de la bahia de Chesapeakeen buscade •guilas pescadoras (Pandionhaliaetus)que estuvierananidando durante las estacionesreproductivasde 1995-96. Se estim6que la poblaci6ncontenia3473 ___ 75 parejasen reproducci6n.La poblaci6nha aumentadomas del doble desdeque el completoestudiose 11ev6a caboen 1973. Durante estarecuperaci6n,ha habido una considerablevariaci6n temporal en las tasasde crecimiento poblacional.La media de los tiempos de duplicaci6n para sub regionesbien definidasvari6 desde un promedio bajo de 4.3 aftos a uno de mas de 40 aftos. En general, las tasasde crecimiento mas altas han ocurrido en las zonas de marea frescayen las•reas altasde los estuarios,donde se presentaronpocasparejasen 1973.Con baseen el patr6n y magnitud de la recuperaci6n,parece que la poblaci6n de la bahia de Chesapeakeexperiment6 un declivemftsgrande de 1o que se creia, durante la post guerra de la segundaguerra mundial. E1uso del sustratode anidaci6n pot las •guilas de la bahia de Chesapeakeha cambiadodesde 1973. E1 uso de •rboles para anidar ha diminuido de 31.7% a 7.2% en 23 aftos. Los marcadoresde canalesdan cuenta del 53.5% de todaslas estructurasde anidaci6n en el presenteestudio.Las plataformasestablecidasespecificamente para las•tguilasalbergaron12.1% de lasparejas.La proliferaci6ny diversificaci6n de sustratosartificialesa lo largo de la bahia de Chesapeakeha sidouno de losfactoresmftsimportantes que ha contribuido en la reciente expansi6nde la poblaci6n. [Traducci6n de C•sar Mftrquez]
The ChesapeakeBay supportsone of the largest Osprey(Pandionhaliaetus)breedingpopulationsin the world (Henny 1983). As with many similar populations, Ospreysin the ChesapeakeBay experienced dramatic declines in the post World War II era due to reproductivesuppression(Truitt 1969, Kennedy1971, 1977,Wiemeyer1971) inducedby
environmentalcontaminants(Via 1975,Wiemeyer et al. 1975). The ChesapeakeBay population appeared to have reacheda low point by 1973 when Henny et al. (1974) estimatedits size to be 1450 breeding pairs. Since that time, both reproductive performance(Reese,1975,Henny 1977) and overall population size (Spitzer 1989, Westall 1990, Houghton and Rymon 1994) have shownremark-
1 E-mail address:
[email protected]
able recoveries.
47
48
WATTS ET AL.
VOL. 38, NO. 1
the distribution and availability of nesting substratesfor the Osprey population. Breeding Ospreyshave adapted to numerous types of artificial substrates,so both distribution and abundance of breeding pairs havebeen influenced by the distribution of human settlement. We located Osprey nestsby piloting a small boat along the shoreline of the ChesapeakeBay and its tributaries. All tributaries were followed and surveyedto the fall line or to their navigational limits. In total, more than 800 major and minor tributaries were surveyed.Due to the size of the study area and limitations in manpower, it was not feasible to surveythe entire ChesapeakeBay during duced varied results (Reese 1969, Stinson and Byrd a single breeding season.Portions of the bay within Virginia were surveyedduring the breeding seasonof 1995 1976, Schmid 1977). These differences suggest and thosewithin Maryland were surveyedin 1996. We do that, even for areaswithin the bay, declinesvaried not feel that the primary objectives(i.e., reassesspopulation statusduring a narrow point in time and compare spatially. Throughout the 1980s, evidence began to sug- survey results to previous benchmark) of this investigation were compromised by this approach. gest that the Osprey population was approaching Becauseof the extensive area of coverage,it was not the carrying capacityof the ChesapeakeBay.Com- feasible to visit nests multiple times throughout the seaparisons of selected geographic areas indicated son. The term "occupied nest" asusedhere followed the
Henny and Ogden (1970) indicated that the magnitudeof the declineexperiencedby the Chesapeake Bay Osprey population was considerably lessthan that observedfurther north in New England. However, estimating the size of the historical population in the ChesapeakeBay has been difficult becauseno bay-widesurveyswere conducted prior to declines.Comparisonsmade betweensurveysconductedin the 1970sand publishedobservationsprior to 1947 for selectedareashavepro-
that the number of breeding pairs had recovered to levels documented prior to the decline (Reese 1996). Sibling aggressionand associatedbrood reduction in other locations suggested food stress (Roberts 1982, McLean and Byrd 1991, P. Spitzer unpubl. data). Available nesting substrate appeared to be saturatedwithin selectedlocations and age at first reproduction had increased,likely in responseto nest-sitelimitation (Spitzer 1989).
definition appliedin the 1973survey(referredto as "active nests"in that survey;Henny et al. 1974). Nestswere
considered to be occupied if they had Ospreyson the nest or in the immediate vicinity or had evidence of use during the current breeding season.As in 1973, nearly all nestsdesignatedas occupied had attending adults or young present. One potential problem pointed out by Henny and VanVelzen(1972) and Henny et al. (1974) is that in many populations,5-10% of individualsassociated with nestsare nonbreeders.Although the majority of nestssurveyedhad direct evidenceof a breeding attempt These views were based on observations from a (eggs or young present), it is possiblethat some nests limited number of geographicareas.No bay-wide attended by nonbreeders were included in the population estimate. Nest siteswere separatedinto seven catesurveyhasbeen attemptedsince1973. gories: (1) day markers, (2) light markers, (3) Osprey Here we report the results of a comprehensive platforms, (4) duck blinds, (5) other man-made strucsurveyfor ChesapeakeBay Ospreysconducteddur- tures, (6) pine trees (Pinus spp.), and (7) hardwood and ing the breeding seasonsof 1995-96. We compare trees. All duck blinds detected were recorded status,distribution, and the use of substratetypes mapped. The list of navigationalaidsfrom the late 1990s
(United StatesCoast Guard 1999,)was compiled for the to Henny et al. (1974), and alsoassess spatialvar- tidal portion of the ChesapeakeBay to estimate avail-
iation in population growth during the time period between the two comprehensivesurveys. METHODS
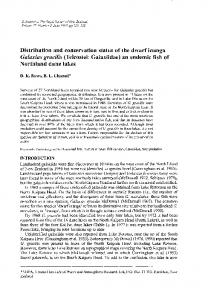
This study included the entire tidal portion of the ChesapeakeBay (Fig. 1). The ChesapeakeBayis the largest estuary in the United States, containing more than 19 000 km of tidal shoreline. The bay'swide salinitygra&ent, shallow water, and climate have made it one of the
most productive aquatic ecosystemsin North America. Osprey now breed throughout the estuary,from the Atlantic
Ocean
to the fall line.
The
fall line
is an erosional
scarp where the metamorphic rocks of the Piedmont meet the sedimentary rocks of the Coastal Plain. The geologic formations along this boundary frequently determine
the landward
extent
of tidal
influence.
Over
the
ability of day and light markers. No attempt wasmade to map all platforms erected for Ospreys. To determine growthratesfor different areasthroughout the Chesapeake Bay, population estimatesfor geo-
graphicareasdefined in the early1970s(Kennedy1971, Henny et al. 1974, M. Byrd unpubl. data) were compared to
those
from
the
mid-1990s.
Growth
rates
were
ex-
pressedusing the mean time (in years) required for the breeding population to double in size (tdouble). Doubling time wascalculatedusing the growth equation N t = N0ert where N t is the estimated population size in the mid1990s,No is the estimatedpopulationsizein 1973. Mean doubling time is estimatedas tdo,,b•c = ln(2)/r. The 1973 surveywas an aeriabbasedsurvey supplemented with ground surveysover much of the studyarea. Henny et al. (1974) used a modified PetersenEstimator
last severaldecades,expansionof the human population
(Overton and Davis 1969) to derive a series of correction
within
factors that were specific to both geographic area and type of nesting substrate. Correction factors were designedto account for differencesin field crewsbetween
waterfront
areas
has
altered
the
nature
of the
shoreline. The physicalinfrastructure associatedwith this expanding human population led to a dramatic shift in
MARCH 2004
CHESAPEAKE BAY OSPREY POPULATION
49
ChesapeakeBay Study Area
•Point
Lookout Smith
Island
Point
New Point
Fisherman's
Island
N
CapeHenry
0510 •
kilometers 20 30 40
50 i
Figure 1. Map of the ChesapeakeBay studyarea including tributariesand landmarksused to delineate geographic areas.
50
WATTS ET AL.
Table 1. A comparisonof Ospreynestsdetected by boat and additional nests detected from a fixed-wing aircraft inland of the shoreline (boat undercount)
for ten trib-
utaries in 1996. Mean correction factor was applied to survey results to improve the overall Chesapeake Bay population estimate.
VOL. 38, No. 1
Table 2. A summary of Osprey pairs detected in the Chesapeake Bay by geographic area. Counts refer to breeding pairs mapped during boat surveys.Estimates were made by applying a correction factor derived from aerial surveys(see Methods and Table 1). GEOGRAPHIC AREA
COUNT
ESTIMATE
86 492
95.5 546.1
162
179.8
324
359.6
ADDI-
Maryland
TIONAI,
Western
Shore
PAIRS
NESTS
DETECTED
DETECTED
CORRECTION
BY BOAT
FROM AIR
FACTOR
20
2
1.10
41
5
1.12
Susquehannato Bay Bridge Bay Bridge to Little Choptank
32
4
1.13
Little Choptank to VA/MD
Yeocomico River
29
2
1.07
Coan
33
5
1.15
1.09
TRIBUTARY
Nansemond
P•ankatank Great
River
River
Susquehannato Bay Bridge Bay Bridge to Potomac River Eastern
Wicomoco
River
River River
Corrotoman
Shore
River
Border
Maryland Total
23
2
Ware River
16
2
1.13
Virginia
North
11
1
1.09
Western
River
Pamunkey River
28
4
1.14
Severn River
18
2
1.11
New Point to Cape Henry
Mean (SD)
1.11 (0.024)
of 796 nestsrecordedwere detectedduring ground surveys.Of 94 nestsnot detectedduring ground surveys,77 (81.9%) were in trees (it wasnot determined how many of these were not detected by boat because they were inland of the primary shoreline). This study used a ground-basedapproach and all areas were surveyed by the same field crew. We assumed that all Osprey nestsover water or along the shorelinewere detected (100% visibilityrate) during the boat surveys. Basedon detection patterns derived from the 1973 survey, this assumptionmay have led to an underestimateas h•gh as 10%. Throughoutthe 1980sand 1990sa growing number of Osprey have colonized areas increasinglyinland of the primary shoreline (B. Wattsand M. Byrd pets. observ.). Most of these nests occur on cell towers, transm•ssion towers, and other man-made structures and are
806
894.7
680
754.8
Shore
VA/MD
Border to Fisherman's
Island
geographic areas and anticipated variation in detection rateswith substratetype. Nest detection rateswere shown to be higher for ground surveyscompared to aerial surveysacrossall geographic areasand substratetypes.Within the areas surveyedby both techniques,702 (88.2%)
475.1
1656.1
Shore
Potomac River to New Point Eastern
428
1492
Virginia Total ChesapeakeBay Total
151
167.6
1637 3129
1817.1 3473.2
lated for each of the 10 rivers by dividing the total number of undetected (sum of boat and air) by the number of nests detected during the boat survey.The mean of these correction factorswas then used bay-wideto refine population estimates. RESULTS
We estimated the breeding population of Os-
preys in the ChesapeakeBay to contain 3473 breeding pairs in the mid-1990s.Maryland and Virginia portionsof the bay supported1656 and 1817 pairs, respectively(Table 2). In Maryland, the tributaries and bays of the eastern shore supported
61.3% of the breeding pairs. In contrast,the extensivetributarieson the westernshore supported magnitude of this inland undercount, aerial surveyswere 90.8% of the breeding pairs in Virginia. This difconducted along ten tributariesduring the breeding seafbrence is consistentwith the distributionof open son of 1996. To detect Osprey nests,a high-wing Cessna not detectable
from
a boat.
In an effort
to estimate
the
172 aircraft was used to systematically overfly the land surface
at an altitude
of ca. 100 m. The
aircraft
was ma-
neuvered systematically between the shoreline and a distance of approximately 1 km inland to cover the most probablebreedinglocations.Boatand aerialsurveys were comparedto determine the number of Ospreyneststhat were not detectedduring boat surveysdue to their inland location (Table 1). A simple correctionfactor wascalcu-
water
and shoreline
within
these
two states.
All major tidal-tributariesof the ChesapeakeBay now support large breeding populations.These include the PotomacRiver (797 estimatedbreeding pairs), James River (362), Rappahannock River (285), Choptank River (228), York River (188), Patuxent River (155), and Chester River (129). Al-
M_ARCH 2004
CHESAPEAKE BAY OSPREY POPULATION
51
Table 3. Populationcomparisonbetween1973 and 1995-96 for geographicareasdelineatedby Kennedy (1971), and Henny et al. (1974). Valuesof r refer to intrinsicratesof increase.Valuesof tdouble refer to estimateddoubling time in years.
GEOGRAPHIC AREA Western
1971-73b
1995-96
r-V^LUF•
tdoub•
Shore
SusquehannaRiver to Bay Bridge Bay Bridge to Point Lookout
12.1
95.5
0.090
38.8
390.7
O.100
6.9
Patuxent
22
155.4
0.085
8.2
198.3
363.0
0.026
87.5
320.8
0.059
57.7
0.044
15.8
48.7 126.7
81.0 252.0
0.023 0.031
26.4 11.7
114.8
217.6
0.029
23.9
23.4
145.4
0.083
8.4
6
245.3
0.161
4.3
River
Potomac River (MD) Potomac River (VA) Smith
Fleeton
Point
22
Area
to Windmill
Point
RappahannockRiver Between Rappahannockand York Rivers York River b
JamesRiverb ChickahominyRiver,Easternshore SusquehannaRiver to BayBridge Bay Bridge to Taylor'sIsland Taylor'sIsland to Virginia Border Virginia Shorelineand WattsIslandb
7.7
12
115.4
0.098
7.0
69.1
179.8
0.042
16.7
242.3
359.6
0.017
40.4
159.9 49
309.7 125.4
0.029 0.041
24.1 17.0
Whole valuesare from total ground countsrather than corrected estimates(see Methods and Table 1). Surveyfrom Kennedy 1971.
though breeding densityremains highest near the main stem of the bay, breeding pairs occur in low densitiesnear the fall line of virtually every major tributary. The Chesapeake Bay Osprey population has more than doubled since the comprehensivesur-
veys conducted in 1973. Over this time period, growth rates have varied considerablyamong regions of the bay (Table 3). Estimated mean doubling times for well-defined geographic areas varied from a low of 4.3 yr on the JamesRiver to more than 40 yr on the eastern shore below the Bay Bridge. In general, growth rates have been highest in the upper reachesof the estuarywhere very few pairs occurred in 1973. Nesting substratesused by ChesapeakeBay Ospreys shifted between 1973 and the mid-1990s. Man-made structureswere used by 68.3% of the
populationin 1973comparedto 92.8% in the mid1990s.
Part
of this shift is due
to the increase
in
of all substrates
used in the mid-1990s.
Duck
blinds
have declined in relative use over the 20-yr period from
28.7-9.7%. Other man-made structures accounted for 17.6% of used substrates in the mid-
1990s,and included boat houses,chimneys,docks, ships, electrical power poles, bridges, cell phone towers, and pilings. The portion of the breeding population that nested in trees declined consider-
ably over the 20-yr period from 31.7-7.2% (5.0% pines, 2.2% hardwoods). DISCUSSION
In little more than twentyyears,the Chesapeake Bay Ospreypopulation has more than doubled in size. The increase in numbers is obvious throughout the entire estuary. However, the growth rate over this time period has varied widely among regions within the bay.Virtually all of the areasconsidered to be "strongholds" for the speciesin the
1970shaveshownrelativelylittle growthsincethat time. The lack of rapid growth within these locations supportsearlier suggestionsthat these areas all substrates documented in the 1973 and 1995were less effected by contaminants than popula96 surveys. respectively.Current use is split be- tions elsewhere (Reese 1969, 1970). Not coincidentweenday (944, 30.2% of total substrates)and light tally, these are the same areasfrom which most of markers (728, 23.3%). Osprey nesting platforms the ecological information concerning Chesawere experimentalin 1973,but represented12.1% peake Bay Ospreyshas been collected (e.g., Reese availabilityand use by Osprey of navigationalaids. These structuresrepresented21.8% and 53.5% of
52
WATTS F,T )•L.
VOL. 38, NO. 1
1970, 1977, Stinson 1976, McLean 1986, Spitzer 1989). This relationshiphas understandablyled to a limited perspective,both on the decline of the broader ChesapeakeBay population and on its re-
reflects this limitation. However, from a bay-wide perspective,the continued expansion of the human population throughout the ChesapeakeBay estuaryhas provided for a consistentincreaseand diversificationof nesting structuresfor breeding covery. Osprey populationswithin the tidal fresh and Ospreys. Aside from the banning of key chemical combrackishportions of the ChesapeakeBay have experienced the most rapid growth rates since the pounds, the increasein nesting substrateshas like1970s.In recent years,after this surveyof the mid- ly been the most important factor fueling the re1990s, these populations have continued to grow covery of the ChesapeakeBay Osprey population. (B. Watts and M. Byrd pers. observ.).Comparisons The change in substrate use between the early for some of these areas were not included
in Table
1970s and the mid-1990scontinuesthe ongoing shift of ChesapeakeBay Ospreysto artificial structures that has been apparent throughout the latter 1973 apparentlybecausetheysupportedno known half of the twentieth century.All accountsprior to breeding pairs at that time. Assumingthis to be 1950 describenearly all Osprey nestsobservedas true, growth ratesfor populationswithin severalof in either live or dead trees (Jones 1936, Tyrrell these areas since that time would be the highest in 1936, Reese 1969). In 1973, more than 65% of Osthe bay. The lack of any historic accountswithin preyswere nesting on man-made structures(Henthese areasprior to the bay-widedecline makes it ny et al. 1974). By the 1990s this portion of the difficult to determine if the lack of birds there in population had increasedto more than 90%. In the early 1970s reflects the historicaldistribution just 50 yr time, the population has progressed of the speciesin the bay or a total population col- through an almost complete shift from trees to arlapse. The rapid colonization of these areas tificial structures. Numerous classes of structures have contributed throughout the 1980sand 1990smakesit difficult to believe that they were not occupiedhistorically. to the shift in substrateuse. Osprey nesting platIndications that the Osprey population was forms were not in use in the ChesapeakeBayuntil reaching the capacityof the ChesapeakeBay dur- the 1960s and 1970s (Reese 1970, Rhodes 1972). ing the 1980s,reflect conditionswithin the few lo- The widespreadplacement of platforms by the cations for which information was available rather general public during the 1980s and 1990s has than bay-widepatterns.Reese (1969, 1970) docu- greatly improved substrateavailabilityin many armented recovery of the population below the Bay eas. No attempt was made during boat surveysto Bridge on the eastern shore to pre-DDT levels determine the availability of platforms. However, when the bay-widepopulation wasstill below 1500 380 Osprey pairs were nesting on such platforms. pairs in the early 1970s.Ospreyswithin this loca- Duck blinds have been common throughout the tion had the slowestgrowth rates compared to all ChesapeakeBay at least since the 1920sbut have other identified areas (Table 3). In Mobjack Bay, fluctuated dramatically in numbers through the where an increasein siblingaggressionand brood decades(Stotts1958, Henny et al. 1974). Approxreduction was documented between the 1970s imately 3000 duck blinds were mapped during (Stinson 1976) and the 1980s (McLean 1986), the shoreline surveysincluding just over 300 that were population has remained relativelystablesincethe more than 25 m offshore. Ospreys rarely utilize m•d-1980s(M. Byrd unpubl. data). No information duck blinds that are not isolated from the shoreis currently available on the occurrence of food line. A total of 303 duck blinds supportednesting stressthroughout different geographicareasor its pairs, during the current survey suggestingthat importance to the bay-widepopulation. Saturation nearly all isolatedduck blinds were used. Aides to navigationor "channel markers" have of availablenesting substratehas been documented along the Choptank River (Spitzer 1989). Sub- become the most common substrates used for neststrate limitation is a widespreadand natural con- ing by Ospreysthroughoutthe ChesapeakeBay.In dition throughout the bay especiallywithin areas 1973, Henny et al. (1974) report 316 nestson with extensive wetlands devoid of trees. The drachannel markers. These pairs represented21.8% matic response of breeding Ospreysto nest plat- of the population.There were 1875 navigational forms established on Smith Island (Rhodes 1972) structuresmaintainedin the bay in 1973, suggest3 becausethey were excluded from the Henny et al. (1974) survey.These areaswere not surveyedin
MARCH 2004
CHESAPEAKEgAY OSPREYPOPULATION
ing an occupationrate of just below 17%. In the mid-1990s
we recorded
1672
nests on
channel
53
of Defense and the Center for ConservationBiology. Scott Forbes,CharlesHenny, Peter Thomas, and Troy Wellicome made helpful commentson an earlier draft of
markersrepresenting53.4% of nestscounteddur- this manuscript. ing boat surveys.These included944 on day markersand 728 on light markers.In the late 1990s,the LITERATURE CITED U.S. CoastGuard listed 1680 day markersand 1249 HENNY,C.J. 1977. Research,management,and statusof light markers maintained throughout the Chesa-
the Ospreyin North America. Pages199-222 in R D Chancellor [ED.], ProceedingsWorld Conferenceof Birds of Prey,Vienna, Austria. ß1983. Distributionand abundanceof Ospreysin the United States.Pages175-186 in D.M. Bird [ED.], Biologyand managementof BaldEaglesand Ospreys. Harpell Press,Ste. Anne de Bellevue, Quebec, Cana-
peake Bay (United StatesCoast Guard 1999). This suggestsan occupation rate of 56.2% and 58.3% for day and light markers,respectively,and a combined occupation rate of 57.1%. Clearly the increase in navigationalstructuresfrom 1875-1929 over the 20-yrperiod has elevatedtheir relativeimportance to Ospreysin the bay.It is alsolikely that
da.
J.C. OGDEN.1970.Estimatedstatusof Osprey the attitudeof the CoastGuard towardnestingOs- --aND populationsin the United States.J. Wildl.Manage.34: preyshasincreasedthe occupationrates.Through214-217. out the 1960sand early 1970sit wasstandardoperating procedure for the Coast Guard to remove
Osprey nestsfrom navigationalaidesduring any
--AND W.T. VANVELZEN. 1972. Migration patterns and winteringlocalitiesof AmericanOspreys. J. Wildl. Manage. 36:1133-1141.
period of the nestingcycleor to alter structuresto --, M.M. SMITH, AND V.D. STOTrS. 1974. The 1973 prevent nesting.A shift to a more Osprey-friendly distributionand abundanceof breeding Ospreysin
policyduring the late 1970shas likely had a posi-
the ChesapeakeBay. Chesapeake Sci.15:125-133.
tive impact on the bay-widepopulafon. HOUGHTON,L.M. and L.M. RYMON.1994. Nesting distriIn terms of factorsrelevant to the Ospreybreedbution and populationstatusof U.S. Ospreys1994.J ing population, the ChesapeakeBay is a different RaptorRes'.31:44-53. systemthan it wasduring the early 1970s.Likewise, JONES,F.M. 1936. Ospreys. Oologist53:143-146. R.S. 1971.Populationdynamicsof Ospreysin the bay in the 1970swasa different placethan it K•NNED¾, Tidewater,Virginia, 1970-1971. M.A. thesis,College was during historicaltimes. Fish populationshave of William and Mary, Williamsburg,VA U.S.A. changed,the shorelinehasundergonerapid alter1977.The statusof the Ospreyin TidewaterViration, and structuressuitablefor nestinghave in- --.
ginia, 1970-1971.Pages121-133 inJ.C. Ogden lED ], Trans. North Am. Osprey Res. Conf. U.S. Natl. Park Serv. Proc. Ser. 2. Washington,DC U.S.A. cal, bay-wideOsprey population. Given ongoing MCLEAN,P.K. 1986. The feeding ecology of the Chesachangesin the bay systemthat are functionallyrelpeake Bay Ospreys and the growth and behavior of evant to the Ospreypopulation,it is alsonot clear their young.M.A. thesis,Collegeof William and Mary, that historical status and distribution information Williamsburg, VA U.S.A. would be useful in predicting current and future -and M.A. BYP, D. 1991. Feeding ecologyof Chesapopulation patterns. However, based on the variapeake Bay Ospreysand growth and behavior of their young. WilsonBull. 103:105-111. tion in recoveryrates throughout the bay, it does appear that the populationexperienceda decline OVERTON,W.S. AND D.E. DAVIS.1969. Estimating the numbers of animals in wildlife populations. Pages of a greater magnitude than was previouslybe403-456 in R.H. Giles,Jr. [ED.], Wildlife management lieved. Additional benchmark surveyswill be retechniques3rdEd. Washington,DC U.S.A. quired to project when and under what circumREESE, J.G. 1969.A Maryland Ospreypopulation75 years stancesthe bay-wide population may begin to ago and today.MD BirdLife25:116-119. creased. Based on available information,
it has not
been possibleto determine the size of the histori-
approach some upper limit.
--.
We would like to thank Carlton Adams, Rene Peace,
Cheryl Pope,Mark Roberts,Gloria Sciole,LydiaWhitaker, Bonnie Willard, and Anne Womack for administrative
assistance. Jackie Howard provided logistical support. Bart Paxton producedthe studyarea map. Fundingwas providedby the LegacyProgramof the U.S. Department
1970.Reproduction in a Chesapeake BayOsprey population. Auk 87:747-759.
ACKNOWLEDGMENTS
--.
1975.Ospreynestsuccess in EasternBay,Maryland. Chesapeake Sci.16:56-61.
--.
1977.Reproductivesuccess of Ospreysin central ChesapeakeBay.Auk 94:202-221. 1996. Osprey. Pages 92-93 in C.S. Robbins and E.A.T. Blom [EDS.], Atlas of the breeding birds of
54
WATTS ET AL.
Maryland and the District of Columbia. Univ. of Pittsburgh Press,Pittsburgh,PA U.S.A. RHODES, L.I. 1972. Successof Ospreynest structuresat Martin National Wildlife Refuge. J. Wildl. Manage.36: 1296-1299.
ROBERTS,K.S. 1982. The development of behavior in nestling Ospreys.M.A. thesis,College of William and Mary, Williamsburg,VA U.S.A.
VOL. 38, No. 1
TRUITT,R.V. 1969. The Ospreysof Great Neck. Atlantic Nat. 24:195-200.
TYRRELL, W.B. 1936. The Ospreysof Smith's Point, Virginia. Auk 53:261-268. UNITEDSTATES COASTGUAP, D. 1999. Light list. Vol. II. Atlantic Coast, ShrewsburyRivex;New Jersey to Little River, South Carolina.
United
States Coast Guard,
Washington, DC U.S.A. SCHMID, F.C. 1977.A 1934vs.1967comparisonof Osprey ViA,J.W. 1975. Eggshellthinning and pesticideresidues nesting populations.Pages 135-137 in J.C. Ogden in Ospreysfrom the lower ChesapeakeBay.M.A. the[ED.], Trans. N. Amex-.Osprey Res. Conf. U.S. Natl. sis, College of William and Mary, Williamsburg,VA Park Serv., Proc. Sex:2. Washington, DC U.S.A. U.S.A. SPITZER, P.R. 1989. Osprey.Pages299-305 in B.C. Pen- WESTALL, n.J. 1990. Osprey.Pages22-28 in B.G. Pendledleton [ED.], Proc. Northeast Raptor Management ton [ED.], Proc. SoutheastRaptor Management SymSymposiumand Workshop. Natl. Wildl. Fed. Sci. posium and Workshop.Natl. Wildl. Fed. Sci. Tech Tech. Sex-.No. 13. Washington,DC U.S.A. Sex:No. 14. Washington,DC U.S.A. STINSON, C.H. 1976. The evolutionaryand ecologicalsigWIEMEYER, S.N. 1971. Reproductivesuccessof Potomac nificance of the clutch size of the Osprey.M.A. thesis, River Ospreys,1970. Chesapeake Sci.12:278-280. College of William and Mary, Williamsburg,VA U.S.A. --, P.R. SPITZER,W.C. KRANTZ, T.G. LAIVIONT, and E. --AND M.A. BXW, D. 1976. A comparisonof past and CROMARTIE. 1975. Effectsof environmentalpollutants present Ospreybreeding populationsin CoastalViron Connecticut and Maryland Ospreys.J. Wildl. Manginia. Bi,rl Banding47:258-262. age.39:124-139. STOTTS,V.D. 1958. Use of offshoreduck blinds by nesting waterfowl in the Maryland portion of ChesapeakeBay and its estuaries. Proc. S.E. Assoc. Game Fish Comm. 12: Received8 November 2001; accepted20 September2003 280-285. Former AssociateEditor: Troy Wellicome